A community challenge to predict clinical outcomes after immune checkpoint blockade in non-small cell lung cancer (original) (raw)
Abstract
Background
Predictive biomarkers of immune checkpoint inhibitor (ICI) efficacy are currently lacking for non-small cell lung cancer (NSCLC). Here, we describe the results from the Anti–PD-1 Response Prediction DREAM Challenge, a crowdsourced initiative that enabled the assessment of predictive models by using data from two randomized controlled clinical trials (RCTs) of ICIs in first-line metastatic NSCLC.
Methods
Participants developed and trained models using public resources. These were evaluated with data from the CheckMate 026 trial (NCT02041533), according to the model-to-data paradigm to maintain patient confidentiality. The generalizability of the models with the best predictive performance was assessed using data from the CheckMate 227 trial (NCT02477826). Both trials were phase III RCTs with a chemotherapy control arm, which supported the differentiation between predictive and prognostic models. Isolated model containers were evaluated using a bespoke strategy that considered the challenges of handling transcriptome data from clinical trials.
Results
A total of 59 teams participated, with 417 models submitted. Multiple predictive models, as opposed to a prognostic model, were generated for predicting overall survival, progression-free survival, and progressive disease status with ICIs. Variables within the models submitted by participants included tumor mutational burden (TMB), programmed death ligand 1 (PD-L1) expression, and gene-expression–based signatures. The best-performing models showed improved predictive power over reference variables, including TMB or PD-L1.
Conclusions
This DREAM Challenge is the first successful attempt to use protected phase III clinical data for a crowdsourced effort towards generating predictive models for ICI clinical outcomes and could serve as a blueprint for similar efforts in other tumor types and disease states, setting a benchmark for future studies aiming to identify biomarkers predictive of ICI efficacy.
Trial registration: CheckMate 026; NCT02041533, registered January 22, 2014.
CheckMate 227; NCT02477826, registered June 23, 2015.
Discover the latest articles and news from researchers in related subjects, suggested using machine learning.
Background
Immune checkpoint inhibitors (ICIs) have revolutionized cancer treatment, with advanced non-small cell lung cancer (NSCLC) among the tumor types showing longer survival with ICIs than with chemotherapy in multiple treatment lines [1,2,3,4]. While ICIs have demonstrated high response rates in some tumor types [5], not all patients with advanced cancer eligible for ICIs respond to them, highlighting the need for biomarkers predictive of their efficacy [6,7,8,9].
Multiple biomarkers have been explored as predictors of clinical outcomes, including programmed death ligand 1 (PD-L1) expression and tumor mutational burden (TMB), which are used in clinical practice but are imperfect predictors of ICI response and not standardized across studies [10]. Associations between clinical outcomes with ICIs and certain biomarkers, including immune-related gene expression, gene signatures, and adaptive immune receptor repertoire features (e.g., T-cell–inflamed gene expression, chemokine expression, immunologic constant of rejection [ICR], T-cell receptor repertoire clonality) have been reported [11,12,13,14,15,16]. However, a comparison of performance of these markers using large, independent validation datasets is lacking. Biomarker studies in NSCLC have been limited by small sample sizes and lack of a chemotherapy control arm, preventing differentiation between prognostic and predictive biomarkers [17,18,19,20]. Robust predictive biomarkers will be critical to identify patients most likely to benefit from ICIs and could guide treatment choice and serve as trial stratification factors.
Here, we describe the Anti–PD-1 Response Prediction DREAM Challenge, a crowdsourced initiative that enabled the assessment of predictive models using data from two randomized clinical trials (RCTs) of first-line ICIs in NSCLC. We used an innovative model-to-data paradigm that enabled broad participation without requiring direct access to restricted data. This approach protected patient confidentiality while mitigating the risk of overfitting, lack of replicability, and irreproducibility [21, 22].
The pioneering design of this Challenge addressed scientific and technical issues that the community has faced in identifying robust predictors of ICI efficacy. The engagement of worldwide researchers using a reference dataset and consistent metrics leveled the playing field and allowed for head-to-head comparisons of model performance. The use of data from large, mature, well-annotated RCTs eliminated, at least partially, the limitations of analyses based on smaller trials, observational studies, or restricted sample cohorts. Metrics using information from both treatment and control arms allow the differentiation of prognostic models from those that are predictive of population-level benefit from ICI therapies. Finally, the combination of closed competitive and open cooperative phases of this Challenge enabled unprecedented collaboration among academic and industry leaders.
Methods
Challenge questions
A steering committee, including members from Bristol Myers Squibb, Sage Bionetworks, and oncology physician-scientists, developed clinically relevant questions that could be addressed through the DREAM Challenge framework. This Challenge comprised three sub-challenges to identify models predictive of progression-free survival (PFS), overall survival (OS), and best overall response (BOR) of progressive disease (PD) with ICI treatment (Table 1) [23].
Table 1 Challenge questions and metrics used for performance evaluation [23]
Training and validation datasets
The design of the Challenge is summarized in Fig. 1. To protect patient confidentiality, participants could not directly access the evaluation dataset (CheckMate 026), in line with the model-to-data paradigm [21]. Because of the abundance of publicly available datasets, participants were not provided training data, thereby maintaining a large testing dataset. The variables available to participants and details on the training data used for model construction are shown in Additional file 1: Table S1 and Supplementary Methods 1, respectively. Gene-expression–based predictors are shown in Additional file 1: Tables S2 and S3. Participants developed and trained predictive models using publicly available resources, including those referenced on the Challenge website (TIDE resources [24], The Cancer Research Institute’s iAtlas [25], and other published data [[26](/article/10.1186/s12967-023-04705-3#ref-CR26 "Synapse. Anti-PD1 response prediction DREAM challenge. 2021. https://www.synapse.org/#!Synapse:syn18404605/wiki/607227
            . Nov 2021.")\]) and other datasets accessible via their institutions. To ensure proper execution of the independently trained models on the embargoed evaluation dataset, a synthetic dataset with the same formatting as the evaluation dataset was available. Participants submitted dockerized models \[[27](/article/10.1186/s12967-023-04705-3#ref-CR27 "Merkel D. Docker: lightweight Linux containers for consistent development and deployment. Linux J. 2014.
              https://doi.org/10.1056/NEJMoa1613493

            .")\] consisting of the model itself plus software components to run the model in the DREAM evaluation infrastructure (Additional file [1](/article/10.1186/s12967-023-04705-3#MOESM1): Supplementary Methods 3). This approach supported reproducibility and a platform-independent evaluation of submitted models. Each team could submit different models for each sub-challenge.
Fig. 1
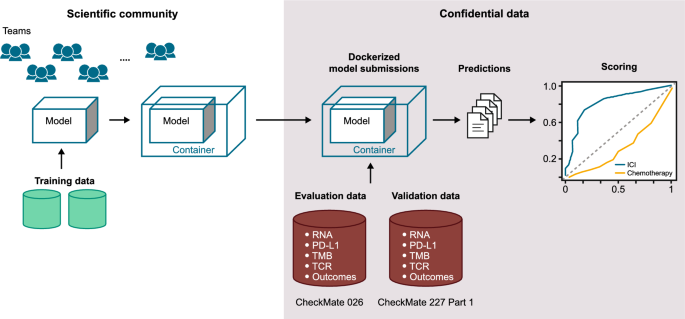
Challenge design. ICI immune checkpoint inhibitor, PD-L1 programmed death ligand 1, TCR T-cell receptor, TMB tumor mutational burden
The evaluation dataset from CheckMate 026 (NCT02041533) [28] was selected because it was large, contained multimodal data, was well-characterized at the clinical and molecular level, and allowed potential differentiation between predictive and prognostic models [29]. In CheckMate 026, patients with untreated stage IV or recurrent NSCLC and tumor PD-L1 ≥ 1% were randomized 1:1 to receive nivolumab or platinum-based chemotherapy [28]. Top-performing models identified with CheckMate 026 data were validated on an independent dataset from CheckMate 227 (Part 1) (NCT02477826) in patients with stage IV or recurrent NSCLC [30, 31]. Identification of potential biomarkers of response to nivolumab were protocol-defined exploratory end points in both CheckMate 026 and 227. In CheckMate 227, patients with tumor PD-L1 ≥ 1% (Part 1a) received either nivolumab + ipilimumab, nivolumab monotherapy, or chemotherapy; patients with PD-L1 < 1% (Part 1b) received either nivolumab + ipilimumab, nivolumab + chemotherapy, or chemotherapy for the first-line treatment of metastatic NSCLC [30, 31]. Top-performing models were validated in the nivolumab + ipilimumab arms of CheckMate 227 in patients with any level of PD-L1 expression, as these arms were part of the successful primary end points of that trial. Baseline characteristics of patients in CheckMate 026 and 227 were published previously (Additional file 1: Tables S4 and S5) [28, 30, 31].
Assessing model performance
The validation dataset was limited to samples with gene expression data. Challenge models were required to be robust to missing TMB data, and their predictions were checked for valid data format, including type, completeness, and sample matching, prior to assessment of model performance. Performance metrics (Table 1) were designed to identify predictive rather than prognostic models: top-performing models should accurately rank response measures for patients in the ICI arm but not in the chemotherapy arm to reflect a model’s capacity to inform a clinical decision in favor of one therapy over another. For the PFS sub-challenge, we computed for each model the Harrell’s concordance index (C-index) of PFS and model predictions as a basal metric (BM) calculated in each arm [32]. We used the C-index in the OS sub-challenge after first correcting for potential effects caused by patient crossover from the chemotherapy arm to the nivolumab arm in CheckMate 026 [33]. The C-index was used for the OS and PFS sub-challenges, as it applies to time-to-event outcomes [32]. For the BOR sub-challenge, the BM was the area under the curve (AUC) of the receiver operator curve (ROC) of the model predictions in each arm.
For each sub-challenge, the primary metric applied to each model was the difference in squared scaled BM (DSS) between the nivolumab arm and chemotherapy arm, where \(scaled\; (BM)= 2\times (BM-0.5)\) (Table 1, Additional file 1: Fig. S1) [34, [35](/article/10.1186/s12967-023-04705-3#ref-CR35 "Schuler A, Baiocchi M, Tibshirani R, Shah N. A comparison of methods for model selection when estimating individual treatment effects. arxiv. 2018. https://doi.org/10.48550/arXiv.1804.05146
.")\]. Models that performed well in the nivolumab arm and randomly in the chemotherapy arm had positive primary scores. Models that performed well in the chemotherapy arm but randomly in the nivolumab arm had negative primary scores. Models that performed the same in each arm had a score of 0\. Squaring of the BM allowed us to accommodate models that predicted well in the negative direction as good predictors. A detailed description of the motivation for using DSS and a comparison to other potential metrics are available in Additional file [1](/article/10.1186/s12967-023-04705-3#MOESM1): Supplementary Methods 2.A team’s model performance was determined in each sub-challenge. To be eligible for top-performing status, a model had to outperform the TMB baseline model based on the primary metric (Bayes factor relative to TMB baseline model, K TMB > 3, see Additional file 1: Supplementary Methods 3). A description of baseline models and published reference models is provided in Additional file 1: Tables S2 and S3. For models meeting this criterion, we computed K DSS_Max, the Bayes factor relative to the highest primary metric in that sub-challenge. Models with K DSS_Max < 3 were considered tied with the highest scoring model. The BM from the nivolumab arm was used for tie-breaking. If multiple tied models had tie-breaking scores close to the best tie-breaking score, they were included as top-performers for the sub-challenge.
Results
Overall participation in this challenge
Fifty-one teams and eight individuals made at least one valid submission to the Challenge, with 417 models submitted across the three sub-challenges aiming to identify models predictive of PFS, OS, and BOR of PD with ICI treatment (Table 1) [23]. Top-performing model descriptions are available on the Challenge website (https://www.synapse.org/#!Synapse:syn18404605/wiki/609124), Table 2, and Additional file 1: Supplementary Methods 1. Author teams’ contributions to their respective model are reported in the author teams’ contribution section of Additional file 1. Top-performing models outperformed the 14 comparator models for each sub-challenge.
Table 2 Description of top-performing models
Prediction of progression-free survival
The BM for the PFS sub-challenge was the C-index for observed PFS and model predictions. The primary metric used to determine model performance was the DSS between the nivolumab arm and chemotherapy arm (Table 1).
In the PFS sub-challenge, the Netphar and I-MIRACLE models outperformed the TMB baseline model, achieving C-index DSS of 0.19 and 0.087, respectively (Fig. 2A). The Netphar model was based on a decision tree positing that high TMB (≥ 243 missense mutations) was necessary but not sufficient to induce a response to nivolumab, and that tumor cell % PD-L1 expression became relevant only when TMB was high (Fig. 2B; Additional file 1: Supplementary Methods 1).
Fig. 2
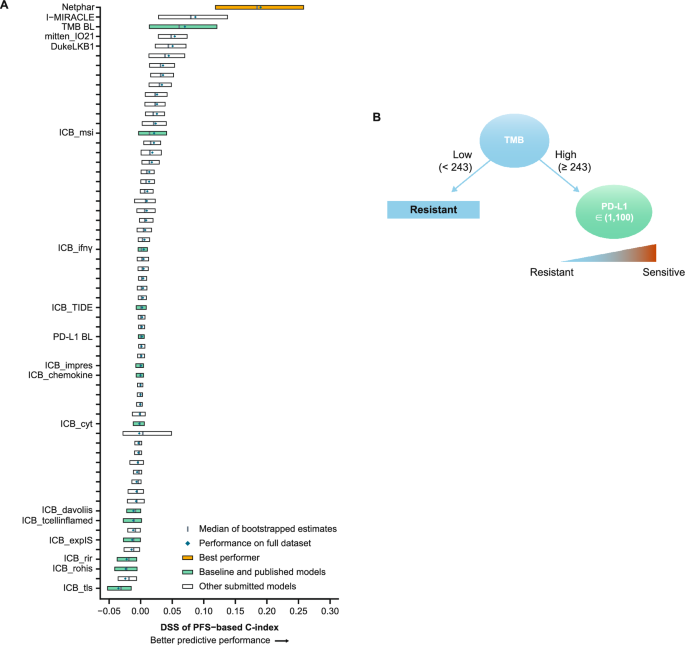
Prediction of PFS with submitted models. A Bootstrapped estimates of model performance in CheckMate 026 (boxes are bound by the 25th and 75th percentiles). B Decision tree summarizing the Netphar model. C Netphar performance in the chemotherapy and nivolumab arms of CheckMate 026. D Netphar performance in the chemotherapy and nivolumab + ipilimumab arms of CheckMate 227. BL baseline, C-index concordance index, DSS BM difference in squared scaled basal metrics, PD-L1 programmed death ligand 1, PFS progression-free survival, TMB tumor mutational burden
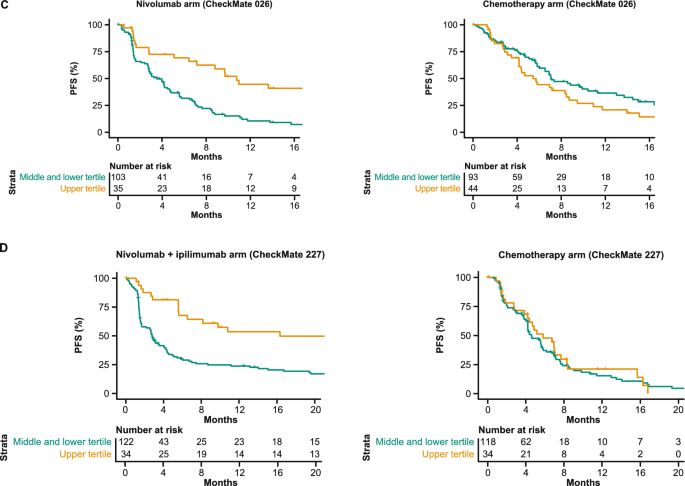
In the nivolumab arm of CheckMate 026, patients with Netphar scores in the upper tertile had longer median PFS (10.8 months) than patients with scores in the middle and lower tertiles (3.5 months), whereas in the chemotherapy arm, patients with scores in the middle and lower tertiles had slightly longer median PFS (7.1 months) than patients with scores in the upper tertile (5.4 months) (Fig. 2C). Netphar scores in the upper tertile were associated with improved median PFS (16.3 months) in the nivolumab + ipilimumab arm of CheckMate 227 compared with scores in the middle and lower tertiles (2.8 months). In the chemotherapy arm of CheckMate 227, patients with scores in the upper tertile had similar median PFS (5.8 months) to patients with scores in the middle and lower tertiles (4.6 months) (Fig. 2D).
Prediction of overall survival
The BM for the OS sub-challenge was the C-index for observed OS and model predictions. As for the PFS sub-challenge, the primary metric was DSS between the nivolumab arm and chemotherapy arm (Table 1).
In the OS sub-challenge, three models had higher C-index DSS than baseline models, including TMB and PD-L1, with I-MIRACLE, FICAN-OSCAR, and DukeLKB1 achieving DSS of 0.050, 0.046, and 0.032, respectively (Fig. 3A). Although the @jacob.pfeil model had the highest DSS (0.0721), bootstrapped estimates of performance for that model showed substantial variation. The I-MIRACLE model gave patients a score of 1, 2, or 3 based on their TMB and PD-L1 values (Fig. 3B and Table 2).
Fig. 3
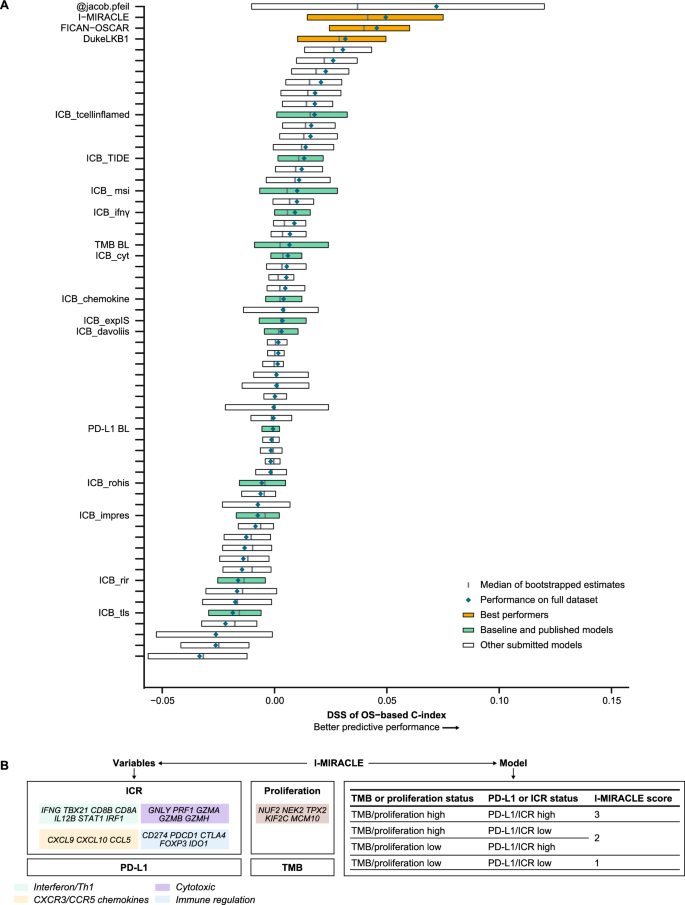
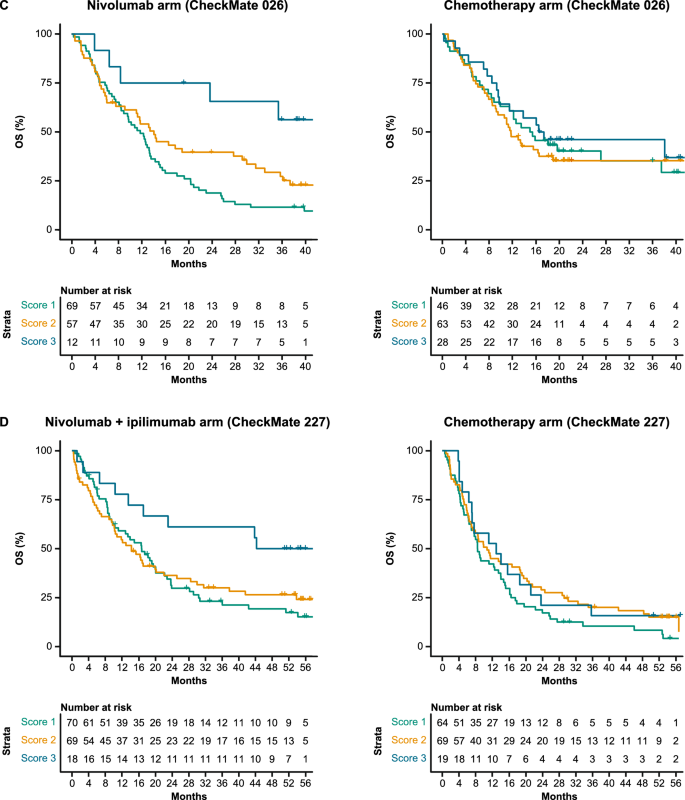
Prediction of OS with submitted models. A Bootstrapped estimates of model performance in CheckMate 026 (Boxes are bound by the 25th and 75th percentile). B Classification principle of the I-MIRACLE model. C I-MIRACLE performance in the chemotherapy and nivolumab arms of CheckMate 026. D I-MIRACLE performance in the chemotherapy and nivolumab + ipilimumab arms of CheckMate 227. BL baseline, C-index concordance index, DSS BM difference in squared scaled basal metrics, ICR immunologic constant of rejection, OS overall survival, PD-L1 programmed death ligand 1, PFS progression-free survival, TMB tumor mutational burden
In the nivolumab arm of CheckMate 026, patients with I-MIRACLE scores of 3 had better median OS (not reached) than patients with scores of 2 (14.1 months) or 1 (11.8 months), whereas in the chemotherapy arm, OS was similar in all patients regardless of I-MIRACLE score (15.2, 11.7, 16.9 months with a score of 1, 2, and 3, respectively) (Fig. 3C). In CheckMate 227, I-MIRACLE scores of 3 were associated with prolonged median OS (44.3 months) in the nivolumab + ipilimumab arm compared with scores of 2 (14.3 months) or 1 (16.7 months). OS was similar in the chemotherapy arm regardless of the score (8.5, 10.7, 12.9 months with a score of 1, 2, and 3, respectively) (Fig. 3D).
Prediction of best overall response of progressive disease
The BM for the BOR sub-challenge was the ROC-AUC of the model predictions in each arm, and the primary metric used for model performance was DSS between the nivolumab and chemotherapy arm (Table 1).
Four models in the BOR sub-challenge surpassed the performance of all baseline models. The DSS of ROC-AUC was 0.055 for cSysImmunoOnco, 0.052 for Aginome-Amoy, 0.049 for Team TIDE, and 0.039 for FICAN-OSCAR (Fig. 4A). The cSysImmunoOnco model applied regularized multi-task linear regression to model hallmarks of anticancer immune response based on quantitative descriptors of the tumor microenvironment and TMB (Fig. 4B).
Fig. 4
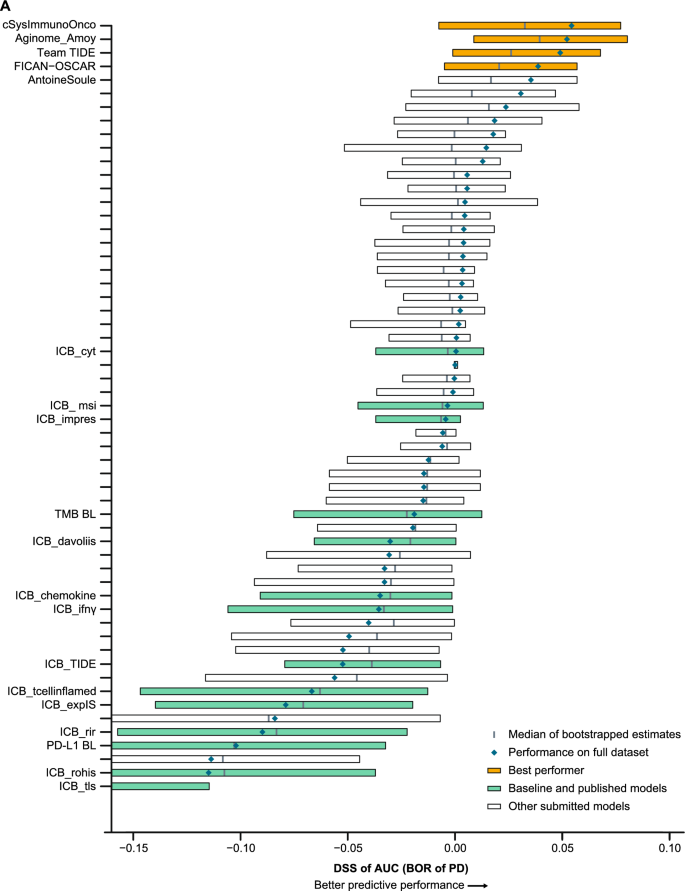
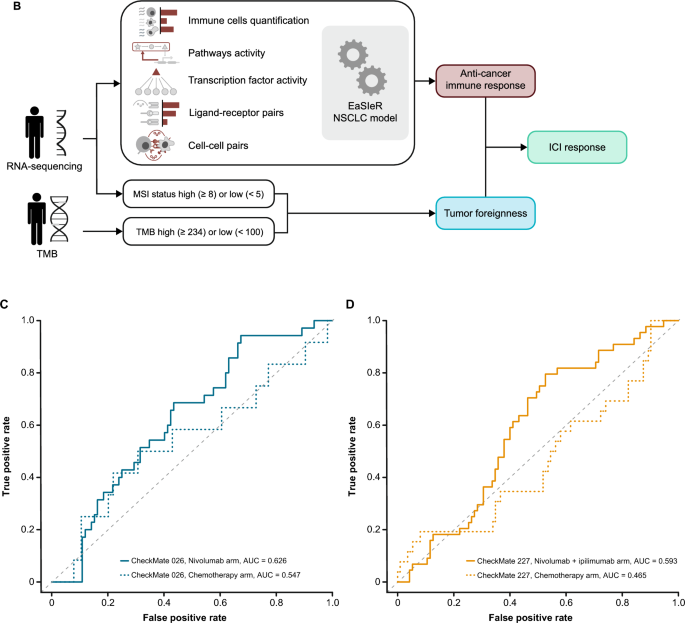
Prediction of BOR of PD with submitted models. A Bootstrapped estimates of model performance in CheckMate 026 (boxes are bound by the 25th and 75th percentiles). B Principle of the cSysImmunoOnco model. C cSysImmunoOnco model performance in CheckMate 026 and D CheckMate 227. The grey dotted line is the line of non-determination. AUC area under the curve, BL baseline, BOR best overall response, DSS BM difference in squared scaled basal metrics, EaSIeR estimate systems immune response, ICI immune checkpoint inhibitor, ICR immunologic constant of rejection, MSI microsatellite instability, NSCLC non-small cell lung cancer, OS overall survival, PD progressive disease, PD-L1 programmed death ligand 1, TMB tumor mutational burden
The ROC-AUC with the cSysImmunoOnco model was higher in the nivolumab arm of CheckMate 026 (0.626) and nivolumab + ipilimumab arm of CheckMate 227 (0.593) than in the chemotherapy arm of CheckMate 026 (0.547) or the chemotherapy arm of CheckMate 227 (0.465) (Fig. 4C and D).
Model performance
Several models had similar or better performance in CheckMate 227 than in CheckMate 026 (Additional file 1: Fig. S2). Netphar was the top-performing model for PFS prediction in the nivolumab arm of CheckMate 026 and in the nivolumab + ipilimumab arm of CheckMate 227. The Netphar model had good predictive accuracy for OS in the nivolumab + ipilimumab arm of CheckMate 227. The I-MIRACLE model had good predictive accuracy for PFS in CheckMate 026 (Additional file 1: Table S6). The cSysImmunoOnco model did not have good predictive accuracy for PFS or OS in CheckMate 026.
Gene signatures
Multiple teams (cSysImmunoOnco, I-MIRACLE, Team TIDE, and FICAN-OSCAR) leveraged publicly available gene expression data to train the models and deemed the expression of a select assortment of genes important (Additional file 1: Supplementary Methods 4). The DukeLKB1 six-feature model included a validated transcriptional signature of STK11 functional loss as a predictive feature [36]. Among the models relying on gene expression information, the cSysImmunoOnco model used the expression of > 100 genes, whereas FICAN-OSCAR relied on five genes (Additional file 1: Fig. S3A). A total of 140 genes ranked important by various models were selected as seeds for downstream analysis. Additional genes that were highly correlated to the seed genes (correlation > 0.85) were included to form a set of 403 genes grouped into three clusters using hierarchical clustering (Additional file 1: Fig. S3B). Analysis of the three clusters showed the enrichment of three main mechanisms. The first cluster represented pathways relevant to tumor intrinsic cell-cycle dysregulation (Additional file 1: Fig. S3Ci, Di). The second cluster included pro-inflammatory immune signatures related to interferon-gamma signaling and antigen presentation (Additional file 1: Fig. S3Cii, Dii). The third cluster included immunosuppressive signatures related to interleukin-10 signaling. The P values associated with the third cluster were not small, suggesting weak enrichment, likely due to the small cluster size (Additional file 1: Fig. S3Ciii, Diii). These results show an association of the top predictive genes from the benchmarked models with well-established pathways related to cell-cycle dysregulation and pro-inflammatory immune response.
Discussion
Not all patients with NSCLC achieve a response with ICIs. Consequently, there is a strong need for predictive biomarkers of outcomes with ICIs [9]. Studies reporting associations with ICI response in NSCLC have been limited by small sample sizes from single ICI treatment arms [17, 19, 20]. This Challenge addressed these shortcomings by using two large and well-characterized phase III RCTs and by comparing predicted responses between ICI- and chemotherapy-treated arms, thereby distinguishing treatment response prediction from prognostic effects. The model-to-data framework was an important characteristic of this Challenge. While participants received limited feedback with this paradigm during model development, which prevented model refinement, this ensured an unbiased and reproducible assessment of the Challenge models [21]. The model-to-data framework could be made accessible to support evaluation of in silico predictors using various datasets while maintaining data privacy. This study established a robust standard for researchers aiming to identify biomarkers predictive of ICI efficacy. We expect that future Challenges will support efficient biomarker discovery across multiple contexts.
Participants integrated prior knowledge of ICIs with modeling methods like decision trees and regularized regression, additive models with hand-crafted weights, and decision trees with additive models. Preliminary attempts to aggregate models did not show improvements over individual models. While submitted models significantly outperformed TMB and PD-L1 as univariate predictors, most of the top-performing models included both variables, sometimes combined with gene expression signatures such as ICR or a proliferation signature, which reflected the clinical importance of TMB and PD-L1. This aligns with the observations obtained in tumor types, including head and neck squamous cell carcinoma (HNSCC) and melanoma, in which a T-cell–inflamed gene expression profile (similar to ICR) and TMB predicted PFS in patients receiving pembrolizumab [11]. Likewise, a combined assessment of TMB and an inflammatory signature predicted BOR, PFS, and OS in patients with advanced melanoma receiving nivolumab or nivolumab + ipilimumab [37]. A high ICR score predicted survival or response in patients with multiple tumor types treated with ICIs [14, 16].
These results indicate that a combination of PD-L1, TMB, and immune gene signatures might be able to identify a subgroup of patients with NSCLC likely to respond to ICIs and could be used for the design of a prospective phase III trial or to guide treatment choice. There is no single ‘magic bullet’ biomarker or model-building approach to predict response to ICIs. The biomarker content of top-performing models, as well as the exploration of their gene signature content, reinforce the need to assess tumor biology, tumor immunogenicity, and immune system status to identify patients most likely to benefit from ICI treatment. However, top-performing models differed across sub-challenges, suggesting that composite models have different predictive potential, depending on the clinical end point assessed. For example, TMB and PD-L1 seem important for the prediction of PFS and OS, confirming previous studies [38], while mechanisms such as apoptosis, T-cell cross talk, and adaptive immune resistance seem important for the prediction of response. Future precision medicine approaches will benefit from the exploration and development of targeted composite biomarker strategies.
The models identified may be generalizable to ICI datasets other than first-line treatment in metastatic NSCLC. Contributing teams used training datasets from other tumor types (melanoma or HNSCC), and the top-performing models in CheckMate 026 were validated in CheckMate 227 with different primary end points. These observations suggest that this approach may provide a blueprint to support modeling initiatives in diverse tumor types. The performance of the Netphar model in the evaluation dataset of CheckMate 026 is not surprising and aligns with the fact that the coefficients of the Netphar model were based on the summary statistics of Checkmate 026 data. However, the Netphar model was validated in the external CheckMate 227 dataset, which confirmed its predictive accuracy.
A possible limitation of this study is that TMB, frequently used in the submitted models, may be inferred from DNA or RNA sequencing data and is a proxy for tumor ‘foreignness’ but does not capture neoantigen clonality and abundance or non-canonical neoantigens generated from other tumor aberrations [39, 40]. Data such as T-cell/B-cell receptor repertoire, tobacco use, Eastern Cooperative Oncology Group (ECOG) performance status, age, and sex are not readily available in public datasets; therefore, participants did not always use them, and their role in predicting response to ICIs needs to be explored further. NSCLC is a genetically heterogeneous disease [41], and specific subpopulations may differ in optimal biomarkers predictive of therapy response. While transcriptional signatures predictive of functional STK11 and KEAP1/NFE2L2 alterations were used in some models, integration of transcriptional phenotypes with fuller exome datasets across larger cohorts will be necessary to discover these subtype-specific biomarkers. Other limitations were the similarity of PFS and OS between the nivolumab and chemotherapy treatment groups of CheckMate 026, and the exclusion of patients with PD-L1 expression < 1% in CheckMate 026. Although clinical and molecular data sets from both trials are large and rich, ascertainment of genomics data was incomplete because of logistical limitations. When the CheckMate 026 and 227 studies were conducted, chemotherapy was the standard of care; the current standard is chemotherapy plus ICI [42]. The models identified here should be tested in the context of this new standard.
Conclusions
This pioneering study showed that a crowdsourced approach could successfully identify clinical and translational characteristics predictive of ICI efficacy. This analysis improves the understanding of the mechanisms of tumor sensitivity and resistance to treatment, which will support the development of therapies for patient subpopulations unlikely to benefit from current ICI regimens. As the methods for measuring TMB and PD-L1 are becoming established, the models identified herein could be easily used for patient stratification in a prospective clinical trial and in clinical practice once validated.
The study provides a roadmap for successful partnership between academic and industry scientists that allows for robust, reproducible biomarker testing while protecting patient data and incentivizing collaboration. We hope that the DREAM Challenge framework will be used to analyze data from many phase III trials, to speed the development of clinically actionable biomarkers and improve patient outcomes.
Availability of data and materials
Abbreviations
AUC:
Area under the curve
BM:
Basal metric
BOR:
Best overall response
C-index:
Harrell’s concordance index
DSS:
Difference in squared scaled
ECOG:
Eastern Cooperative Oncology Group
HNSCC:
Head and neck squamous cell carcinoma
ICI:
Immune checkpoint inhibitor
ICR:
Immunologic constant of rejection
NSCLC:
Non-small cell lung cancer
OS:
Overall survival
PD:
Progressive disease
PD-L1:
Programmed death ligand 1
PFS:
Progression-free survival
RCT:
Randomized clinical trial
ROC:
Receiver operator curve
TMB:
Tumor mutational burden
References
- Antonia SJ, Borghaei H, Ramalingam SS, et al. Four-year survival with nivolumab in patients with previously treated advanced non-small-cell lung cancer: a pooled analysis. Lancet Oncol. 2019;20(10):1395–408.
Article CAS PubMed PubMed Central Google Scholar - Herbst RS, Giaccone G, de Marinis F, et al. Atezolizumab for first-line treatment of PD-L1-selected patients with NSCLC. N Engl J Med. 2020;383(14):1328–39.
Article CAS PubMed Google Scholar - Reck M, Rodriguez-Abreu D, Robinson AG, et al. Pembrolizumab versus chemotherapy for PD-L1-positive non-small-cell lung cancer. N Engl J Med. 2016;375(19):1823–33.
Article CAS PubMed Google Scholar - Borghaei H, Gettinger S, Vokes EE, et al. Five-year outcomes from the randomized, phase III trials CheckMate 017 and 057: Nivolumab versus docetaxel in previously treated non-small-cell lung cancer. J Clin Oncol. 2021;39(7):723–33.
Article CAS PubMed PubMed Central Google Scholar - Cercek A, Lumish M, Sinopoli J, et al. PD-1 blockade in mismatch repair–deficient, locally advanced rectal cancer. N Engl J Med. 2022;386(25):2363–76.
Article CAS PubMed PubMed Central Google Scholar - Li J, He Q, Yu X, Khan K, Weng X, Guan M. Complete response associated with immune checkpoint inhibitors in advanced non-small-cell lung cancer: a meta-analysis of nine randomized controlled trials. Cancer Manag Res. 2019;11:1623–9.
Article CAS PubMed PubMed Central Google Scholar - Pu X, Wu L, Su D, Mao W, Fang B. Immunotherapy for non-small cell lung cancers: biomarkers for predicting responses and strategies to overcome resistance. BMC Cancer. 2018;18(1):1082.
Article CAS PubMed PubMed Central Google Scholar - Haslam A, Prasad V. Estimation of the percentage of US patients with cancer who are eligible for and respond to checkpoint inhibitor immunotherapy drugs. JAMA Netw Open. 2019;2(5):e192535–635.
Article PubMed PubMed Central Google Scholar - Cancer immunotherapy: the quest for better biomarkers. Nat Med. 2022;28:2437.
- Truesdell J, Miller VA, Fabrizio D. Approach to evaluating tumor mutational burden in routine clinical practice. Transl Lung Cancer Res. 2018;7(6):678–81.
Article CAS PubMed PubMed Central Google Scholar - Cristescu R, Mogg R, Ayers M, et al. Pan-tumor genomic biomarkers for PD-1 checkpoint blockade-based immunotherapy. Science. 2018;362(6411):3593.
Article Google Scholar - Litchfield K, Reading JL, Puttick C, et al. Meta-analysis of tumor- and T cell-intrinsic mechanisms of sensitization to checkpoint inhibition. Cell. 2021;184(3):596-614.e14.
Article CAS PubMed PubMed Central Google Scholar - Duan Q, Zhang H, Zheng J, Zhang L. Turning cold into hot: Firing up the tumor microenvironment. Trends Cancer. 2020;6(7):605–18.
Article CAS PubMed Google Scholar - Roelands J, Hendrickx W, Zoppoli G, et al. Oncogenic states dictate the prognostic and predictive connotations of intratumoral immune response. J Immunother Cancer. 2020;8(1): e000617.
Article PubMed PubMed Central Google Scholar - Bortone DS, Woodcock MG, Parker JS, Vincent BG. Improved T-cell receptor diversity estimates associate with survival and response to anti-PD-1 therapy. Cancer Immunol Res. 2021;9(1):103–12.
Article CAS PubMed Google Scholar - Roelands J, Kuppen PJK, Ahmed EI, et al. An integrated tumor, immune and microbiome atlas of colon cancer. Nat Med. 2023;29(5):1273–86.
Article CAS PubMed PubMed Central Google Scholar - Cho J-W, Hong MH, Ha S-J, et al. Genome-wide identification of differentially methylated promoters and enhancers associated with response to anti-PD-1 therapy in non-small cell lung cancer. Exp Mol Med. 2020;52(9):1550–63.
Article CAS PubMed PubMed Central Google Scholar - Hwang S, Kwon A-Y, Jeong J-Y, et al. Immune gene signatures for predicting durable clinical benefit of anti-PD-1 immunotherapy in patients with non-small cell lung cancer. Sci Rep. 2020;10(1):643.
Article CAS PubMed PubMed Central Google Scholar - Prat A, Navarro A, Paré L, et al. Immune-related gene expression profiling after PD-1 blockade in non-small cell lung carcinoma, head and neck squamous cell carcinoma, and melanoma. Cancer Res. 2017;77(13):3540–50.
Article CAS PubMed Google Scholar - Jung H, Kim HS, Kim JY, et al. DNA methylation loss promotes immune evasion of tumours with high mutation and copy number load. Nat Commun. 2019;10(1):4278.
Article PubMed PubMed Central Google Scholar - Guinney J, Saez-Rodriguez J. Alternative models for sharing confidential biomedical data. Nat Biotechnol. 2018;36(5):391–2.
Article CAS PubMed Google Scholar - Bentzen SM, Constine LS, Deasy JO, et al. Quantitative analyses of normal tissue effects in the clinic (QUANTEC): an introduction to the scientific issues. Int J Radiat Oncol Biol Phys. 2010;76(3 Suppl):S3–9.
Article PubMed PubMed Central Google Scholar - Vincent BG, SzustakowskI JD, Doshi P, Mason M, Guinney J, Carbone DP. Pursuing better biomarkers for immunotherapy response in cancer through a crowdsourced data challenge. JCO Precis Oncol. 2021;5:51–4.
Article PubMed Google Scholar - Fu J, Li K, Zhang W, et al. Large-scale public data reuse to model immunotherapy response and resistance. Genome Med. 2020;12(1):21.
Article PubMed PubMed Central Google Scholar - Eddy JA, Thorsson V, Lamb AE, et al. CRI iAtlas: an interactive portal for immuno-oncology research. F1000Res. 2020;9:1028.
Article PubMed PubMed Central Google Scholar - Synapse. Anti-PD1 response prediction DREAM challenge. 2021. https://www.synapse.org/#!Synapse:syn18404605/wiki/607227. Nov 2021.
- Merkel D. Docker: lightweight Linux containers for consistent development and deployment. Linux J. 2014. https://doi.org/10.1056/NEJMoa1613493.
Article Google Scholar - Carbone DP, Reck M, Paz-Ares L, et al. First-line nivolumab in stage IV or recurrent non-small-cell lung cancer. N Engl J Med. 2017;376(25):2415–26.
Article CAS PubMed PubMed Central Google Scholar - Oldenhuis CN, Oosting SF, Gietema JA, de Vries EG. Prognostic versus predictive value of biomarkers in oncology. Eur J Cancer. 2008;44(7):946–53.
Article CAS PubMed Google Scholar - Hellmann MD, Paz-Ares L, Bernabe Caro R, et al. Nivolumab plus ipilimumab in advanced non–small-cell lung cancer. N Engl J Med. 2019;381(21):2020–31.
Article CAS PubMed Google Scholar - Hellmann MD, Ciuleanu T-E, Pluzanski A, et al. Nivolumab plus ipilimumab in lung cancer with a high tumor mutational burden. N Engl J Med. 2018;378(22):2093–104.
Article CAS PubMed PubMed Central Google Scholar - Harrell FE Jr, Lee KL, Mark DB. Multivariable prognostic models: issues in developing models, evaluating assumptions and adequacy, and measuring and reducing errors. Stat Med. 1996;15(4):361–87.
Article PubMed Google Scholar - Allison A, White IR, Bond S. rpsftm: an R package for rank preserving structural failure time models. R J. 2017;9(2):342–53.
Article PubMed PubMed Central Google Scholar - Gao Z, Hastie T, Tibshirani R. Assessment of heterogeneous treatment effect estimation accuracy via matching. Stat Med. 2021;40(17):3990–4013.
Article PubMed PubMed Central Google Scholar - Schuler A, Baiocchi M, Tibshirani R, Shah N. A comparison of methods for model selection when estimating individual treatment effects. arxiv. 2018. https://doi.org/10.48550/arXiv.1804.05146.
Article Google Scholar - Kaufman JM, Yamada T, Park K, Timmers CD, Amann JM, Carbone DP. A transcriptional signature identifies LKB1 functional status as a novel determinant of MEK sensitivity in lung adenocarcinoma. Cancer Res. 2017;77(1):153–63.
Article CAS PubMed Google Scholar - Hodi FS, Wolchok JD, Schadendorf D, et al. TMB and inflammatory gene expression associated with clinical outcomes following immunotherapy in advanced melanoma. Cancer Immunol Res. 2021;9(10):1202–13.
Article CAS PubMed PubMed Central Google Scholar - Ricciuti B, Wang X, Alessi JV, et al. Association of high tumor mutation burden in non-small cell lung cancers with increased immune infiltration and improved clinical outcomes of PD-L1 blockade across PD-L1 expression levels. JAMA Oncol. 2022;8(8):1160–8.
Article PubMed PubMed Central Google Scholar - Blank CU, Haanen JB, Ribas A, Schumacher TN. Cancer Immunology. The “cancer immunogram.” Science. 2016;352(6286):658–60.
Article CAS PubMed Google Scholar - Rieder D, Fotakis G, Ausserhofer M, et al. nextNEOpi: a comprehensive pipeline for computational neoantigen prediction. Bioinformatics. 2021;38:1131–2.
Article PubMed Central Google Scholar - Chen Z, Fillmore CM, Hammerman PS, Kim CF, Wong K-K. Non-small-cell lung cancers: a heterogeneous set of diseases. Nat Rev Cancer. 2014;14(8):535–46.
Article CAS PubMed PubMed Central Google Scholar - Ettinger DS, Wood DE, Aisner DL, et al. Non-Small Cell Lung Cancer, Version 3.2022, NCCN Clinical Practice Guidelines in Oncology. J Natl Compr Canc Netw. 2022;20(5):497–530.
Article PubMed Google Scholar - Lapuente-Santana O, van Genderen M, Hilbers PAJ, Finotello F, Eduati F. Interpretable systems biomarkers predict response to immune-checkpoint inhibitors. Patterns. 2021;2(8): 100293.
Article CAS PubMed PubMed Central Google Scholar - Finotello F, Mayer C, Plattner C, et al. Molecular and pharmacological modulators of the tumor immune contexture revealed by deconvolution of RNA-seq data. Genome Med. 2019;11(1):34.
Article PubMed PubMed Central Google Scholar - Schubert M, Klinger B, Klunemann M, et al. Perturbation-response genes reveal signaling footprints in cancer gene expression. Nat Commun. 2018;9(1):20.
Article PubMed PubMed Central Google Scholar - Garcia-Alonso L, Iorio F, Matchan A, et al. Transcription factor activities enhance markers of drug sensitivity in cancer. Cancer Res. 2018;78(3):769–80.
Article CAS PubMed Google Scholar - Kaufman JM, Amann JM, Park K, et al. LKB1 Loss induces characteristic patterns of gene expression in human tumors associated with NRF2 activation and attenuation of PI3K-AKT. J Thorac Oncol. 2014;9(6):794–804.
Article CAS PubMed PubMed Central Google Scholar - Lei M, Siemers NO, Pandya D, et al. Analyses of PD-L1 and inflammatory gene expression association with efficacy of nivolumab +/- ipilimumab in gastric cancer/gastroesophageal junction cancer. Clin Cancer Res. 2021;27(14):3926–35.
Article CAS PubMed Google Scholar - Halkola AS, Joki K, Mirtti T, Mäkelä MM, Aittokallio T, Laajala TD. OSCAR: Optimal subset cardinality regression using the L0-pseudonorm with applications to prognostic modelling of prostate cancer. bioRxiv [Internet]. 2022. https://www.biorxiv.org/content/biorxiv/early/2022/07/02/2022.06.29.498064.full.pdf.
- Laajala TD, Joki K, Halkola AS. oscar: Optimal Subset Cardinality Regression (OSCAR) models using the L0-pseudonorm. 2022. https://CRAN.R-project.org/package=oscar August 2022.
- Miller LD, Chou JA, Black MA, et al. Immunogenic subtypes of breast cancer delineated by gene classifiers of immune responsiveness. Cancer Immunol Res. 2016;4(7):600–10.
Article CAS PubMed PubMed Central Google Scholar - Frattini V, Pagnotta SM, Tala, et al. A metabolic function of FGFR3-TACC3 gene fusions in cancer. Nature. 2018;553(7687):222–7.
Article CAS PubMed PubMed Central Google Scholar - Aran D, Hu Z, Butte AJ. xCell: digitally portraying the tissue cellular heterogeneity landscape. Genome Biol. 2017;18(1):220.
Article PubMed PubMed Central Google Scholar
Acknowledgements
Xiaole Shirley Liu contributed to the development of the TIDE model. Josue Samayoa contributed to the development of the @jacob.pfeil model. Abraham Apfel contributed data analysis advice. Medical writing and editorial support were provided by Thierry Deltheil, PhD, and Matthew Weddig of Spark Medica Inc., funded by Bristol Myers Squibb.
Previous presentation
Results from this study have been presented, in part, at the 14th annual RECOMB/ISCB Conference on Regulatory and Systems Genomics with DREAM Challenges (RSGDREAM 2022), November 8–9, 2022, Las Vegas, Nevada, USA.
Funding
TDL was funded by the Finnish Cancer Institute and the Finnish Cultural foundation as a FICAN Cancer Researcher. ASH received funding from the University of Turku Graduate School (MATTI), the Academy of Finland (grants 310507, 313267, and 326238), the Cancer Society of Finland, and the Sigrid Jusélius Foundation. MIM received funding from the Finnish Medical Foundation. TM received funding from the Academy of Finland. FF was supported by the Austrian Science Fund (FWF) [T 974-B30] and the Oesterreichische Nationalbank (OeNB) [18496]. OL-S was supported by the Department of Biomedical Engineering, Eindhoven University of Technology. WW, JB, and JT were supported by an ERC Starting Grant (DrugComb, No. 716063), the Academy of Finland (No. 317680), and the Sigrid Jusélius Foundation. WW was funded by the FIMM-EMBL International PhD programme, Doctoral Programme of Biomedicine at the University of Helsinki, Cancer Foundation Finland, K. Albin Johanssons stiftelse, Ida Montinin Säätiö, Orion Research Foundation sr, and Biomedicum Helsinki Foundation. EV was supported by the Academy of Finland (No. 328437), the iCAN Digital Precision Cancer Medicine Flagship (No. 320185 Academy of Finland), and the CAN-PRO Translational Cancer Medicine Research Program Unit. Data analysis resources were provided by the CSC – IT Center for Science, Finland. JK received funding from the Department of Defense (Lung Cancer Research Program Concept Award LC180633) and was the recipient of a SITC-AstraZeneca Lung Cancer Clinical Fellowship (SPS256666). LY and YL received PACT funding through FNIH. MT received funding from the NIH. SSG was the recipient of the Sara Elizabeth O’Brien Trust Fellowship. ADS received funding from the NCI (K99CA248953) and the Human Immunome Project (MP19-02–190). DB received a grant from the Sidra Medicine Internal Funds (SDR400123). MC received the following grant from AIRC: IG 2018 ID 21846. The study was supported by Bristol Myers Squibb.
Author information
Author notes
- Óscar Lapuente-Santana, Anni S. Halkola, Wenyu Wang, Raghvendra Mall, Xu Xiao, Jacob Kaufman, Jingxin Fu and Jacob Pfeil Lead authors from participating teams in the Anti–PD-1 Response Prediction DREAM Challenge with equal contribution.
- Yang Liu, Wenxian Yang, Davide Bedognetti, Jing Tang, Federica Eduati and Teemu D. Laajala Senior authors from participating teams in the Anti–PD-1 Response Prediction DREAM Challenge with equal contribution.
- Justin Guinney, Joseph D. Szustakowski, Benjamin G. Vincent and David P. Carbone Co-senior authors from the Anti–PD-1 Response Prediction DREAM Challenge steering committee.
Authors and Affiliations
- Bristol Myers Squibb, Princeton, NJ, USA
Mike Mason, Han Chang, Scott D. Chasalow, Hung Ying Lin, William J. Geese & Joseph D. Szustakowski - Department of Biomedical Engineering, Eindhoven University of Technology, Eindhoven, The Netherlands
Óscar Lapuente-Santana & Federica Eduati - Department of Mathematics and Statistics, University of Turku, Turku, Finland
Anni S. Halkola & Teemu D. Laajala - Faculty of Medicine, Research Program in Systems Oncology, University of Helsinki, Helsinki, Finland
Wenyu Wang, Jie Bao & Jing Tang - Qatar Computing Research Institute, Hamad Bin Khalifa University, P.O. Box 34110, Doha, Qatar
Raghvendra Mall - Department of Immunology, St. Jude Children’s Research Hospital, P.O. Box 38105, Memphis, TN, USA
Raghvendra Mall - Biotechnology Research Center, Technology Innovation Institute, P.O. Box 9639, Abu Dhabi, United Arab Emirates
Raghvendra Mall - School of Informatics, Xiamen University, Xiamen, China
Xu Xiao - National Institute for Data Science in Health and Medicine, Xiamen University, Xiamen, China
Xu Xiao - Department of Medicine, Duke University, Durham, NC, USA
Jacob Kaufman - The Ohio State University Comprehensive Cancer Center, Columbus, OH, USA
Jacob Kaufman & David P. Carbone - Dana-Farber Cancer Institute, Boston, MA, USA
Jingxin Fu, Lin Yang, Ming Tang, Shengqing Stan Gu, Wubing Zhang, Yi Zhang, Zexian Zeng, Avinash Das Sahu & Yang Liu - AbbVie, South San Francisco, CA, USA
Jacob Pfeil - Sage Bionetworks, Seattle, WA, USA
Jineta Banerjee, Verena Chung, Rongrong Chai & Thomas Yu - Institute of Molecular Biology, University of Innsbruck, Innsbruck, Austria
Francesca Finotello - Digital Science Center (DiSC), University of Innsbruck, Innsbruck, Austria
Francesca Finotello - Department of Pathology, University of Helsinki and Helsinki University Hospital, Helsinki, Finland
Tuomas Mirtti, Mikko I. Mäyränpää & Teemu D. Laajala - Research Program in Systems Oncology, University of Helsinki, Helsinki, Finland
Tuomas Mirtti & Teemu D. Laajala - iCAN-Digital Precision Cancer Medicine Flagship, Helsinki, Finland
Tuomas Mirtti & Teemu D. Laajala - Department of Biomedical Engineering, School of Medicine, Emory University, Atlanta, GA, USA
Tuomas Mirtti - Institute for Molecular Medicine Finland (FIMM), HiLIFE, University of Helsinki, Helsinki, Finland
Emmy W. Verschuren - Human Immunology Department, Sidra Medicine, P.O. Box 26999, Doha, Qatar
Eiman I. Ahmed, Wouter R. L. Hendrickx, Shimaa Sherif & Davide Bedognetti - Department of Electrical Engineering and Information Technology (DIETI), University of Naples “Federico II”, 80125, Naples, Italy
Michele Ceccarelli - BIOGEM Institute of Molecular Biology and Genetics, Via Camporeale, Ariano Irpino, Italy
Michele Ceccarelli & Gianni Monaco - Department of Cancer Biology, Wake Forest School of Medicine, Winston-Salem, NC, USA
Lance D. Miller - Atrium Health Wake Forest Baptist Comprehensive Cancer Center, Winston-Salem, NC, USA
Lance D. Miller - College of Health and Life Sciences, Hamad Bin Khalifa University, P.O. Box 26999, Doha, Qatar
Wouter R. L. Hendrickx, Shimaa Sherif & Davide Bedognetti - Aginome Scientific, Xiamen, China
Wenxian Yang - Department of Internal Medicine and Medical Specialties, University of Genoa, Genoa, Italy
Davide Bedognetti - Department of Biochemistry and Developmental Biology, Faculty of Medicine, University of Helsinki, Helsinki, Finland
Jing Tang - Institute for Complex Molecular Systems (ICMS), Eindhoven University of Technology, Eindhoven, The Netherlands
Federica Eduati - FICAN West Cancer Centre, University of Turku and Turku University Hospital, Turku, Finland
Teemu D. Laajala - Department of Pharmacology, Anschutz Medical Campus, University of Colorado, Denver, CO, USA
Teemu D. Laajala - Tempus Labs, Chicago, IL, USA
Justin Guinney - Department of Medicine, Division of Hematology, Department of Microbiology and Immunology, Curriculum in Bioinformatics and Computational Biology, Computational Medicine Program, University of North Carolina at Chapel Hill, Chapel Hill, NC, USA
Benjamin G. Vincent
Authors
- Mike Mason
- Óscar Lapuente-Santana
- Anni S. Halkola
- Wenyu Wang
- Raghvendra Mall
- Xu Xiao
- Jacob Kaufman
- Jingxin Fu
- Jacob Pfeil
- Jineta Banerjee
- Verena Chung
- Han Chang
- Scott D. Chasalow
- Hung Ying Lin
- Rongrong Chai
- Thomas Yu
- Francesca Finotello
- Tuomas Mirtti
- Mikko I. Mäyränpää
- Jie Bao
- Emmy W. Verschuren
- Eiman I. Ahmed
- Michele Ceccarelli
- Lance D. Miller
- Gianni Monaco
- Wouter R. L. Hendrickx
- Shimaa Sherif
- Lin Yang
- Ming Tang
- Shengqing Stan Gu
- Wubing Zhang
- Yi Zhang
- Zexian Zeng
- Avinash Das Sahu
- Yang Liu
- Wenxian Yang
- Davide Bedognetti
- Jing Tang
- Federica Eduati
- Teemu D. Laajala
- William J. Geese
- Justin Guinney
- Joseph D. Szustakowski
- Benjamin G. Vincent
- David P. Carbone
Contributions
MM, WJG, JG, JDS, BGV, DPC: conceptualization, methodology, validation, formal analysis, investigation, writing – review and editing, visualization, supervision. JB, VC, HC, SDC, HYL, RC, TU: methodology, formal analysis, investigation, resources, writing – review and editing. OL-S, ASH, WW, RM, XX, JK, JF, JP, FF, TM, MIM, JB, EWV, EIA, MC, LDM, GM, WRLH, SS, LY, MT, SSG, WZ, YZ, ZZ, ADS, YL, WY, DB, JT, FE, TDL: methodology, formal analysis, investigation, writing – review and editing. All authors read and approved the final manuscript.
Corresponding author
Correspondence toDavid P. Carbone.
Ethics declarations
Ethics approval and consent to participate
Not applicable.
Consent for publication
Not applicable.
Competing interests
MM, HC, and HYL are employees of Bristol Myers Squibb. MIM has received lecture and/or advisory board fees from Boehringer Ingelheim, Bristol Myers Squibb, MSD, Takeda, Bayer, Amgen, Roche, and Aiforia Technologies Oy. WY is a shareholder of Aginome Scientific. JG is an employee of Tempus Labs. SSG is the recipient of a fellowship from the Sara Elizabeth O’Brien Trust. JS, SC, and WJG are employees and shareholders of Bristol Myers Squibb. BGV received consulting fees from GeneCentric Therapeutics. DPC has received advisory board fees, consulting fees, presentation fees, or consulting fees from Regeneron, Novartis, AbbVie, AstraZeneca, Bristol Myers Squibb, Roche, Arcus Biosciences, Mirati, Iovance Biotherapeutics, Pfizer, Onc Live, InThought, Glaxo-Smith Kline, Intellisphere, Sanofi, Merck KGgA, Merck/EMD Serono, Johnson & Johnson, Jazz, Janssen, Curio Science, PDD development, G1 Therapeutics, OncoHost, Eisai, Flame Biosciences, Novocure, Merck, Daiichi Sankyo, and Boehringer Ingelheim. Other authors declare that they do not have competing interests.
Additional information
Publisher's Note
Springer Nature remains neutral with regard to jurisdictional claims in published maps and institutional affiliations.
Supplementary Information
Additional file 1: Supplementary Methods 1
. Methods used for the development of best-performing models. Supplementary Methods 2. Rationale for metrics used to evaluate model performance. Supplementary Methods 3. Model submission by participants and model evaluation. Supplementary Methods 4. Pathway analysis of gene sets. Table S1. Candidate predictors available to participating teams. Table S2. Comparator models: Published and baseline models used for benchmarking. Table S3. Components of the published gene signatures detailed in Table S2. Table S4. Characteristics at baseline of all the patients who underwent randomization in CheckMate 026. Table S5. Characteristics at baseline of all the patients who underwent randomization in CheckMate 227. Table S6. Model performance across sub-challenges. Fig. S1. Computing of the primary metric for each sub-challenge. Fig. S2. Model performance. Fig. S3. Gene signatures.
Rights and permissions
Open Access This article is licensed under a Creative Commons Attribution 4.0 International License, which permits use, sharing, adaptation, distribution and reproduction in any medium or format, as long as you give appropriate credit to the original author(s) and the source, provide a link to the Creative Commons licence, and indicate if changes were made. The images or other third party material in this article are included in the article's Creative Commons licence, unless indicated otherwise in a credit line to the material. If material is not included in the article's Creative Commons licence and your intended use is not permitted by statutory regulation or exceeds the permitted use, you will need to obtain permission directly from the copyright holder. To view a copy of this licence, visit http://creativecommons.org/licenses/by/4.0/. The Creative Commons Public Domain Dedication waiver (http://creativecommons.org/publicdomain/zero/1.0/) applies to the data made available in this article, unless otherwise stated in a credit line to the data.
About this article
Cite this article
Mason, M., Lapuente-Santana, Ó., Halkola, A.S. et al. A community challenge to predict clinical outcomes after immune checkpoint blockade in non-small cell lung cancer.J Transl Med 22, 190 (2024). https://doi.org/10.1186/s12967-023-04705-3
- Received: 24 October 2023
- Accepted: 05 November 2023
- Published: 21 February 2024
- DOI: https://doi.org/10.1186/s12967-023-04705-3