How the United Kingdom voted on Thursday... and why - Lord Ashcroft Polls (original) (raw)
The UK has voted to leave the European Union. On referendum day I surveyed 12,369 people after they had voted to help explain the result – who voted for which outcome, and what lay behind their decision.
The demographics
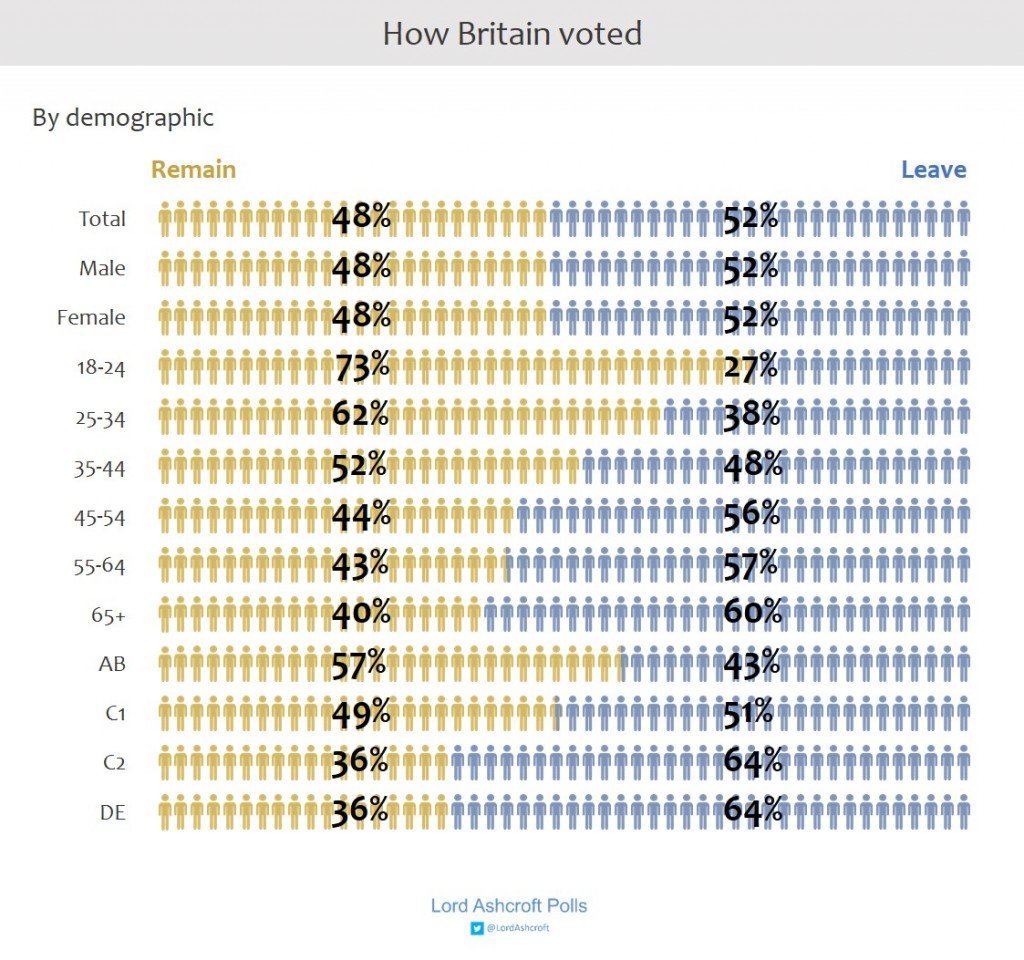
- The older the voters, the more likely they were to have voted to leave the EU. Nearly three quarters (73%) of 18 to 24 year-olds voted to remain, falling to under two thirds (62%) among 25-34s. A majority of those aged over 45 voted to leave, rising to 60% of those aged 65 or over. Most people with children aged ten or under voted to remain; most of those with children aged 11 or older voted to leave.
- A majority of those working full-time or part-time voted to remain in the EU; most of those not working voted to leave. More than half of those retired on a private pension voted to leave, as did two thirds of those retired on a state pension.
- Among private renters and people with mortgages, a small majority (55% and 54%) voted to remain; those who owned their homes outright voted to leave by 55% to 45%. Around two thirds of council and housing association tenants voted to leave.
- A majority (57%) of those with a university degree voted to remain, as did 64% of those with a higher degree and more than four in five (81%) of those still in full time education. Among those whose formal education ended at secondary school or earlier, a large majority voted to leave.
- White voters voted to leave the EU by 53% to 47%. Two thirds (67%) of those describing themselves as Asian voted to remain, as did three quarters (73%) of black voters. Nearly six in ten (58%) of those describing themselves as Christian voted to leave; seven in ten Muslims voted to remain.
- The AB social group (broadly speaking, professionals and managers) were the only social group among whom a majority voted to remain (57%). C1s divided fairly evenly; nearly two thirds of C2DEs (64%) voted to leave the EU.
How the parties divided
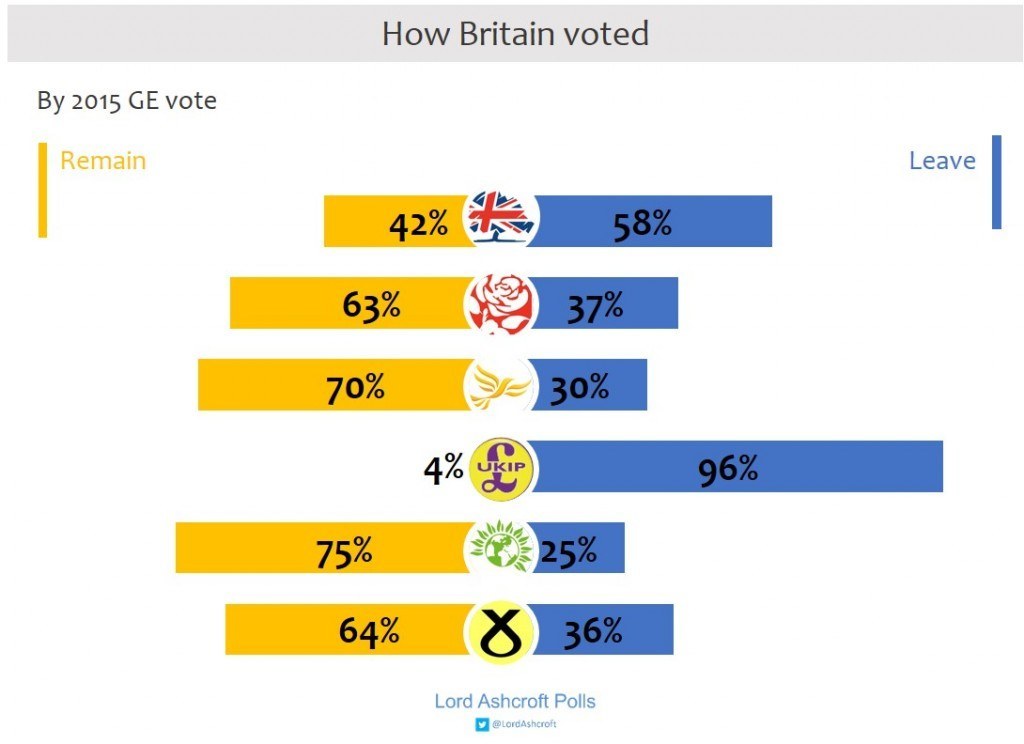
- A majority of those who backed the Conservative in 2015 voted to leave the EU (58%), as did more than 19 out of 20 UKIP supporters. Nearly two thirds of Labour and SNP voters (63% and 64%), seven in ten Liberal Democrats and three quarters of Greens, voted to remain.
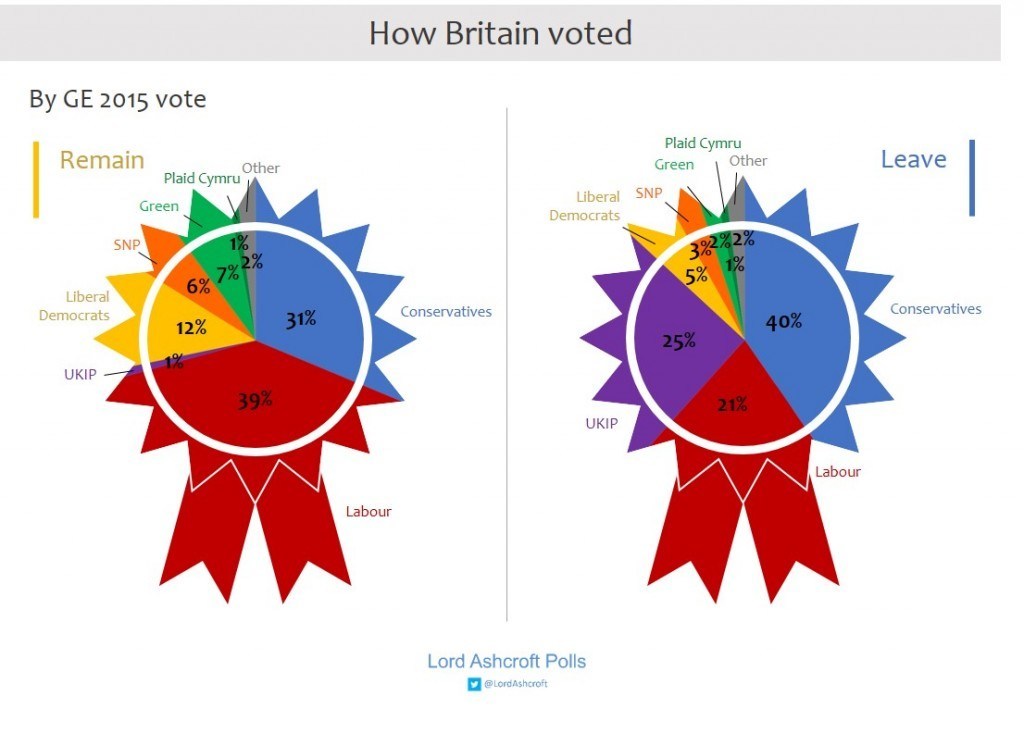
- Conservative voters constituted just over three out of every ten remainers, and four in ten leavers. Labour voters made up four in every ten remainers, and two in ten leavers.
When they decided
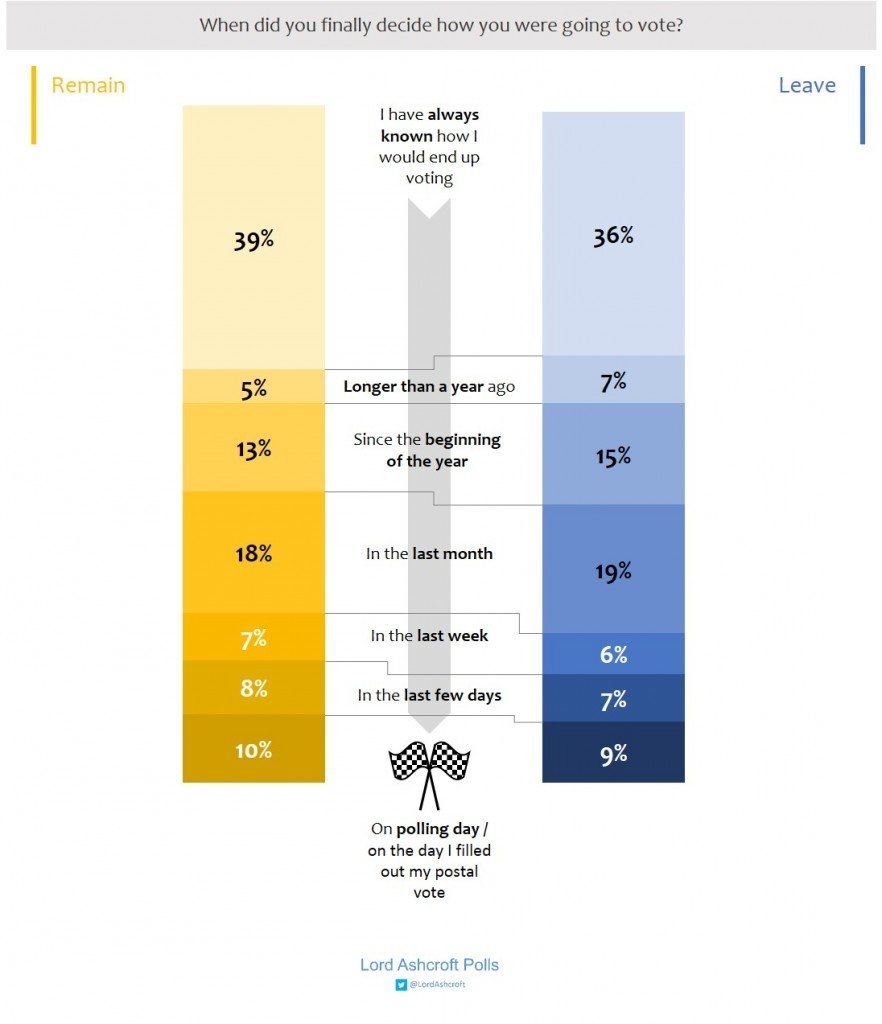
- Just under half (43%) of voters said they always knew how they would end up voting or decided more than a year ago. Nearly a quarter (24%) decided in the week before referendum day; and one in ten decided yesterday, or on the day they filled in their postal vote.
- Leave and remain voters were almost equally likely to have decided on the day. Labour and Lib Dem supporters who voted leave were more likely to have decided late than Conservative leavers.
Reasons to leave, reasons to remain
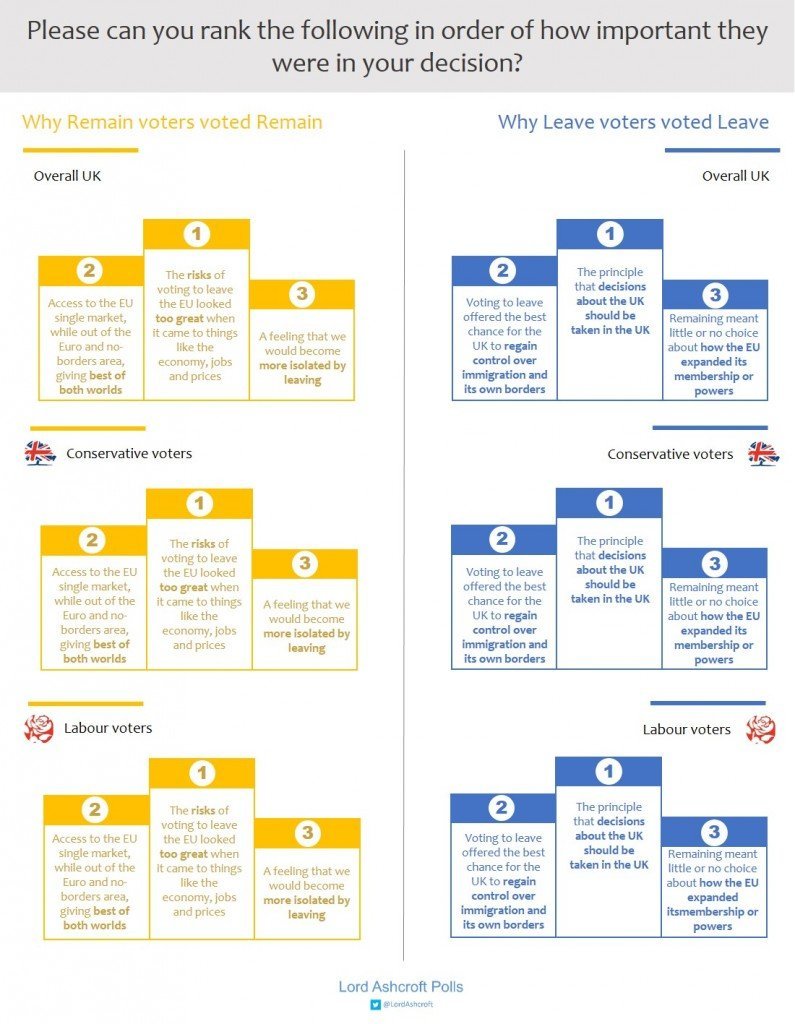
- Nearly half (49%) of leave voters said the biggest single reason for wanting to leave the EU was “the principle that decisions about the UK should be taken in the UK”. One third (33%) said the main reason was that leaving “offered the best chance for the UK to regain control over immigration and its own borders.” Just over one in eight (13%) said remaining would mean having no choice “about how the EU expanded its membership or its powers in the years ahead.” Only just over one in twenty (6%) said their main reason was that “when it comes to trade and the economy, the UK would benefit more from being outside the EU than from being part of it.”
- For remain voters, the single most important reason for their decision was that “the risks of voting to leave the EU looked too great when it came to things like the economy, jobs and prices” (43%). Just over three in ten (31%) reasoned that remaining would mean the UK having “the best of both worlds”, having access to the EU single market without Schengen or the euro. Just under one in five (17%) said their main reason was that the UK would “become more isolated from its friends and neighbours”, and fewer than one in ten (9%) said it was “a strong attachment to the EU and its shared history, culture and traditions.”
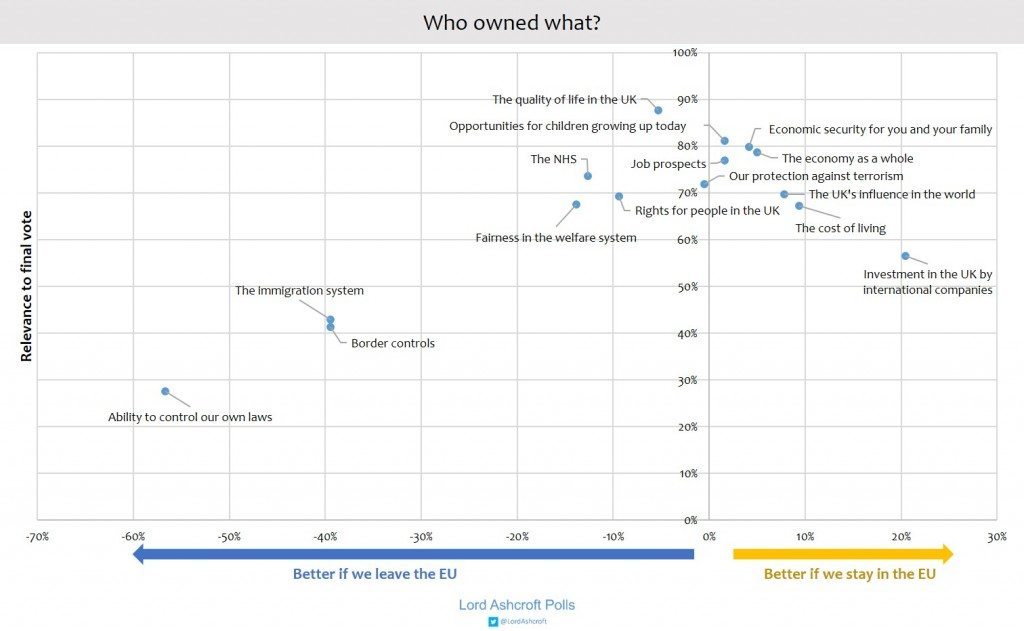
- Overall, small majorities of voters thought EU membership would be better for the economy, international investment, and the UK’s influence in the world. Leaving the EU was thought more likely to bring about a better immigration system, improved border controls, a fairer welfare system, better quality of life, and the ability to control our own laws.
Next Conservative Prime Minister
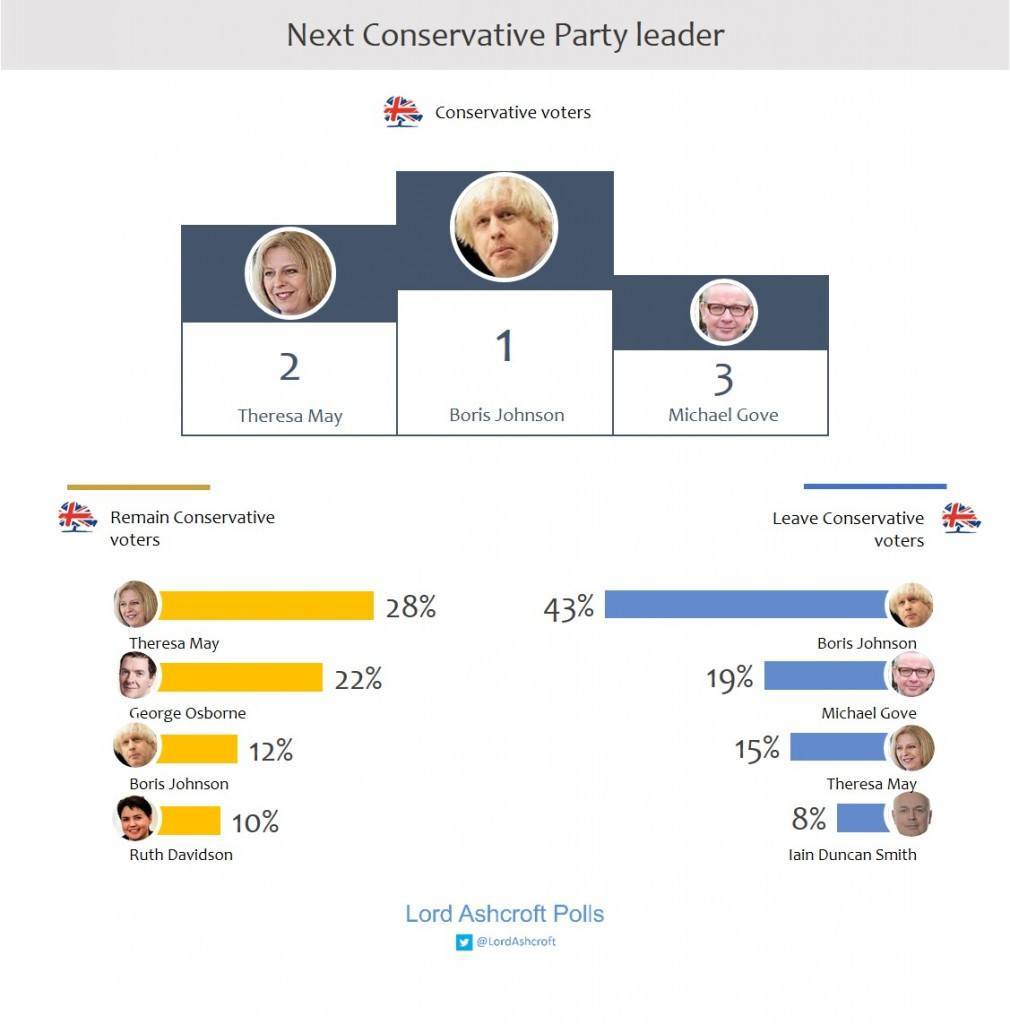
- For 2015 Conservatives who voted to leave the EU, Boris Johnson was the preferred successor to David Cameron for 43%. Michael Gove was second with 19%, and Theresa May third with 15%.
- For Conservative supporters who voted to remain, Theresa May was the most popular choice of successor for 28%, followed by George Osborne (22%). Boris Johnson was third, with 12%, just ahead of Ruth Davidson on 10%.
- Among voters as a whole, the most popular choice for the next Conservative Prime Minister was Boris Johnson (28%), followed by Theresa May (18%) and Ruth Davidson (10%). George Osborne (8%) came fifth after Michael Gove (9%).
National identity
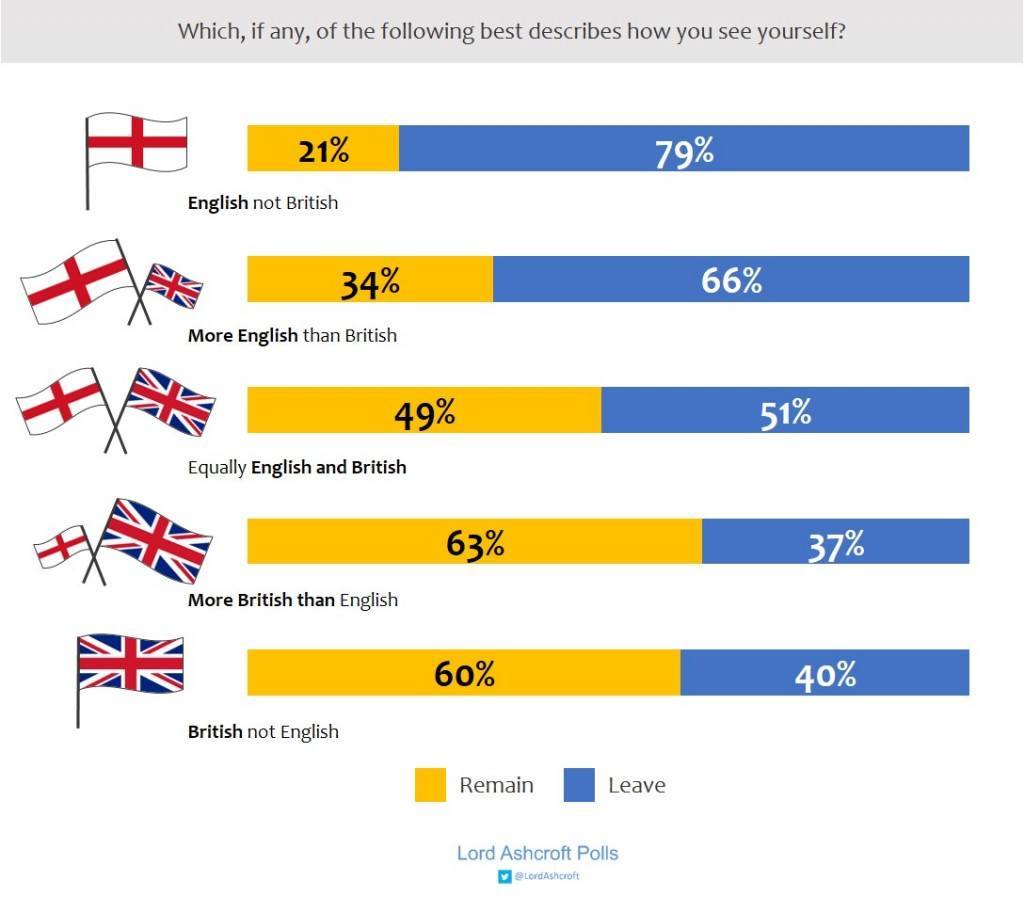
- In England, leave voters (39%) were more than twice as likely as remain voters (18%) to describe themselves either as “English not British” or “more English than British”. Remain voters were twice as likely as leavers to see themselves as more British than English.
- Two thirds of those who considered themselves more English than British voted to leave; two thirds of those who considered themselves more British than English voted to remain.
- In Scotland, remainers (55%) were more likely than leavers (46%) to see themselves as “Scottish not British” or “more Scottish than British”.
Social attitudes
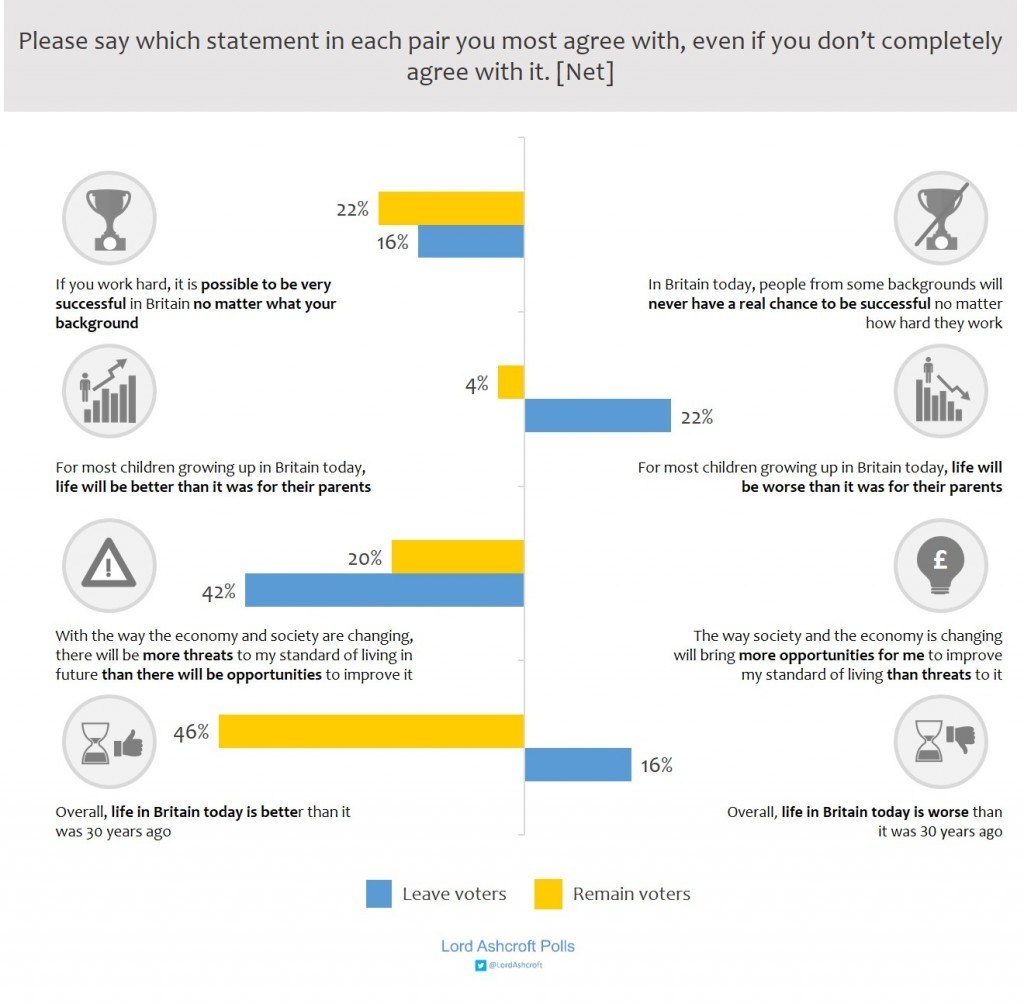
- A small majority of those who voted to remain think that for most children growing up today, life will be better than it was for their parents; leavers think the opposite by 61% to 39%. Leavers see more threats than opportunities to their standard of living from the way the economy and society are changing, by 71% to 29% – more than twice the margin among remainers.
- Nearly three quarters (73%) of remainers think life in Britain is better today than it was 30 years ago; a majority (58%) of those who voted to leave say it is worse.
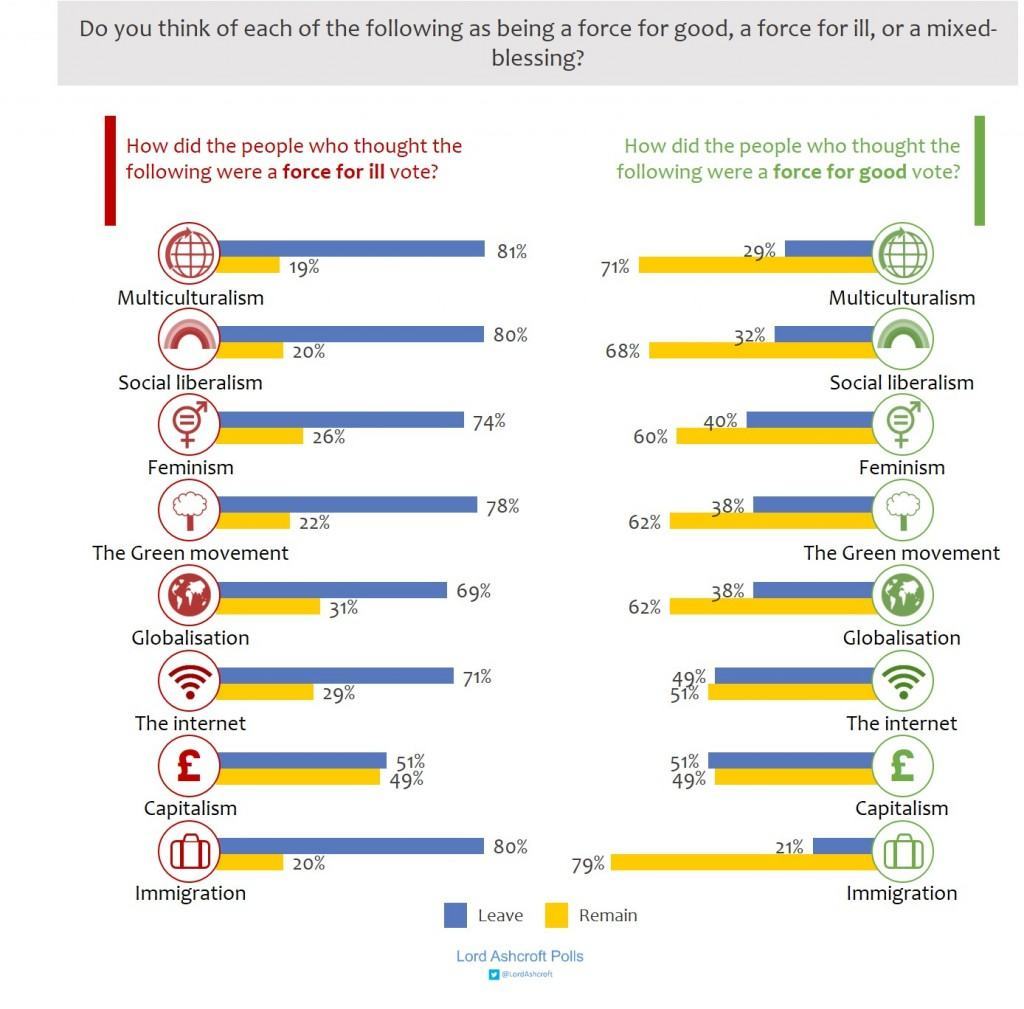
- By large majorities, voters who saw multiculturalism, feminism, the Green movement, globalisation and immigration as forces for good voted to remain in the EU; those who saw them as a force for ill voted by even larger majorities to leave.
Political engagement
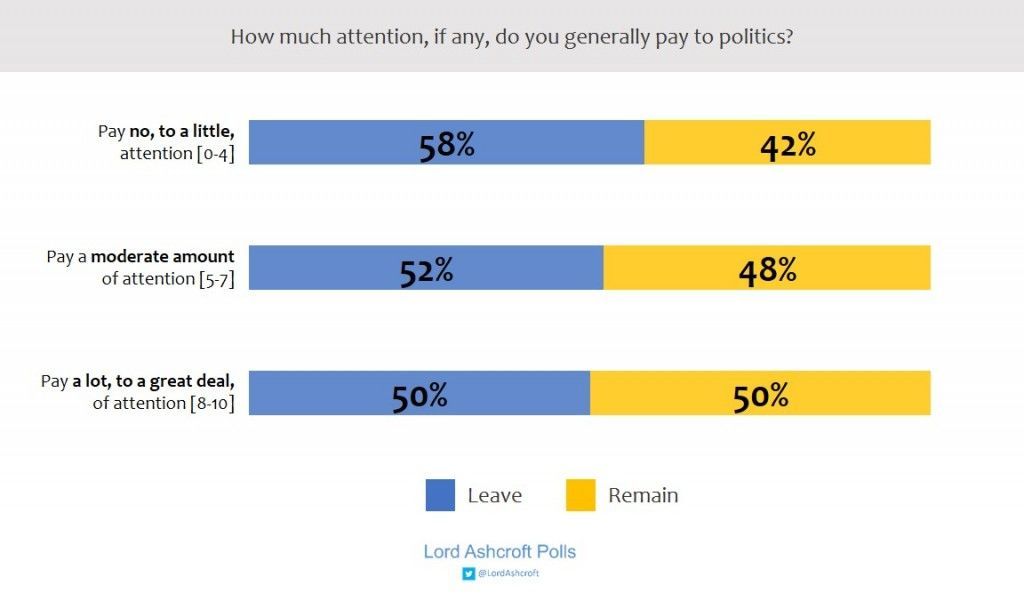
- Those who said they paid a great deal of attention to politics were evenly divided between leave and remain. Those who said they paid little or no attention to politics voted to leave the EU by 58% to 42%.
What did they expect?
- Seven voters in ten expected a victory for remain, including a majority (54%) of those who voted to leave. Leave voters who voted UKIP at the 2015 election were the only group who (by just 52% to 48%) expected a leave victory.
The impact
- More than three quarters (77%) of those who voted to remain thought “the decision we make in the referendum could have disastrous consequences for us as a country if we get it wrong”. More than two thirds (69%) of leavers, by contrast, thought the decision “might make us a bit better or worse off as a country, but there probably isn’t much in it either way”.
