Plot types — Matplotlib 3.10.3 documentation (original) (raw)
Overview of many common plotting commands provided by Matplotlib.
See the gallery for more examples and the tutorials page for longer examples.
Pairwise data#
Plots of pairwise \((x, y)\), tabular \((var\_0, \cdots, var\_n)\), and functional \(f(x)=y\) data.
Statistical distributions#
Plots of the distribution of at least one variable in a dataset. Some of these methods also compute the distributions.
Gridded data#
Plots of arrays and images \(Z_{i, j}\) and fields \(U_{i, j}, V_{i, j}\)on regular grids and corresponding coordinate grids \(X_{i,j}, Y_{i,j}\).
Irregularly gridded data#
Plots of data \(Z_{x, y}\) on unstructured grids , unstructured coordinate grids \((x, y)\), and 2D functions \(f(x, y) = z\).
3D and volumetric data#
Plots of three-dimensional \((x,y,z)\), surface \(f(x,y)=z\), and volumetric \(V_{x, y, z}\) data using the mpl_toolkits.mplot3d library.

bar3d(x, y, z, dx, dy, dz)

fill_between(x1, y1, z1, x2, y2, z2)
fill_between(x1, y1, z1, x2, y2, z2)
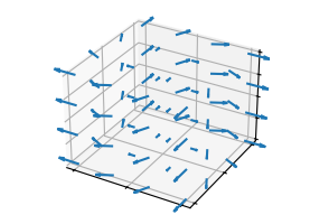
quiver(X, Y, Z, U, V, W)