numpy.exp — NumPy v2.3 Manual (original) (raw)
numpy.exp(x, /, out=None, *, where=True, casting='same_kind', order='K', dtype=None, _subok=True_[, _signature_]) = <ufunc 'exp'>#
Calculate the exponential of all elements in the input array.
Parameters:
xarray_like
Input values.
outndarray, None, or tuple of ndarray and None, optional
A location into which the result is stored. If provided, it must have a shape that the inputs broadcast to. If not provided or None, a freshly-allocated array is returned. A tuple (possible only as a keyword argument) must have length equal to the number of outputs.
wherearray_like, optional
This condition is broadcast over the input. At locations where the condition is True, the out array will be set to the ufunc result. Elsewhere, the out array will retain its original value. Note that if an uninitialized out array is created via the defaultout=None, locations within it where the condition is False will remain uninitialized.
**kwargs
For other keyword-only arguments, see theufunc docs.
Returns:
outndarray or scalar
Output array, element-wise exponential of x. This is a scalar if x is a scalar.
See also
Calculate exp(x) - 1 for all elements in the array.
Calculate 2**x for all elements in the array.
Notes
The irrational number e is also known as Euler’s number. It is approximately 2.718281, and is the base of the natural logarithm,ln (this means that, if \(x = \ln y = \log_e y\), then \(e^x = y\). For real input, exp(x) is always positive.
For complex arguments, x = a + ib, we can write\(e^x = e^a e^{ib}\). The first term, \(e^a\), is already known (it is the real argument, described above). The second term,\(e^{ib}\), is \(\cos b + i \sin b\), a function with magnitude 1 and a periodic phase.
References
Examples
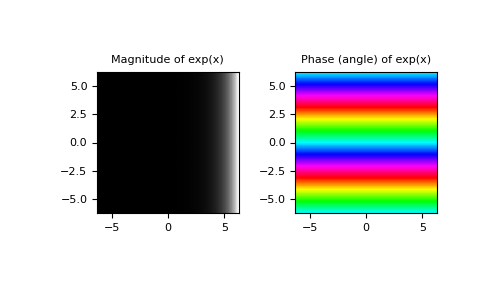
Plot the magnitude and phase of exp(x) in the complex plane:
import matplotlib.pyplot as plt import numpy as np
x = np.linspace(-2np.pi, 2np.pi, 100) xx = x + 1j * x[:, np.newaxis] # a + ib over complex plane out = np.exp(xx)
plt.subplot(121) plt.imshow(np.abs(out), ... extent=[-2np.pi, 2np.pi, -2np.pi, 2np.pi], cmap='gray') plt.title('Magnitude of exp(x)')
plt.subplot(122) plt.imshow(np.angle(out), ... extent=[-2np.pi, 2np.pi, -2np.pi, 2np.pi], cmap='hsv') plt.title('Phase (angle) of exp(x)') plt.show()