numpy.interp — NumPy v2.3 Manual (original) (raw)
numpy.interp(x, xp, fp, left=None, right=None, period=None)[source]#
One-dimensional linear interpolation for monotonically increasing sample points.
Returns the one-dimensional piecewise linear interpolant to a function with given discrete data points (xp, fp), evaluated at x.
Parameters:
xarray_like
The x-coordinates at which to evaluate the interpolated values.
xp1-D sequence of floats
The x-coordinates of the data points, must be increasing if argument_period_ is not specified. Otherwise, xp is internally sorted after normalizing the periodic boundaries with xp = xp % period.
fp1-D sequence of float or complex
The y-coordinates of the data points, same length as xp.
leftoptional float or complex corresponding to fp
Value to return for x < xp[0], default is fp[0].
rightoptional float or complex corresponding to fp
Value to return for x > xp[-1], default is fp[-1].
periodNone or float, optional
A period for the x-coordinates. This parameter allows the proper interpolation of angular x-coordinates. Parameters left and _right_are ignored if period is specified.
Returns:
yfloat or complex (corresponding to fp) or ndarray
The interpolated values, same shape as x.
Raises:
ValueError
If xp and fp have different length If xp or fp are not 1-D sequences If period == 0
Warning
The x-coordinate sequence is expected to be increasing, but this is not explicitly enforced. However, if the sequence xp is non-increasing, interpolation results are meaningless.
Note that, since NaN is unsortable, xp also cannot contain NaNs.
A simple check for xp being strictly increasing is:
Examples
import numpy as np xp = [1, 2, 3] fp = [3, 2, 0] np.interp(2.5, xp, fp) 1.0 np.interp([0, 1, 1.5, 2.72, 3.14], xp, fp) array([3. , 3. , 2.5 , 0.56, 0. ]) UNDEF = -99.0 np.interp(3.14, xp, fp, right=UNDEF) -99.0
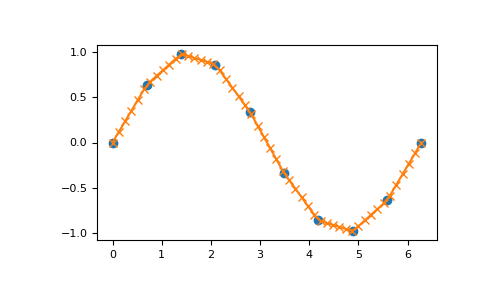
Plot an interpolant to the sine function:
x = np.linspace(0, 2np.pi, 10) y = np.sin(x) xvals = np.linspace(0, 2np.pi, 50) yinterp = np.interp(xvals, x, y) import matplotlib.pyplot as plt plt.plot(x, y, 'o') [<matplotlib.lines.Line2D object at 0x...>] plt.plot(xvals, yinterp, '-x') [<matplotlib.lines.Line2D object at 0x...>] plt.show()
Interpolation with periodic x-coordinates:
x = [-180, -170, -185, 185, -10, -5, 0, 365] xp = [190, -190, 350, -350] fp = [5, 10, 3, 4] np.interp(x, xp, fp, period=360) array([7.5 , 5. , 8.75, 6.25, 3. , 3.25, 3.5 , 3.75])
Complex interpolation:
x = [1.5, 4.0] xp = [2,3,5] fp = [1.0j, 0, 2+3j] np.interp(x, xp, fp) array([0.+1.j , 1.+1.5j])