Calculate Nice Axis Scales in Excel VBA - Peltier Tech (original) (raw)
Friday, March 9, 2012
Peltier Technical Services, Inc., Copyright © 2025, All rights reserved.
In a recent post I described how How Excel Calculates Automatic Chart Axis Limits. The problem with these automatic limits is that they often leave a little too much white space around the outside of the plotted data, especially between the lowest data point and zero. But it’s tedious to guess at your own axis scale, and it would be nice to calculate your own limits in your latest and greatest VBA charting code.
This article presents code that takes high and low series values and computes “nice” axis scaling parameters. The code can be called by other VBA procedures, or it can be used in the worksheet as a user defined function (UDF).
The VBA Code
I started with code from a November 2001 newsgroup post by Stephen Bullen. I modified it slightly, and corrected a minor algebraic error.
The following is an entire module, including a user defined variable type (scaleAxisScale) to contain the axis scaling parameters, the main function procedure that does all of the work (fnAxisScale), and a small function procedure that is the UDF interface with the worksheet (udfAxisScale).
Option Explicit

Public Type scaleAxisScale
  ' Calculated Axis Scale Parameters
  dMin As Double
  dMax As Double
  dMajor As Double
  dMinor As Double
End Type

Function fnAxisScale(ByVal dMin As Double, ByVal dMax As Double) As scaleAxisScale
  ' Calculates tidy settings for the chart axes
  Dim dPower As Double, dScale As Double, dSmall As Double, dTemp As Double

  'Check if the max and min are the same
  If dMax = dMin Then
    dTemp = dMax
    dMax = dMax * 1.01
    dMin = dMin * 0.99
  End If

  'Check if dMax is bigger than dMin - swap them if not
  If dMax < dMin Then
    dTemp = dMax
    dMax = dMin
    dMin = dTemp
  End If

  'Make dMax a little bigger and dMin a little smaller (by 1% of their difference)
  If dMax > 0 Then
    dMax = dMax + (dMax - dMin) * 0.01
  ElseIf dMax < 0 Then
    dMax = WorksheetFunction.Min(dMax + (dMax - dMin) * 0.01, 0)
  Else
    dMax = 0
  End If
  If dMin > 0 Then
    dMin = WorksheetFunction.Max(dMin - (dMax - dMin) * 0.01, 0)
  ElseIf dMin < 0 Then
    dMin = dMin - (dMax - dMin) * 0.01
  Else
    dMin = 0
  End If

  'What if they are both 0?
  If (dMax = 0) And (dMin = 0) Then dMax = 1

  'This bit rounds the maximum and minimum values to reasonable values
  'to chart.  If not done, the axis numbers will look very silly
  'Find the range of values covered
  dPower = Log(dMax - dMin) / Log(10)
  dScale = 10 ^ (dPower - Int(dPower))

  'Find the scaling factor
  Select Case dScale
    Case 0 To 2.5
      dScale = 0.2
      dSmall = 0.05
    Case 2.5 To 5
      dScale = 0.5
      dSmall = 0.1
    Case 5 To 7.5
      dScale = 1
      dSmall = 0.2
    Case Else
      dScale = 2
      dSmall = 0.5
  End Select

  'Calculate the scaling factor (major & minor unit)
  dScale = dScale * 10 ^ Int(dPower)
  dSmall = dSmall * 10 ^ Int(dPower)

  'Round the axis values to the nearest scaling factor
  fnAxisScale.dMin = dScale * Int(dMin / dScale)
  fnAxisScale.dMax = dScale * (Int(dMax / dScale) + 1)
  fnAxisScale.dMajor = dScale
  fnAxisScale.dMinor = dSmall

End Function

Public Function udfAxisScale(ByVal dMin As Double, ByVal dMax As Double) As Variant
  ' Worksheet interface to fnAxisScale
  ' Returns a horizontal array to the worksheet
  Dim scaleMyScale As scaleAxisScale
  Dim scaleOutput As Variant

  scaleMyScale = fnAxisScale(dMin, dMax)

  ReDim scaleOutput(1 To 4)
  scaleOutput(1) = scaleMyScale.dMin
  scaleOutput(2) = scaleMyScale.dMax
  scaleOutput(3) = scaleMyScale.dMajor
  scaleOutput(4) = scaleMyScale.dMinor

  udfAxisScale = scaleOutput
End Function
Using as a User Defined Function (UDF)
The procedure returns a four-element horizontal array. In its simplest implementation, select a horizontal range of four cells (or three cells if you don’t care about the minor unit), type the following formula into the formula bar (min and max can be cell references, constants, or formulas), and hold Ctrl+Shift while pressing Enter to create an array formula. Don’t type the curly brackets; Excel does that if the array formula is valid.
{=udfAxisScale(min,max)}To enter the axis scale parameters into a vertical range of cells, select the range of three or four cells, enter the following formula (without the curly braces) into the formula bar, and hold Ctrl+Shift while pressing Enter to create an array formula.
{=TRANSPOSE(udfAxisScale(min,max))}The following screen shot shows this in action. The min and max for an unseen axis are entered into B3 and B4. A three member horizontal array of axis min, axis max, and major unit is entered in B8:D8 using the formula shown in E8. A four member array including minor unit is entered in B12:E12 using the formula shown in F12 (it’s the same formula used in the three member array). A three member vertical array of axis min, axis max, and major unit is entered in C15:C17 using the formula shown in D15. A four member array including minor unit is entered in C20:C23 using the formula shown in D20 (it’s the same formula used in the three member array).
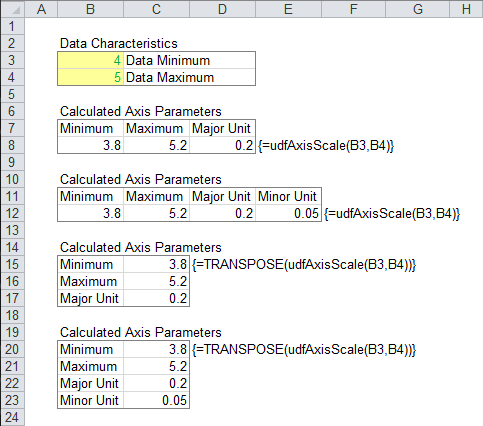
The following further illustrates the UDF. The cells in the upper three outlined rows contain X values (0 and 5 in the first column) and Y values (4 and 5 in the second column), which are plotted in both charts. The cells in the lower three outlined rows contain calculated values for minimum, maximum, and major unit for the X axis (first column) and Y axis (second column).
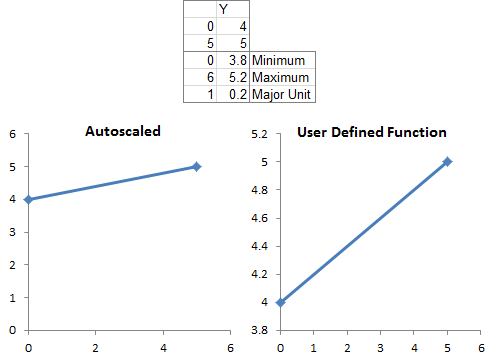
The axis parameters are manually changed from the left chart’s automatic values. . .
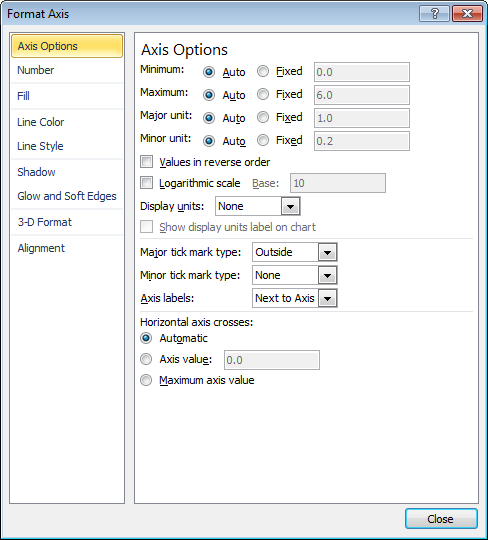
to the right chart’s calculated values, by entering the new values into the Format Axis dialog.

Call from Other VBA Procedures
Procedure
The following procedure takes an XY chart, finds the min and max of all series plotted in the chart, passes these to fnAxisScale above, then applies the calculated scale parameters to the chart. If the chart is not an XY chart, the X axis cannot be rescaled in this way, so the code must be modified.
Sub ScaleChartAxes(cht As Chart)
  Dim AxisScaleX As scaleAxisScale
  Dim AxisScaleY As scaleAxisScale
  Dim dXMin As Double, dXMax As Double, dYMin As Double, dYMax As Double
  Dim vXValues As Variant, vYValues As Variant
  Dim iSeries As Long, iPoint As Long
  Dim srs As Series

  With cht
    ' loop through all series and all points to find X and Y min and max
    For iSeries = 1 To .SeriesCollection.Count
      Set srs = .SeriesCollection(iSeries)
      vXValues = srs.XValues
      vYValues = srs.Values

      If iSeries = 1 Then
        dXMin = vXValues(1)
        dXMax = vXValues(1)
        dYMin = vYValues(1)
        dYMax = vYValues(1)
      End If

      For iPoint = 1 To srs.Points.Count
        If dXMin > vXValues(iPoint) Then dXMin = vXValues(iPoint)
        If dXMax < vXValues(iPoint) Then dXMax = vXValues(iPoint)
        If dYMin > vYValues(iPoint) Then dYMin = vYValues(iPoint)
        If dYMax < vYValues(iPoint) Then dYMax = vYValues(iPoint)
      Next
    Next

    ' compute X and Y axis scales
    AxisScaleX = fnAxisScale(dXMin, dXMax)
    AxisScaleY = fnAxisScale(dYMin, dYMax)

    ' apply X axis scale
    With .Axes(xlCategory)
      If .MinimumScale > AxisScaleX.dMax Then
        .MaximumScale = AxisScaleX.dMax
        .MinimumScale = AxisScaleX.dMin
      Else
        .MinimumScale = AxisScaleX.dMin
        .MaximumScale = AxisScaleX.dMax
      End If
      .MajorUnit = AxisScaleX.dMajor
    End With

    ' apply Y axis scale
    With .Axes(xlValue)
      If .MinimumScale > AxisScaleY.dMax Then
        .MaximumScale = AxisScaleY.dMax
        .MinimumScale = AxisScaleY.dMin
      Else
        .MinimumScale = AxisScaleY.dMin
        .MaximumScale = AxisScaleY.dMax
      End If
      .MajorUnit = AxisScaleY.dMajor
    End With

  End With
End Sub
Entry Points
The ScaleChartAxes procedure above can be called in several ways by the following procedures. Each one is run by the user, and passes one or more charts into ScaleChartAxes for rescaling.
This procedure rescales the active chart.
Sub ScaleActiveChartAxes()
  If Not ActiveChart Is Nothing Then
    ScaleChartAxes ActiveChart
  End If
End Sub
This procedure rescales all charts on the active sheet.
Sub ScaleActiveSheetCharts()
  Dim cht As ChartObject

  Application.ScreenUpdating = False
  For Each cht In ActiveSheet.ChartObjects
    ScaleChartAxes cht.Chart
  Next
  Application.ScreenUpdating = True
End Sub
This procedure rescales all charts that have been selected (using Shift or Ctrl to select multiple charts).
Sub ScaleSelectedCharts()
  Dim obj As Object

  Application.ScreenUpdating = False
  If Not ActiveChart Is Nothing Then
    ScaleChartAxes ActiveChart
  End If
  On Error Resume Next
  For Each obj In Selection
    If TypeName(obj) = "ChartObject" Then
      ScaleChartAxes obj.Chart
    End If
  Next
  On Error GoTo 0
  Application.ScreenUpdating = True
End Sub
More Axis Scale Articles
- Calculate Nice Axis Scales with LET and LAMBDA
- Calculate Nice Axis Scales in Your Excel Worksheet
- Calculate Nice Axis Scales in Excel VBA
- Chart UDF to Control Axis Scale
- How Excel Calculates Automatic Chart Axis Limits
- Reciprocal Chart Axis Scale
- Custom Axis Labels and Gridlines in an Excel Chart
- Custom Axis, Y = 1, 2, 4, 8, 16
- Logarithmic Axis Scales
- Link Excel Chart Axis Scale to Values in Cells
- Consistent Axis Scales Across Multiple Charts
- Gantt Chart with Nice Date Axis
- Select Meaningful Axis Scales
- Bar Chart Value Axis Scale Must Include Zero