Chart UDF to Control Axis Scale - Peltier Tech (original) (raw)
Tuesday, May 22, 2018
Peltier Technical Services, Inc., Copyright © 2025, All rights reserved.
User Defined Function to Control Chart Axes?
Can you really use a chart UDF to control axis scales? That would be pretty cool. UDFs are VBA functions that you can use in your worksheet, but they only return values to cells, right?
Well, yes, that’s what the documentation says, but there’s a fortuitous bug/feature in Excel UDFs that extend their capabilities in unexpected ways.
Link Axis Scale to Worksheet Cells
For as long as I’ve been using Excel, people have wanted to be able to link the chart axis scale parameters to worksheet cells. Seriously, how hard could it be to link the axis scale boxes in the dialog to worksheet cells?
Microsoft tells us, if there’s a feature we really really want, post it in User Voice, and if it gets enough votes, we’ll work on it. And someone already has, back in 2015, Erik Svensen posted Link the min and max values of a chart axis to cell value. And in 2015, Microsoft said “Thanks for the suggestion!” As of this writing the suggestion has received 589 votes. If you haven’t voted, please do.
So there’s no built-in capability to do this (yet). It is possible to use VBA to link a chart’s axis to the worksheet, as I wrote about in Link Excel Chart Axis Scale to Values in Cells. Works well enough, if you’re comfortable with VBA, but it’s not easy to set up and maintain, and I’ve never felt it was too reliable. Former Excel MVP Tushar Mehta has his AutoChart add-in that sets it up for you, but the technique is still a bit wonky.
Excel User Defined Functions
I’ve written a few tutorials that describe specific UDFs, but I have no general tutorials on them. But there are hundreds of UDF articles on the internet.
User defined functions allow you to write functions which are not built into Excel. In Create custom functions in Excel, Microsoft starts a tutorial with
Although Excel includes a multitude of built-in worksheet functions, chances are it doesn’t have a function for every type of calculation you perform. The designers of Excel couldn’t possibly anticipate every user’s calculation needs. Instead, Excel provides you with the ability to create custom functions, which are explained in this article.
Another good introduction is Creating a UDF (User Defined Function) in Excel by my colleague Philip Treacy.
In general, a user defined function can only return the result of its calculations to the cell it is called from. The UDF cannot change cell formatting (other than changes based on the cell’s conditional formatting) nor affect another cell, other than through a formula in that other cell. The UDF cannot insert worksheets, change sheet names, create workbooks, or affect anything else in Excel except for the value in the cell it lives in.
Except that a UDF can create and modify shapes in Excel.
UDFs Can Modify Shapes
In 2006 on the Daily Dose of Excel blog, Rob Van Gelder posted in In Cell Charting that “you can create a Shape from a user-defined function.” Rob used this trick as a way to draw lines and shapes to make small sparkline charts in an Excel worksheet. At first this seemed like a neat parlor trick, but several of us contributed ideas and lines of code, both in the original post and in the follow-up, Scaled In Cell Charting. None of the code samples are reproduced here, as the procedures are all rather lengthy.
Eventually Fabrice Rimlinger turned this concept into Sparklines for Excel®, “a set of free User Defined Functions for Microsoft Excel® to create Sparklines.” Unfortunately, the Sparklines for Excel website and forum have not had any activity since 2016; they are still live, and you can still download add-ins which as far as I know still work.
However, the concept is interesting, and charts are in fact a special kind of Excel shape.
UDFs Can Modify Charts
Back in 2007, also on Daily Dose of Excel, John “Mr Spreadsheet” Walkenbach posted Modifying Shapes (And Charts) With UDFs. John showed three UDFs: the first changed the type of a shape (e.g., rectangle to ellipse), the second changed the chart type of a chart (e.g., column to line), and the third, most interesting, example, applied new axis scale limits:
Function ChangeChartAxisScale(CName, lower, upper)
    With ActiveSheet.Shapes(CName).Chart.Axes(xlValue)
        .MinimumScale = lower
        .MaximumScale = upper
    End With
End Function
Write a worksheet function in a cell to call this chart UDF, pass in the chart name and the new lower and upper limits…
=ChangeChartAxisScale("Chart 1",-5,5)…and the chart updates.
UDFs Can Modify Chart Axes
While traveling in Australia, I read a post by Mark Proctor on the Excel Off The Grid blog, Set chart axis min and max based on a cell value. Mark has revisited the chart UDF concepts above with a function that will update the minimum or maximum of a chart axis:
=setChartAxis(chartName, MinOrMax, ValueOrCategory, PrimaryOrSecondary, Value)Enter the chart name, indicate whether to update the min or max, whether it’s a value (Y) or category (X) axis, a primary or secondary axis, and finally provide the new value for the min or max. The function would look something like this:
=setChartAxis("Chart 1", "Max", "Value", "Primary", 15)which will set the maximum of the primary value axis of the chart named “Chart 1” on the active sheet to 15.
Now that’s pretty cool. While waiting in the Virgin Australia departure lounge (thanks, Liam!), I whipped up my own version of this function, and shared it with colleagues Mynda Treacy and Gašper Kamenšek, who agreed that it’s pretty cool.
Immediately I thought of ways to build on Mark’s UDF. For example, why not modify all axis scale arguments (minimum, maximum, major unit, and minor unit) in one function? You can build in some error-proofing: what if you specify a secondary axis but the chart only has primary axes, or what if the entered minimum is greater than the entered maximum? Also, as I learned in one of my Unlock Excel conference sessions, modifying “Chart 1” on the active sheet will result in strange behavior if you have another chart named “Chart 1” on another sheet, and you activate this other sheet.
Mark has another interesting chart UDF tutorial, Create dynamic chart titles with custom formatting, which presents a UDF that builds a dynamic chart title using the contents and formats of a set of specified cells.
Advanced Chart UDFs
I’ve come up with the following user defined function, which will allow you to set all axis scale arguments for a given axis, in a specified chart on a specified sheet:
=PT_ScaleChartAxis(SheetName,ChartName,X_or_Y,Primary_or_Secondary,Minimum,Maximum,MajorUnit,MinorUnit)To hard-code some values into the formula, use this:
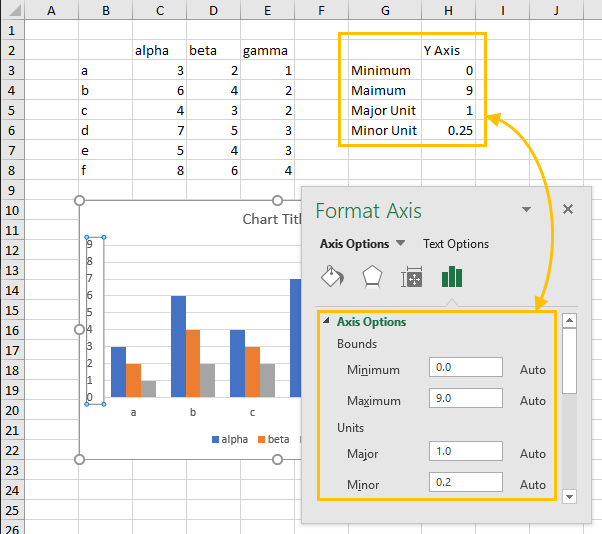
=PT_ScaleChartAxis("Sheet1","Chart 1","Y","Primary",0,10,2,0.5)To link the axis scale to cell values, as in the screenshot at the beginning of this article, use this:
=PT_ScaleChartAxis("Sheet1","Chart 1","Y","Primary",H3,H4,H5,H6)Note that the worksheet name is specified as well as the chart name. The function accepts “x”, “X”, “category”, “cat”, or 1 for the category axis, and “y”, “Y”, “value”, “val”, or 2 for the value axis. It allows “primary”, “pri”, or 1 for the primary axis, and “secondary”, “sec”, or 2 for the secondary axis. For the axis scale arguments, the function accepts a numerical value, a valid cell reference, “auto”, “autoscale”, or “default” to let Excel apply its default scaling for that argument, and “null”, “skip”, “ignore”, “blank”, or a blank to make no change to that argument.
The function also returns informative feedback to the cell:
Sheet 'Sheet1' Chart 'Chart 1' Primary Y Axis {0, 10, 2, 0.5}If the axis is successfully adjusted, the new parameters are provided; if an error is encountered (“Worksheet ‘Sheet1’ not found”, “Chart ‘Chart 1’ not found on worksheet ‘Sheet1′”, “Cannot scale a category-type axis”, etc.) then a message is returned.
The function’s prefix “PT” indicates that I like this function so much that I’ve added it to the Advanced Edition of my commercial Excel charting add-in, Peltier Tech Charts for Excel.
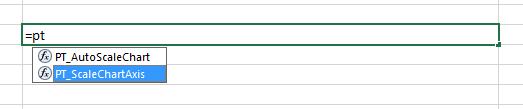
If you start typing the formula into a cell, Excel’s IntelliSense finds it for you:
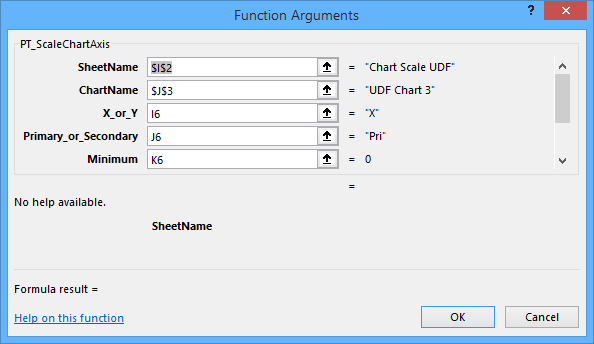
and Excel’s Function Arguments dialog helps you fill in the arguments:
Scaling of Embedded Chart Axes
The first routine controls scaling of axes in charts which are embedded in worksheets. It’s proprietary, but I’ll share the UDF below (it’s long, because of error-proofing and the descriptive output):
Function PT_ScaleChartAxis(SheetName As String, ChartName As String, X_or_Y As Variant, Primary_or_Secondary As Variant, _
    Minimum As Variant, Maximum As Variant, MajorUnit As Variant, MinorUnit As Variant) As Variant

  Dim wks As Worksheet, cht As chart, ax As Axis
  Dim xyAxisGroup As XlAxisGroup
  Dim rCaller As Range
  Dim dMinimum As Double, dMaximum As Double
  Dim bSetMin As Boolean, bSetMax As Boolean
  Dim sError As String, iError As Long
  Dim vTestCategory As Variant

  DoEvents

  Application.Volatile True

  If Len(SheetName) = 0 Then
    Set rCaller = Application.Caller ' cell containing UDF
    SheetName = rCaller.Parent.Name
  End If

  On Error Resume Next
  Set wks = Worksheets(SheetName)
  On Error GoTo 0
  If wks Is Nothing Then
    sError = "Worksheet '" & SheetName & "' not found"
    GoTo ErrorFunction
  End If
  If wks.ChartObjects.Count = 0 Then
    sError = "No charts found on worksheet '" & SheetName & "'"
    GoTo ErrorFunction
  End If

  If Len(ChartName) = 0 Then
    ChartName = wks.ChartObjects(1).Name
  End If

  On Error Resume Next
  Set cht = wks.ChartObjects(ChartName).chart
  On Error GoTo 0
  If cht Is Nothing Then
    sError = "Chart '" & ChartName & "' not found on worksheet '" & SheetName & "'"
    GoTo ErrorFunction
  End If

  Select Case LCase$(X_or_Y)
    Case "x", "1", "category", "cat"
      X_or_Y = xlCategory
      '' but not for non-value axes
    Case "y", "2", "value", "val"
      X_or_Y = xlValue
  End Select

  Select Case LCase$(Primary_or_Secondary)
    Case "primary", "pri", "1"
      Primary_or_Secondary = xlPrimary
    Case "secondary", "sec", "2"
      Primary_or_Secondary = xlSecondary
  End Select

  Set ax = cht.Axes(X_or_Y, Primary_or_Secondary)

  If ax.Type = xlCategory Then
    On Error Resume Next
    vTestCategory = ax.MinimumScale
    iError = Err.Number
    On Error GoTo 0
    If iError <> 0 Then
      sError = "Cannot scale a category-type axis"
      GoTo ErrorFunction
    End If
  End If

  If IsNumeric(Minimum) Or IsDate(Minimum) Then
    dMinimum = Minimum
    bSetMin = True
  Else
    Select Case LCase$(Minimum)
      Case "auto", "autoscale", "default"
        ax.MinimumScaleIsAuto = True
      Case "null", "skip", "ignore", "blank"
        ' make no change
      Case ""
        Minimum = "null"
        ' make no change
    End Select
  End If

  If IsNumeric(Maximum) Or IsDate(Maximum) Then
    dMaximum = Maximum
    bSetMax = True
  Else
    Select Case LCase$(Maximum)
      Case "auto", "autoscale", "default"
        ax.MaximumScaleIsAuto = True
      Case "null", "skip", "ignore", "blank"
        ' make no change
      Case ""
        Maximum = "null"
        ' make no change
    End Select
  End If

  If bSetMin And bSetMax Then
    If dMaximum <= dMinimum Then
      sError = "Maximum must be greater than Minimum"
      GoTo ErrorFunction
    End If
  End If

  If bSetMin Then
    ax.MinimumScale = dMinimum
  End If

  If bSetMax Then
    ax.MaximumScale = dMaximum
  End If

  If IsNumeric(MajorUnit) Then
    If MajorUnit > 0 Then
      ax.MajorUnit = MajorUnit
    End If
  Else
    Select Case LCase$(MajorUnit)
      Case "auto", "autoscale", "default"
        ax.MajorUnitIsAuto = True
      Case "null", "skip", "ignore", "blank"
        ' make no change
      Case ""
        MajorUnit = "null"
        ' make no change
    End Select
  End If

  If IsNumeric(MinorUnit) Then
    If MinorUnit > 0 Then
      ax.MinorUnit = MinorUnit
    End If
  Else
    Select Case LCase$(MinorUnit)
      Case "auto", "autoscale", "default"
        ax.MinorUnitIsAuto = True
      Case "null", "skip", "ignore", "blank"
        ' make no change
      Case ""
        MinorUnit = "null"
        ' make no change
    End Select
  End If

  PT_ScaleChartAxis = "Sheet '" & SheetName & "' Chart '" & ChartName & "' " _
      & Choose(Primary_or_Secondary, "Primary", "Secondary") & " " _
      & Choose(X_or_Y, "X", "Y") & " Axis " _
      & "{" & Minimum & ", " & Maximum & ", " & MajorUnit & ", " & MinorUnit & "}"

ExitFunction:
  Exit Function

ErrorFunction:
  PT_ScaleChartAxis = sError
  GoTo ExitFunction
End Function
Scaling of Chart Sheet Axes
Several readers have asked about modifications which would allow this routine to work for standalone chart sheets, not charts embedded in worksheets. So here is the adjusted code, which works for either type of chart. Use the function as above for a chart ‘ChartName’ embedded in a worksheet ‘SheetName’, or for a chart sheet ‘SheetName’ (leave ChartName blank).
Function ScaleChartAxis(SheetName As String, ChartName As String, X_or_Y As Variant, _
  Primary_or_Secondary As Variant, Optional Minimum As Variant, _
  Optional Maximum As Variant, Optional MajorUnit As Variant, _
  Optional MinorUnit As Variant) As Variant

  ' Text values for Minimum, Maximum, MajorUnit, MinorUnit:
  '   auto, autoscale, default --> use Excel default autoscaling
  '   null, blank, ignore, skip --> don't change the parameter

  Application.Volatile True

  If IsMissing(Minimum) Then Minimum = vbNullString
  If IsMissing(Maximum) Then Maximum = vbNullString
  If IsMissing(MajorUnit) Then MajorUnit = vbNullString
  If IsMissing(MinorUnit) Then MinorUnit = vbNullString

  If Len(SheetName) = 0 Then
    Dim rCaller As Range
    Set rCaller = Application.Caller
    SheetName = rCaller.Parent.Name
  End If

  On Error Resume Next
  Dim wks As Worksheet
  Set wks = Worksheets(SheetName)
  On Error GoTo 0
  If wks Is Nothing Then
    On Error Resume Next
    Dim cht As Chart
    Set cht = Charts(SheetName)
    On Error GoTo 0
    If cht Is Nothing Then
      Dim sError As String
      sError = "Sheet '" & SheetName & "' not found"
      GoTo ErrorFunction
    End If
    Dim sReturn As String
    sReturn = "Chart '" & SheetName & "'" '' jp chart sheet
  Else
    If wks.ChartObjects.Count = 0 Then
      sError = "No charts found on worksheet '" & SheetName & "'"
      GoTo ErrorFunction
    End If

    If Len(ChartName) = 0 Then
      ChartName = wks.ChartObjects(1).Name
    End If

    On Error Resume Next
    Set cht = wks.ChartObjects(ChartName).Chart
    On Error GoTo 0
    If cht Is Nothing Then
      sError = "Chart '" & ChartName & "' not found on worksheet '" & SheetName & "'"
      GoTo ErrorFunction
    End If
    sReturn = "Sheet '" & SheetName & "' Chart '" & ChartName & "'"
  End If

  Select Case LCase$(X_or_Y)
    Case "x", "1"
      X_or_Y = xlCategory
      '' but not for non-value axes
    Case "y", "2"
      X_or_Y = xlValue
  End Select

  Select Case LCase$(Primary_or_Secondary)
    Case "primary", "pri", "1"
      Primary_or_Secondary = xlPrimary
    Case "secondary", "sec", "2"
      Primary_or_Secondary = xlSecondary
  End Select

  Dim ax As Axis
  Set ax = cht.Axes(X_or_Y, Primary_or_Secondary)

  If ax.Type = xlCategory Then
    On Error Resume Next
    Dim vTestCategory As Variant
    vTestCategory = ax.MinimumScale
    Dim iError As Long
    iError = Err.Number
    On Error GoTo 0
    If iError <> 0 Then
      sError = "Cannot scale a category-type axis"
      GoTo ErrorFunction
    End If
  End If

  If Len(Minimum) = 0 Then
    Minimum = "null"
  ElseIf IsNumeric(Minimum) Or IsDate(Minimum) Then
    Dim dMinimum As Double
    dMinimum = Minimum
    Dim bSetMin As Boolean
    bSetMin = True
  Else
    Select Case LCase$(Minimum)
      Case "auto", "autoscale", "default"
        ax.MinimumScaleIsAuto = True
      Case "null", "skip", "ignore", "blank"
        ' make no change
      Case vbNullString
        Minimum = "null"
        ' make no change
    End Select
  End If

  If Len(Maximum) = 0 Then
    Maximum = "null"
  ElseIf IsNumeric(Maximum) Or IsDate(Maximum) Then
    Dim dMaximum As Double
    dMaximum = Maximum
    Dim bSetMax As Boolean
    bSetMax = True
  Else
    Select Case LCase$(Maximum)
      Case "auto", "autoscale", "default"
        ax.MaximumScaleIsAuto = True
      Case "null", "skip", "ignore", "blank"
        ' make no change
      Case vbNullString
        Maximum = "null"
        ' make no change
    End Select
  End If

  If bSetMin And bSetMax Then
    If dMaximum <= dMinimum Then
      sError = "Maximum must be greater than Minimum"
      GoTo ErrorFunction
    End If
  End If

  If bSetMin Then
    ax.MinimumScale = dMinimum
  End If

  If bSetMax Then
    ax.MaximumScale = dMaximum
  End If

  If Len(MajorUnit) = 0 Then
    MajorUnit = "null"
  ElseIf IsNumeric(MajorUnit) Then
    If MajorUnit > 0 Then
      ax.MajorUnit = MajorUnit
    End If
  Else
    Select Case LCase$(MajorUnit)
      Case "auto", "autoscale", "default"
        ax.MajorUnitIsAuto = True
      Case "null", "skip", "ignore", "blank"
        ' make no change
      Case vbNullString
        MajorUnit = "null"
        ' make no change
    End Select
  End If

  If Len(MinorUnit) = 0 Then
    MinorUnit = "null"
  ElseIf IsNumeric(MinorUnit) Then
    If MinorUnit > 0 Then
      ax.MinorUnit = MinorUnit
    End If
  Else
    Select Case LCase$(MinorUnit)
      Case "auto", "autoscale", "default"
        ax.MinorUnitIsAuto = True
      Case "null", "skip", "ignore", "blank"
        ' make no change
      Case vbNullString
        MinorUnit = "null"
        ' make no change
    End Select
  End If

  ScaleChartAxis = sReturn & " " _
    & Choose(Primary_or_Secondary, "Primary", "Secondary") & " " _
    & Choose(X_or_Y, "X", "Y") & " Axis " _
    & "{" & Minimum & ", " & Maximum & ", " & MajorUnit & ", " & MinorUnit & "}"

ExitFunction:
  Exit Function

ErrorFunction:
  ScaleChartAxis = sError
  GoTo ExitFunction
End Function
Custom Autoscaling
People often would like their own axis autoscaling algorithms over Excel’s. For example, Excel uses 0 as the axis minimum if the minimum in the data is less than 5/6 of the maximum in the data (see How Excel Calculates Automatic Chart Axis Limits for details). You could write your own algorithms in the worksheet, based on data used in the chart, or you could use my own algorithm from Calculate Nice Axis Scales in Your Excel Worksheet, and use the results in your formula that calls the chart UDF above.
I’ve added another UDF to Peltier Tech Charts for Excel which uses my axis scale algorithm from Calculate Nice Axis Scales in Excel VBA. It looks like this:
=PT_AutoScaleChart(SheetName,ChartName,PriX,PriY,SecX,SecY)Specify the sheet and chart names, then for each axis, specify
- 1, “autoscale”, “auto”, or TRUE to apply the custom autoscaling
- 0, “ignore”, “skip”, or FALSE to make no change to the axis
- -1, “default”, or “reset” to apply Excel’s default autoscaling
This function is also integrated into IntelliSense and the Function Arguments dialog. PriX and PriY are required, while SecX and SecY are optional. The function returns a descriptive message, indicating success or error.
More Axis Scale Articles
- Calculate Nice Axis Scales with LET and LAMBDA
- Calculate Nice Axis Scales in Your Excel Worksheet
- Calculate Nice Axis Scales in Excel VBA
- Chart UDF to Control Axis Scale
- How Excel Calculates Automatic Chart Axis Limits
- Reciprocal Chart Axis Scale
- Custom Axis Labels and Gridlines in an Excel Chart
- Custom Axis, Y = 1, 2, 4, 8, 16
- Logarithmic Axis Scales
- Link Excel Chart Axis Scale to Values in Cells
- Consistent Axis Scales Across Multiple Charts
- Gantt Chart with Nice Date Axis
- Select Meaningful Axis Scales
- Bar Chart Value Axis Scale Must Include Zero