Link Excel Chart Axis Scale to Values in Cells - Peltier Tech (original) (raw)
Tuesday, May 27, 2014
Peltier Technical Services, Inc., Copyright © 2025, All rights reserved.
Excel offers two ways to scale chart axes. You can let Excel scale the axes automatically; when the charted values change, Excel updates the scales the way it thinks they fit best. Or you can manually adjust the axis scales; when the charted values change, you must manually readjust the scales. Wouldn’t it be great to be able to link the axis scale parameters to values or, even better, formulas in the worksheet? This page shows how to use VBA to accomplish this. If you want a ready-to-use solution, try Tushar Mehta’s AutoChart Manager add-in, available as a free download at http://www.tushar-mehta.com/excel/software/autochart/index.html. There are a few pieces you need to make this technique work. You need a chart, a set of values for the scaling parameters, and some VBA code to change the axis scales. The code can be either linked to a button, or run from a
Worksheet_Change
event procedure.
The Chart
The actual mechanics of creating this chart are incidental to the discussion, but we’ll use the following simple data and chart (named “Chart 1”, the default name of the first chart created in a worksheet). 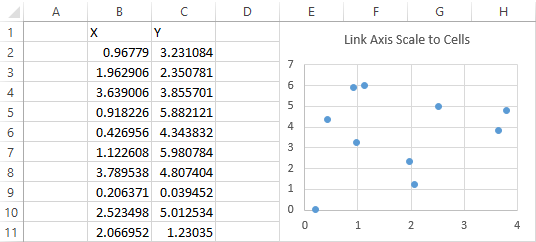
Axis Scale Parameters in the Worksheet
You need a place to put the axis scale parameters. In this example, the range B14:C16 is used to hold primary X and Y axis scale parameters for the embedded chart object named “Chart 1”. This example can be expanded to include secondary axes, or to change other charts as well.  The cells B14:C16 can contain static values which the user can manually change, or they can contain formulas with your favorite axis scaling algorithms. See how to set up axis-scaling formulas in Calculate Nice Axis Scales in Your Excel Worksheet.
Change Chart Axes with VBA
The parts of Excel’s charting object model needed here are the
.MinimumScale
,
.MaximumScale
, and
.MajorUnit
properties of the Axis object (the
.MinorUnit
property could also be controlled, but I usually do not show minor tick marks). These properties can be set equal to constant values, to VBA variables, or to worksheet range or named range values, as illustrated in this code sample:
    With ActiveChart.Axes(xlValue, xlPrimary)
      .MaximumScale = 6
        ' Constant value
      .MinimumScale = dYmin
        ' VBA variable
      .MajorUnit = ActiveSheet.Range("A1").Value
        ' Worksheet range value
    End With
If you have a Line, Column, or Area chart with a category-type X axis, you can’t use the properties shown above. The maximum and minimum values of a category axis cannot be changed, and you can only adjust
.TickLabelSpacing
and
.TickMarkSpacing
. If the X axis is a time-scale axis, you can adjust
.MaximumScale
,
.MinimumScale
, and
.MajorUnit
. You should turn on the macro recorder and format an axis manually to make sure you use correct syntax in your procedure. Any chart’s Y axis is a value axis, and this code will work as is.
VBA Procedure to Rescale Chart Axes
Press Alt+F11 to open the VB Editor. In the Project Explorer window, find the workbook to which you want to add code. 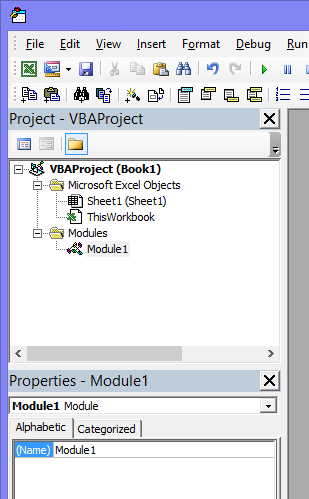 Double click on the module to open it. If there is no module, right click anywhere in the workbook’s project tree, choose Insert > Module. Or use Insert menu > Module. Up will pop a blank code module.
 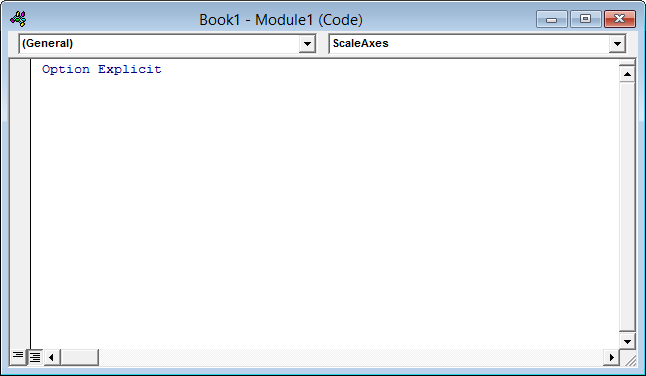 If your module does not say
Option Explicit
at the top, type it in manually. Then go to Tools > Options, and in the Editor tab check the Require Variable Declaration checkbox. This will place
Option Explicit
at the top of every new module, saving innumerable problems caused by typos. While in the Options dialog, uncheck “Auto Syntax Check”. This will save innumerable warnings about errors you already know about because the editor turns the font of the offending code red. 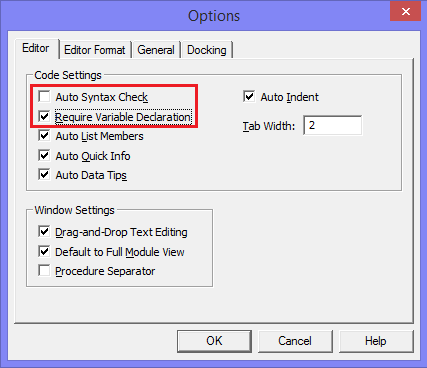 You can use a simple procedure that changes the axes on demand. The following changes the scales of the active chart’s axes using the values in B14:C16. Select the chart, then run the code.
Sub ScaleAxes()
  With ActiveChart.Axes(xlCategory, xlPrimary)
    .MaximumScale = ActiveSheet.Range("B14").Value
    .MinimumScale = ActiveSheet.Range("B15").Value
    .MajorUnit = ActiveSheet.Range("B16").Value
  End With
  With ActiveChart.Axes(xlValue, xlPrimary)
    .MaximumScale = ActiveSheet.Range("C14").Value
    .MinimumScale = ActiveSheet.Range("C15").Value
    .MajorUnit = ActiveSheet.Range("C16").Value
  End With
End Sub
You can type all this into the code module, or you can copy it and paste it in.  Select the chart and run the code. You can run the code by pressing Alt+F8 to open the Macros dialog, selecting the procedure in the list of macros, and clicking Run.
  Or you could assign the code to a button in the worksheet. Here is the chart after running the code.
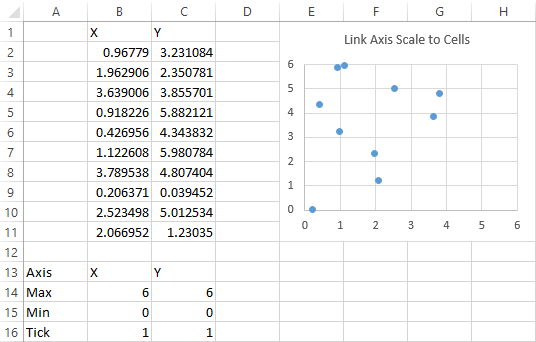
Worksheet_Change Event Procedure to Rescale Chart Axes
A more elegant approach is to change the relevant axis when one of the cells within B14:C16 changes. We can use the
Worksheet_Change
event to handle this. For an introductory description of events in Microsoft Excel, check out the Events page on Chip Pearson’s web site (http://cpearson.com/excel/Events.aspx). The
Worksheet_Change
event procedure fires whenever a cell in the worksheet is changed. To open the code module for a worksheet, right click on a worksheet tab and select
View Code
from the pop up menu. Or double click on the worksheet object in the Project Explorer window. The code module for the worksheet is opened. Now that we’ve set Require Variable Declaration, note that
Option Explicit
has appeared automatically atop the module.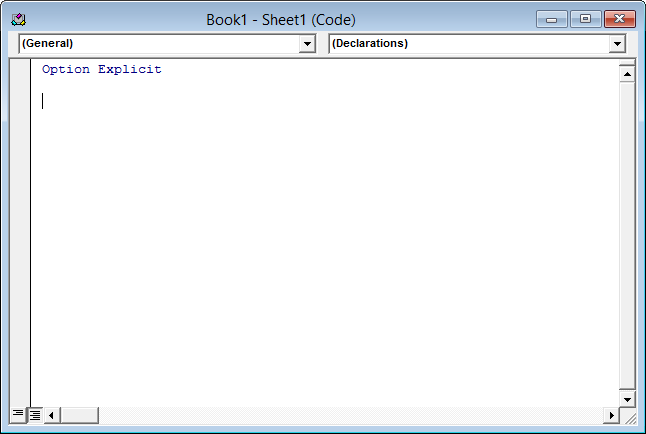 You can write the entire procedure yourself, but it’s easier and more reliable to let the VB Editor start it for you. Click on the left hand dropdown at the top of this module, and select
Worksheet
from the list of objects.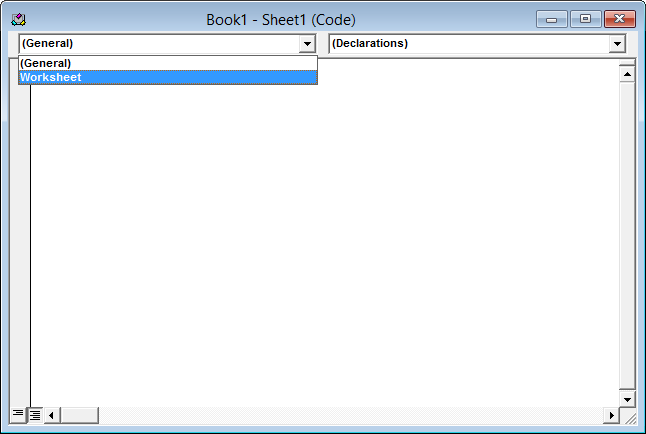 This places a stub for the
Workbook_SelectionChange
event in the module. Ignore this for now. Click on the right hand dropdown at the top of this module, and select
Change
from the list of events. You now have a couple event procedure stubs.
 Delete the
Worksheet_SelectionChange
stub, which we will not be needing, and type or paste the
Worksheet_Change
code into the
Worksheet_Change
stub. The code is given below, so you can copy it. When the event fires, it starts the procedure, passing in
Target
, which is the range that has changed. The procedure uses
Select Case
to determine which cell was changed, then changes the appropriate scale parameter of the appropriate axis.
Private Sub Worksheet_Change(ByVal Target As Range)
  With ActiveSheet.ChartObjects("Chart 1").Chart
    Select Case Target.Address
      Case "$B$14"
        .Axes(xlCategory).MaximumScale = Target.Value
      Case "$B$15"
        .Axes(xlCategory).MinimumScale = Target.Value
      Case "$B$16"
        .Axes(xlCategory).MajorUnit = Target.Value
      Case "$C$14"
        .Axes(xlValue).MaximumScale = Target.Value
      Case "$C$15"
        .Axes(xlValue).MinimumScale = Target.Value
      Case "$C$16"
        .Axes(xlValue).MajorUnit = Target.Value
    End Select
  End With
End Sub
Update
In a recent post, I have written about a user-defined function (UDF) that uses VBA to control axis scales. I find it easier to apply than the technique in this tutorial because all of the necessary information is included in the UDF. For example, the last procedure in this tutorial (just above) would look like this in two cells (one cell per axis):
=PT_ScaleChartAxis("Sheet1","Chart 1","X","Primary",B14,B15,B16)
=PT_ScaleChartAxis("Sheet1","Chart 1","Y","Primary",C14,C15,C16)
To read about this UDF, please go to Chart UDF to Control Axis Scale
More Axis Scale Articles
- Calculate Nice Axis Scales with LET and LAMBDA
- Calculate Nice Axis Scales in Your Excel Worksheet
- Calculate Nice Axis Scales in Excel VBA
- Chart UDF to Control Axis Scale
- How Excel Calculates Automatic Chart Axis Limits
- Reciprocal Chart Axis Scale
- Custom Axis Labels and Gridlines in an Excel Chart
- Custom Axis, Y = 1, 2, 4, 8, 16
- Logarithmic Axis Scales
- Link Excel Chart Axis Scale to Values in Cells
- Consistent Axis Scales Across Multiple Charts
- Gantt Chart with Nice Date Axis
- Select Meaningful Axis Scales
- Bar Chart Value Axis Scale Must Include Zero