Split Data Range into Multiple Chart Series without VBA - Peltier Tech (original) (raw)
Friday, May 23, 2008
Peltier Technical Services, Inc., Copyright © 2025, All rights reserved.
In VBA to Split Data Range into Multiple Chart Series I shared a VBA procedure that split a range into separate series in a chart. In fact, this is fairly easy to do using conditional chart formatting techniques I describe on my web site (see Simple Conditional Charts). The way these techniques work is to use formulas in separate columns to capture values from the main data column when certain conditions are met.
The data used in the other post is shown below, with the conditional columns added.
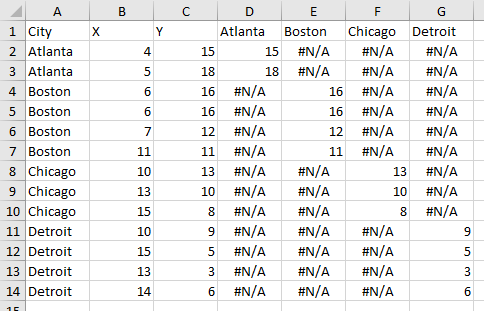
The unique items from column A are entered into row 1 of columns D through G. The following formula is entered into cell D2 and filled into the entire range D2:G14:
=IF($A2=D$1,$C2,NA())
The formula compares the label in column A with the header in row 1: if they match, the formula returns the value in column C otherwise it returns #N/A, which is not charted in a line or XY chart (for a bar or column chart, you can use the empty string “” instead of NA()).
Select the X Values (B1:B14), then hold CTRL while you select the conditional Y values (D1:G14), then create a chart. After formatting, the result is identical to the chart processed by VBA approach:
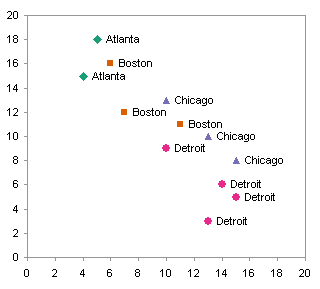
The benefit of this approach over VBA, in addition to not requiring the user to enable macros, is that the data for each city does not need to be together in the data range.
Peltier Tech Articles About Conditional Formatting of Excel Charts
This is one example of conditional formatting in Excel charts. I have written numerous other articles on this topic:
- Conditional Formatting of Excel Charts
- Conditional XY Charts Without VBA
- Invert if Negative Formatting in Excel Charts
- Conditional Donut Chart
- Highlight Min and Max Data Points in an Excel Chart
- Conditional Formatting of Lines in an Excel Line Chart Using VBA
- VBA Conditional Formatting of Charts by Value and Label
- VBA Conditional Formatting of Charts by Series Name
- VBA Conditional Formatting of Charts by Value
- VBA Conditional Formatting of Charts by Category Label
Posted: Friday, May 23rd, 2008 under Data Techniques.
Tags: Conditional Charts.
Comments: 14