The endocytic receptor protein LRP also mediates neuronal calcium signaling via N-methyl-d-aspartate receptors (original) (raw)
Abstract
The low density lipoprotein receptor-related protein (LRP) is an endocytic receptor that is a member of the low density lipoprotein receptor family. We report that the LRP ligand, activated α2-macroglobulin (α2M*), induces robust calcium influx in cultured primary neurons, but not in nonneuronal LRP-containing cells in the same culture. The calcium influx is mediated through _N_-methyl-d-aspartate receptor channels, which explains the neuron specificity of the response. Microapplication of α2M* leads to a localized response at the site of application that dissipates rapidly, suggesting that the calcium signal is temporally and spatially discrete. Calcium influx to α2M* is blocked by the physiological LRP inhibitor, receptor-associated protein. Bivalent antibodies to the extracellular domain of LRP, but not Fab fragments of the same antibody, cause calcium influx, indicating that the response is specific to LRP and may require dimerization of the receptor. Thus, LRP is an endocytic receptor with a novel signaling role.
The low density lipoprotein (LDL) receptor is one of the best studied examples of an endocytic receptor, delivering cholesterol-containing lipoproteins and other ligands to acidic compartments within cells for further metabolism. A family of homologous receptors plays similar roles in various tissues, including the very low density lipoprotein receptor (VLDL-r), the apolipoprotein E receptor 2 (apoER2), the LDL receptor-related protein (LRP), and megalin (or GP330). We now report a neuron-specific signaling role for LRP: ligand binding and receptor dimerization lead to calcium influx via_N_-methyl-d-aspartate receptor (NMDAR) channels.
LRP is a widely expressed endocytic receptor that is strongly expressed in brain on neurons and reactive astrocytes (1). LRP is a >600-kDa (4,454-aa) protein cleaved in the trans-Golgi network to form a heterodimer with a single transmembrane-spanning domain, a ≈515-kDa extracellular region containing four ligand-binding repeat regions, multiple epidermal growth factor and other growth factor repeats, and a smaller intracellular domain containing two NPXY sequences that direct endocytosis of the receptor to clathrin-coated pits (2–4). LRP has more than 15 identified ligands that fall into several broad categories: proteinase/proteinase inhibitor complexes including activated α2-macroglobulin (α2M*), apoE and lipid-related ligands, and others such as lactoferrin. The 39-kDa receptor-associated protein (RAP) is an endoplasmic chaperone protein tightly bound to LRP, which, when used pharmacologically, specifically blocks and prevents uptake of all known LRP ligands (3, 5, 6). Like other members of the LDL receptor family, LRP binds and imports these ligands into intracellular vesicles, where the ligand is released and the receptor is recycled to the surface.
α2M is a unique pan-protease inhibitor that is synthesized and secreted in the brain (7). A tetrameric complex undergoes a conformational alteration when a “bait” region is cleaved by a protease. This both sterically traps the protease and generates an activated form of α2M (α2M*), which is then a ligand for LRP (8). Treatment with methylamine leads to the same conformational change and is used experimentally to generate α2M* (9). LRP (3) and apoER2 (10) are the only known brain receptors for α2M*, mediating clearance of protease/protease inhibitor complexes.
Our current study demonstrates unequivocally that LRP is also a signaling receptor in neurons. A robust, spatially and temporally discrete calcium signal is observed in neurons treated with ligand-competent α2M (α2M*). The calcium influx is blocked by RAP. LRP containing nonneuronal cells in the same cultures do not have a calcium response. The calcium signal is dependent on extracellular calcium and is blocked by the NMDAR antagonist MK-801. Calcium influx in neurons also occurs after treatment with R777, an antibody directed against the extracellular domain of LRP, and this response can be blocked with MK-801. Calcium entry does not occur after treatment with Fab fragments of R777, suggesting that receptor dimerization may be critical. These results demonstrate a distinct signaling role for the multifunctional receptor LRP in neurons.
Methods
Primary cultures of mouse cortex were prepared from embryonic day 15–17 CD1 mice. The cortices were isolated and triturated in Ca2+-free PBS and plated onto 35-mm polylysine-coated culture dishes at a density of 2 × 10⁶ cells/ml in neurobasal medium containing 10% FBS (Intergen, Purchase, NY), 2 mM glutamine, 100 units/ml penicillin, and 100 μg/ml streptomycin. After 45–60 min at 37°C, supernatants containing unattached cells were removed, and attached cells were incubated in neurobasal medium supplemented with 1X B27 (GIBCO). After 48 h, 5 μg/ml cytosine-β-d-arabinofuranoside (Sigma) was added for 48 h in serum-containing medium, and then the medium was replaced with neurobasal plus B27. Cultures were used between 7 and 14 days after plating. Although highly enriched for neurons, the cultures contained some nonneuronal cells.
α2M (Sigma) was activated (α2M*) by incubating with 100 mM methylamine at pH 7.6 in PBS for 1 h at room temperature, followed by dialysis in PBS for 24 h at 4°C, with at least three buffer changes. Native α2M was treated identically except for the addition of methylamine.
For calcium-imaging experiments, indo-1/AM (Calbiochem) was mixed with 20% pluronic F-127 (Molecular Probes) in DMSO and then added to the culture dishes at a final concentration of 1 μM indo-1/AM and 0.02% pluronic F-127 for 30 min (11). The cells then were washed and maintained in HBSS supplemented with 1 g/liter glucose, pH 7.4.
The dishes were placed on the stage of an upright microscope (Olympus BX50WI) and imaged with a multiphoton confocal microscope (Bio-Rad). A femtosecond-pulsed Ti:Saphire laser (Spectra-Physics) tuned to 725 nm provided approximately 300 mW of excitation power. External photomultiplier tubes (Hamamatsu Photonics, Hamamatsu City, Japan) that did not require descanning the emission signal were used to capture the two wavelength channels, which were discriminated with interference filters corresponding to 390-nm, 65-nm band pass and 495-nm, 20-nm band pass (Chroma Technology, Brattleboro, VT). A ×60 water-immersion objective, numerical aperture = 0.9 (Olympus, New Hyde Park, NY), was used to view the cells.
Time-course experiments were performed by acquiring an image pair (512 × 512 pixels, 8 bits per pixel) at a relatively slow rate (generally, 0.2 Hz) and saving the images to disk. Regions of interest (ROI) within an image were selected, corresponding to the cell bodies of single cells. The average intensity from within each ROI was obtained for each emission wavelength, the appropriate background level was subtracted, and the ratio was calculated. The ratio reflects changes in intracellular calcium concentration ([Ca2+]i), independently of excitation strength, concentration of indo-1, volume of the cell, or the optical path. The ratios were converted to calcium concentration after calibrating the dye in vitro with a series of calcium buffers (Molecular Probes) and plotted as a function of time.
Fab fragments were generated from the polyclonal antibody as follows. R777 was dialyzed against 20 mM sodium phosphate/10 mM EDTA, pH 7.0, and mixed with 0.5 ml of Pierce immobilized papain in 20 mM sodium phosphate/10 mM EDTA, pH 7.0, containing 20 mM cysteine. Digestion was carried out at 37°C for 12 h with gentle mixing. After digestion, the digest was applied to protein A-Sepharose, and the nonbinding Fab fragments were collected. The Fab fragments were analyzed by immunoblotting cell extracts (using 5 μg/ml), revealing positive reactivity against only LRP.
Statistics were performed by using a paired Student's t test. Data from all cells within an experiment were averaged, and statistics were performed based on the number of experiments. Data are expressed as mean ± SD.
Results
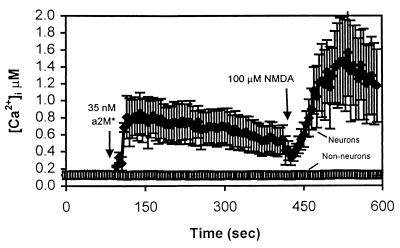
Primary cultures of mouse cortex were loaded with the fluorescent calcium indicator indo-1/AM. Addition of methylamine-activated α2M (α2M*, 35 nM) elicited an increase in [Ca2+]i in a subset of cells within the mixed cultures (Fig. 1). α2M* increased [Ca2+]i in responsive cells from 88 ± 29 nM to 396 ± 22 nM [n = 24 experiments, 211 cells, P < 0.001). Unresponsive cells did not exhibit a significant increase in [Ca2+]i, [106 ± 22 nM vs. 107 ± 18 nM; _n_ = 8 experiments, 26 cells, not significant (NS), _P_ > 0.05].
Figure 1.
α2M* increases [Ca2+]i specifically in neurons. Primary cultures of mouse cortex were loaded for 30 min with 1 μM indo-1/AM and imaged by using a Bio-Rad 1024 Multiphoton confocal microscope. The traces represent a time course of intracellular calcium concentration in a field of cells in a single, representative experiment. Each trace is the average of six cells within the field, ± SD. Not all cells in the mixed cultures responded to α2M* treatment. The cells that did respond resembled neurons morphologically and also responded to NMDA application. Nonresponders had the generally flat appearance of glia and/or fibroblasts and did not respond to NMDA addition.
Morphologically, the responding cells resembled neurons, and the nonresponding cells had the appearance of glia or fibroblasts. To help distinguish the identity of cells after an experiment, NMDA (100 μM) was added to the bath. Nonneuronal cells generally do not respond to NMDA (12), whereas neurons that do express NMDA receptors allow calcium entry in the presence of NMDA (13). Using this criterion, the responding cells all were identified as neurons. Greater than 95% of NMDA-responsive cells responded to α2M* (203 of 208 cells), whereas greater than 90% of all non-NMDA-responsive cells failed to show a calcium response to α2M* (67 of 72).
The time course and magnitude of the response to bath application of α2M* varied to some extent even among neurons within a field. The calcium response occurred within several tens of seconds after ligand addition, and, in most cases, the response was sustained for several tens of minutes until the end of the experiment. However, occasionally, the calcium response was transient, returning to baseline within several minutes. No consistent difference in these subpopulations in terms of response to NMDA or in morphology was noted.
The response is specific for activated α2M* because treatment of neurons with native α2M (70 nM) had no effect on [Ca2+]i (139 ± 80 nM vs. 144 ± 80 nM; n = 4 experiments, 54 cells, NS, P > 0.05). Likewise, to test the possibility that residual methylamine was initiating the increase in calcium, we added methylamine at concentrations of up to 100 μM directly to the cultures with no effect on [Ca2+]i (data not shown). Thus, activated α2M appears to be critical for the calcium response.
To test the possibility that the α2M*-induced increase in intracellular calcium is an indirect effect of synaptic activity in the cultures, α2M* was added in the presence of 2–5 μM tetrodotoxin (TTX). At this concentration, the cultured neurons are unable to generate action potentials. However, α2M* was capable of eliciting a calcium response even in the presence of TTX (data not shown). This result indicates that the observed calcium response elicited by α2M* is not an indirect result of synaptic glutamate release.
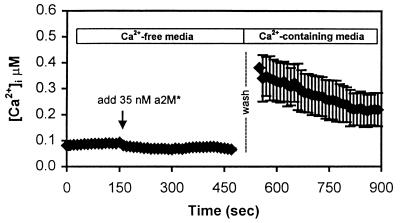
Although the time course of the calcium response in neurons was not suggestive of calcium release from intracellular stores, we tested this hypothesis by adding α2M* in the absence of extracellular calcium (Fig. 2). Under this condition, α2M* (35 nM) is unable to increase [Ca2+]i (n = 3 experiments, 31 cells, 82 ± 20 nM vs. 64 ± 14 nM, NS, P > 0.05). This indicates that the observed calcium entry is not from release of calcium from intracellular stores. When the calcium-free buffer was replaced with a calcium-containing buffer, [Ca2+]i increased to the typical stimulated levels (n = 3 experiments, 266 ± 70 nM, P < 0.05). This suggests that (_i_) the α2M* was able to bind to its receptor in the absence of calcium; (_ii_) receptor-mediated processes allowing calcium entry were activated in the absence of calcium; and (_iii_) the source of the calcium entry is from the extracellular environment through plasma membrane calcium channels. Consistent with this idea, pretreating the cultures with the nonspecific calcium channel blocker NiCl2 (2–5 mM, _n_ = 5 experiments, 25 cells 89 ± 8 nM vs. 107 ± 23 nM, NS, _P_ > 0.05) or CoCl2 (5 mM, n = 4 experiments, 44 cells, 86 ± nM vs. 107 ± 23 nM, NS, P > 0.05) abolished the calcium response to α2M*.
Figure 2.
The calcium increase requires extracellular calcium. Cells were placed in nominally calcium-free buffer (not containing EGTA), and α2M* was added at approximately t = 150 sec. No intracellular calcium increase was observed. In fact, a small decrease was indicated. The calcium-free buffer was washed and replaced with calcium-containing buffer (2 mM) at t = 500 sec. After replacement of calcium, [Ca2+]i levels increased to about 400 nM, similar to levels normally observed after stimulation by α2M* in calcium-containing buffers. This suggests that α2M* was able to bind to LRP in the absence of calcium and initiate a calcium-signaling event. The response requires extracellular calcium, but not release of calcium from intracellular stores. The trace is the average of n = 7 cells in a field.
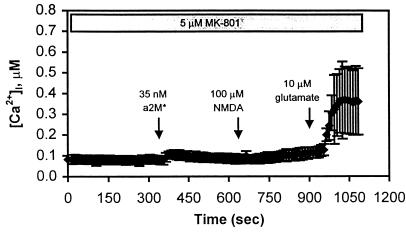
To test whether NMDAR channels might be involved in the response, cultures were pretreated with 5 μM MK-801, a potent NMDAR antagonist. This treatment abolished the [Ca2+]i response mediated by α2M* (Fig. 3) (n = 4 experiments, 60 cells, 84 ± 12 nM vs. 113 ± 26 nM, NS, P > 0.05). This result demonstrates that the calcium signal observed by activation of LRP with α2M* is mediated by calcium entry through NMDARs. This also explains the observation that the response is specific for neurons in the mixed cultures.
Figure 3.
Calcium entry occurs through NMDAR channels. In this experiment, the cells were pretreated with 5 μM MK-801 for 5 min, and the NMDAR antagonist remained in the bath throughout the procedure. At_t_ = 350 sec, 35 nM α2M* was added to the bath, resulting in a small but insignificant increase in [Ca2+]i in this field of cells. At_t_ = 700 sec, 100 μM NMDA was added, and no change in [Ca2+]i was observed. Glutamate (10 μM), however, was capable of eliciting a calcium response at_t_ = 900 sec. This is a representative trace of_n_ = 4 experiments and is the mean of_n_ = 15 neurons in a field.
A variety of other channel antagonists were tested; however, none was able to prevent the α2M*-stimulated calcium increase when used alone, including nimodipine, ω-conotoxin, and ω-agatoxin IVA (Table 1).
Table 1.
The effect of channel blockers on the α2M*-mediated calcium response
| Channel antagonist | Type of channel affected | Result |
|---|---|---|
| Ca2+ removal | All Ca2+ channels | Blocked Ca2+ response |
| NiCl2 (2–5 mM) | All Ca2+ channels | Blocked Ca2+ response |
| CoCl2 (5 μM) | All Ca2+ channels | Blocked Ca2+ response |
| MK801 (5 μM) | NMDAR channels | Blocked Ca2+ response |
| ω-Agatoxin IVA (2 μM) | P/Q type Ca2+ channels | No effect |
| Nimodipine (5 μM) | L type Ca2+ channels | No effect |
| ω-Conotoxin (1 μM) | N type Ca2+ channels | No effect |
| Tetrodotoxin (5 μM) | Na+ channels | No effect |
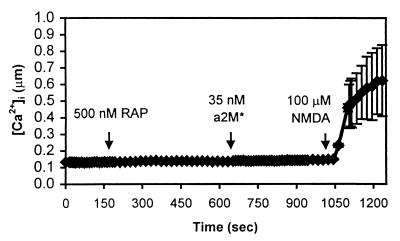
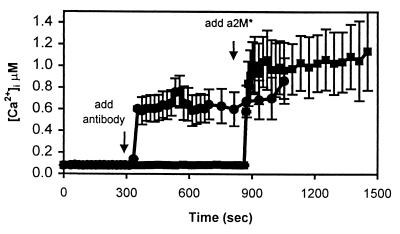
We next examined whether the α2M*-induced calcium influx was mediated by LRP. Preincubation with a specific physiologic inhibitor of LRP, RAP (500 nM), blocked the response to α2M* (n = 4 experiments, 27 cells, 114 ± 17 nM vs. 125 ± 9 nM, NS, P > 0.05; Fig. 4). RAP blocks ligand-receptor interactions with all members of the LDL receptor family proteins. We therefore next used an anti-LRP antibody that specifically interacts with LRP but not other members of the LDL receptor family. Western blots of brain homogenates probed with the rabbit polyclonal antibody R777 (3), directed against the ligand-binding repeat region of LRP, showed no cross-reactivity with apoER2, VLDL-r, or GP330 (data not shown). R777 was added to neuronal cultures at a concentration of 10 μg/ml (Fig. 5). This resulted in an immediate, marked increase in neuronal calcium (n = 8 experiments, 92 cells, 84 ± 13 nM vs. 728 ± 426 nM,P < 0.01) but no response in nonneuronal cells (data not shown). The response to R777 was blocked completely when the cultures were pretreated with 5 μM MK-801 (_n_ = 3 experiments, 61 cells, 102 ± 12 vs. 120 ± 4 nM, NS,_P_ < 0.05). The rabbit polyclonal antibody R704 (3)**,** which is directed against a C-terminal portion of LRP, did not elevate [Ca2+]i (_n_ = 3 experiments, 29 cells, 86 ± 5 nM vs. 120 ± 5 nM, NS, _P_ > 0.05). Thus, the ability of antibody R777 to recognize the ligand-binding region of LRP activates the calcium response.
Figure 4.
The calcium response is blocked by RAP. RAP (500 nM) was added to the bath at t = 200 sec. RAP had no discernible effect on intracellular calcium. At t = 650 sec, 35 nM α2M* was added to the bath, but calcium was unaffected. NMDA was able to elicit a normal response in the seven cells in this field.
Figure 5.
An antibody to the ligand-binding domain of LRP increases [Ca2+]i, but an antibody to an intracellular domain of LRP does not. This figure illustrates two experiments using rabbit polyclonal antibodies directed against LRP. In the top trace (●), R777 was added, which recognizes the ligand-binding domain of LRP. The addition of R777 increases [Ca2+]i in a neuron-specific manner. In the bottom trace (■), the addition of R704, which recognizes an intracellular domain of LRP, is unable to elicit an increase in [Ca2+]i. However, the subsequent addition of α2M* is able to generate a calcium response in these cells. Each trace is the average of seven cells in a field.
Both α2M*, which is tetrameric, and the bivalent R777 antibody potentially lead to dimerization of the ligand-binding domains of LRP. To test the possibility that dimerization of the receptor or cross-linking of the ligand-binding sites is important for the calcium response in neurons, Fab fragments were derived from R777; Western blot analysis showed that the Fab fragments specifically recognized LRP (data not shown). Addition of up to 275 μg/ml Fab showed no response (n = 5 experiments, 59 cells, 79 ± 9 nM vs. 80 ± 13 nM, NS,P > 0.05). To examine this issue further, and to test the hypothesis that endocytosis is sufficient to evoke a calcium signal, we examined neuronal responses to another LRP ligand that is bound and readily endocytosed by LRP but is monomeric. Lactoferrin is readily taken up by neurons via LRP (14), but lactoferrin**(up to 5 μM)** did not evoke a calcium response (n = 4 experiments, 32 cells, 79 ± 9 nM vs. 89 ± 21 nM, NS, P > 0.05). These results demonstrate that although the Fab fragments and lactoferrin bound to the receptor, they were unable to activate calcium entry, supporting the hypothesis that dimerization of LRP may be important for the calcium-signaling event.
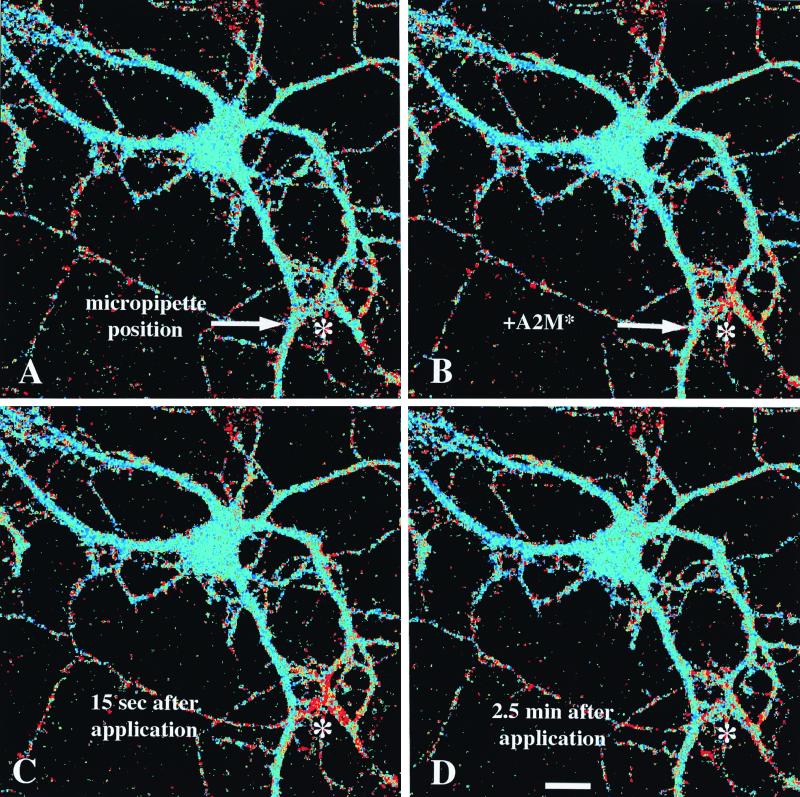
We postulated that α2M* concentrations might provide information about the local microenvironment to neurons and, therefore, might alter local dendritic calcium levels in a spatially restricted fashion. As a means of examining the spatial characteristics of the response, several picoliters of a 5 μM α2M* solution was applied via micropipette to various regions of individual neurons by using a pressure pulse. Fig.6 shows four snapshots of the time course of one such experiment, where the micropipette was positioned over dendrites of the cell, distant to the cell body. The delivery of α2M* was restricted to a circular area with a radius of about 25 μm, and this is the only area that responds with a calcium increase. The response is localized and decays within several tens of seconds. Indeed, a second pressure pulse is able to stimulate the same area again, without affecting the calcium concentration in the cell body. In a similar experiment, positioning the pipette near the cell body is capable of eliciting a calcium transient that is restricted to the cell body and does not spread to the dendrites. Thus, the response can be spatially restricted and does not lead to a global increase in calcium nor probably to a large cellular depolarization.
Figure 6.
The calcium response is spatially restricted. A single cell was imaged with a multiphoton confocal microscope. α2M* was loaded into a glass micropipette, which was positioned with a micromanipulator near dendritic processes of the cell in the lower right corner of each image, as indicated by the asterisk (*). (A) Pseudocolor image of the cell immediately before administering α2M*. Blue colors represent low [Ca2+]i, and greens to yellows then reds represent increasing [Ca2+]i. (B) An image immediately after a 100-msec pressure pulse through the pipette, emitting a restricted cloud of α2M* just above the dendrites. (C) The cell approximately 15 sec after the pressure pulse, when the calcium change reaches its peak within a radius of about 25 μm of the tip of the pipette. (D) An image of the cell 2.5 min after the pressure pulse. The calcium concentration has returned to baseline by this time point. This result is representative of n = 6 experiments.
Discussion
Members of the LDL receptor family, including LRP, have been studied extensively as multiligand endocytic receptors (2, 15, 16). Our data support several conclusions suggesting that LRP serves an unexpected role as a signaling receptor as well. Stimulation of neurons by the LRP ligand α2M* elicits a robust calcium response. The calcium influx is local to the area of stimulation and is temporally linked to the stimulus. The response appears to require LRP receptor dimerization. The response is neuron-specific and is mediated through NMDAR channels. Nonneuronal cells containing LRP within the same culture wells do not respond to α2M* with calcium influx.
LRP is implicated as the mediator of this response because it is an α2M* receptor on neurons (1, 16), and the effect is blocked by RAP, which is a specific physiologic inhibitor of the LDL family of receptors. That LRP is specifically involved is demonstrated by the observation that an antibody directed against the extracellular domain of LRP also can induce calcium influx in neurons. Of note, both α2M*, which is tetrameric, and the bivalent antibody potentially could lead to dimerization of the receptor; the Fab fragments of the same antibody and a monomeric ligand, lactoferrin, did not evoke a calcium response, supporting the conclusion that dimerization may play a role in calcium signaling. LRP is present on both neurons and astrocytes in culture and in adult brain (1, 16, 17), although only neurons have an LRP-mediated calcium response. We postulate that there may be a neuron-specific intracellular adapter protein that mediates opening of NMDAR channels after LRP dimerization or that LRP may interact directly with NMDARs.
Links between α2M* and calcium influx have been examined in several systems. Previous studies in macrophages (18) and trabecular meshwork cells (19) suggest two classes of α2M methylamine receptors: LRP and a separate “signaling receptor.” Stimulation of the latter leads to a rapid rise in intracellular calcium in macrophages, which is not blocked by RAP or altered by LRP antibodies. By contrast, α2M* binding to LRP does not appear to induce a calcium influx in macrophages, consistent with the lack of response we observed in nonneuronal cells. The current study establishes a calcium signaling role for α2M* via LRP.
In neurons, the role of LDL receptor family members in calcium influx may be complex. A rise in intracellular calcium in hippocampal neurons has been observed after treatment with apoE (20); these apoE-evoked Ca2+ increases are dependent on extracellular calcium and blocked by the Ca channel antagonists nickel and ω-Agatoxin-IVa, implicating activation of P/Q type Ca2+ channels (21). More similar to the current findings, proteolytic fragments of apoE or a tandem dimer repeat peptide derived from apoE elicited calcium responses in both hippocampal cultures and chick sympathetic neurons; in this case, the calcium increases were blocked by RAP and by the NMDAR antagonist MK-801 (22). It is not clear which receptor mediates this response. The relationship among these various experimental systems must be examined more closely, but the accumulating evidence strongly suggests that, in neurons, stimulation of LRP by ligands such as α2M* or apoE leads to a calcium-signaling event. We postulate that this acts as a neuronal sensor for proteolytic activity or lipid breakdown within a dendrite's microenvironment.
The influx of calcium into spatially segregated dendritic elements because of LRP-mediated activation of NMDAR channels is likely to impact locally a wide variety of downstream signaling cascades, including IP3, protein kinase C, and calcium-/calmodulin-dependent kinase (23). This cascade implies that α2M* interaction with LRP may provide a novel mechanism of altering local dendritic excitability and, thus, synaptic efficacy. α2M* previously has been implicated in inhibiting long-term potentiation (24). Of note, another LRP ligand, tPA, contributes to activity-dependent synaptic plasticity in the hippocampus via LRP (25); we postulate that the LRP-mediated NMDAR channel activation and calcium influx we observe might contribute to these phenomena.
In addition to its well established role as a multiligand endocytic receptor, there is some precedence for the LDL receptor family having a role in neuronal signaling pathways. α2M*, apoE, and other LRP ligands have been shown to promote neurite outgrowth via LRP (26–29). apoER2/VLDL-r double-null animals develop a reeler phenotype (30), and because reelin is a ligand for apoER2 and VLDL-r, this supports the idea that these receptors directly mediate reelin signal transduction (30, 31). It is interesting to note that both VLDL-r and apoER2 also are expressed strongly on mature neurons (32, 33), and apoER2 has been reported to be an α2M* receptor (10). Our data with a specific anti-LRP antibody clearly implicate LRP itself but do not rule out a role for apoER2 in calcium signaling.
Several LRP ligands have been implicated strongly in the pathophysiology of Alzheimer's disease. The amyloid precursor protein (APP) is a protease inhibitor and ligand for LRP (34). ApoE and α2M* bind amyloid-β, and the complexes can be cleared by LRP (14, 35, 36). Genetic studies strongly implicate polymorphisms in the apoE, α2M, and LRP genes in affecting risk for late-onset Alzheimer's disease (see ref. 37 for review). Finally, it should be noted that APP can bind DAB1 and Fe65 adapter proteins, proteins that also interact with LRP (38). Our current observations that LRP may be both an endocytic and a signaling receptor thus may be of relevance to the role of LRP and its ligands in Alzheimer's disease.
Acknowledgments
This work was supported by Grant AG12406 from the National Institutes of Health.
Abbreviations
LDL
low density lipoprotein
VLDL-r
very low density lipoprotein receptor
LRP
LDL receptor-related protein
α2M
α2-macroglobulin
α2M*
activated α2M
apoER2
apolipoprotein E receptor 2
RAP
receptor-associated protein
NMDAR
_N_-methyl-d-aspartate receptor
NS
not significant
[Ca2+]i
intracellular calcium concentration
Footnotes
This paper was submitted directly (Track II) to the PNAS office.
Article published online before print: Proc. Natl. Acad. Sci. USA, 10.1073/pnas.200238297.
Article and publication date are at www.pnas.org/cgi/doi/10.1073/pnas.200238297
References
- 1.Rebeck G W, Reiter J S, Strickland D K, Hyman B T. Neuron. 1993;11:575–580. doi: 10.1016/0896-6273(93)90070-8. [DOI] [PubMed] [Google Scholar]
- 2.Herz J, Hamann U, Rogne S, Myklebost O, Gausepohl H, Stanley K K. EMBO J. 1988;7:4119–4127. doi: 10.1002/j.1460-2075.1988.tb03306.x. [DOI] [PMC free article] [PubMed] [Google Scholar]
- 3.Strickland D K, Ashcom J D, Williams S, Burgess W H, Migliorini M, Argraves W S. J Biol Chem. 1990;265:17401–17404. [PubMed] [Google Scholar]
- 4.Willnow T E, Rohlmann A, Horton J, Otani H, Braun J R, Hammer R E, Herz J. EMBO J. 1996;15:2632–2639. [PMC free article] [PubMed] [Google Scholar]
- 5.Williams S E, Ashcom J D, Argraves W S, Strickland D K. J Biol Chem. 1992;267:9035–9040. [PubMed] [Google Scholar]
- 6.Medved L V, Migliorini M, Mikhailenko I, Barrientos L G, Llinas M, Strickland D K. J Biol Chem. 1999;274:717–727. doi: 10.1074/jbc.274.2.717. [DOI] [PubMed] [Google Scholar]
- 7.Higuchi M, Ito T, Imai Y, Iwaki T, Hattori M, Kohsaka S, Niho Y, Sakaki Y. Gene. 1994;141:155–162. doi: 10.1016/0378-1119(94)90565-7. [DOI] [PubMed] [Google Scholar]
- 8.Stoops J K, Schroeter J P, Bretaudiere J P, Olson N H, Baker T S, Strickland D K. J Struct Biol. 1991;106:172–178. doi: 10.1016/1047-8477(91)90086-c. [DOI] [PMC free article] [PubMed] [Google Scholar]
- 9.Schroeter J P, Kolodziej S J, Wagenknecht T, Bretaudiere J P, Tapon-Bretaudiere J, Strickland D K, Stoops J K. J Struct Biol. 1992;109:235–247. doi: 10.1016/1047-8477(92)90036-a. [DOI] [PubMed] [Google Scholar]
- 10.Stockinger W, Hengstschlager-Ottnad E, Novak S, Matus A, Hüttinger M, Bauer J, Lassmann H, Schneider W J, Nimpf J. J Biol Chem. 1998;273:32213–32221. doi: 10.1074/jbc.273.48.32213. [DOI] [PubMed] [Google Scholar]
- 11.Grynkiewicz G, Poenie M, Tsien R Y. J Biol Chem. 1985;260:3440–3450. [PubMed] [Google Scholar]
- 12.Beaman-Hall C M, Leahy J C, Benmansour S, Vallano M L. J Neurochem. 1998;71:1993–2005. doi: 10.1046/j.1471-4159.1998.71051993.x. [DOI] [PubMed] [Google Scholar]
- 13.Grant E R, Bacskai B J, Pleasure D E, Pritchett D B, Gallagher M J, Kendrick S J, Kricka L J, Lynch D R. J Biol Chem. 1997;272:647–656. doi: 10.1074/jbc.272.1.647. [DOI] [PubMed] [Google Scholar]
- 14.Qiu Z, Strickland D K, Hyman B T, Rebeck G W. J Neurochem. 1999;73:1393–1398. doi: 10.1046/j.1471-4159.1999.0731393.x. [DOI] [PubMed] [Google Scholar]
- 15.Herz J, Kowal R C, Ho Y K, Brown M S, Goldstein J L. J Biol Chem. 1990;265:21355–21362. [PubMed] [Google Scholar]
- 16.Bu G, Maksymovitch E A, Geuze H, Schwartz A L. J Biol Chem. 1994;269:29874–29882. [PubMed] [Google Scholar]
- 17.Bu G, Maksymovitch E A, Nerbonne J M, Schwartz A L. J Biol Chem. 1994;269:18521–18528. [PubMed] [Google Scholar]
- 18.Misra U K, Chu C T, Gawdi G, Pizzo S V. J Biol Chem. 1994;269:18303–18306. [PubMed] [Google Scholar]
- 19.Howard G C, Roberts B C, Epstein D L, Pizzo S V. Arch Biochem Biophys. 1996;333:19–26. doi: 10.1006/abbi.1996.0359. [DOI] [PubMed] [Google Scholar]
- 20.Hartmann H, Eckert A, Muller W E. Biochem Biophys Res Commun. 1994;200:1185–1192. doi: 10.1006/bbrc.1994.1576. [DOI] [PubMed] [Google Scholar]
- 21.Muller W, Meske V, Berlin K, Scharnagl H, Marz W, Ohm T G. Brain Pathol. 1998;8:641–653. doi: 10.1111/j.1750-3639.1998.tb00190.x. [DOI] [PMC free article] [PubMed] [Google Scholar]
- 22.Tolar M, Keller J N, Chan S, Mattson M P, Marques M A, Crutcher K A. J Neurosci. 1999;19:7100–7110. doi: 10.1523/JNEUROSCI.19-16-07100.1999. [DOI] [PMC free article] [PubMed] [Google Scholar]
- 23.Alkon D L, Nelson T J, Zhao W, Cavallaro S. Trends Neurosci. 1998;21:529–537. doi: 10.1016/s0166-2236(98)01277-6. [DOI] [PubMed] [Google Scholar]
- 24.Cavus I, Koo P H, Teyler T J. J Neurosci Res. 1996;43:282–288. doi: 10.1002/(SICI)1097-4547(19960201)43:3<282::AID-JNR3>3.0.CO;2-F. [DOI] [PubMed] [Google Scholar]
- 25.Zhuo M, Holtzman D M, Li Y, Osaka H, DeMaro J, Jacquin M, Bu G. J Neurosci. 2000;20:542–549. doi: 10.1523/JNEUROSCI.20-02-00542.2000. [DOI] [PMC free article] [PubMed] [Google Scholar]
- 26.Holtzman D M, Pitas R E, Kilbridge J, Nathan B, Mahley R W, Bu G, Schwartz A L. Proc Natl Acad Sci USA. 1995;92:9480–9484. doi: 10.1073/pnas.92.21.9480. [DOI] [PMC free article] [PubMed] [Google Scholar]
- 27.Ishii M, Osada T, Gliemann J, Ikai A. Brain Res. 1996;737:269–274. doi: 10.1016/0006-8993(96)00741-x. [DOI] [PubMed] [Google Scholar]
- 28.Mori T, Miyamoto Y, Iijima N, Kitabatake K, Kohsaka S. Brain Res. 1991;567:355–357. doi: 10.1016/0006-8993(91)90820-l. [DOI] [PubMed] [Google Scholar]
- 29.Postuma R B, Martins R N, Cappai R, Beyreuther K, Masters C L, Strickland D K, Mok S S, Small D H. FEBS Lett. 1998;428:13–16. doi: 10.1016/s0014-5793(98)00475-x. [DOI] [PubMed] [Google Scholar]
- 30.Trommsdorff M, Gotthardt M, Hiesberger T, Shelton J, Stockinger W, Nimpf J, Hammer R E, Richardson J A, Herz J. Cell. 1999;97:689–701. doi: 10.1016/s0092-8674(00)80782-5. [DOI] [PubMed] [Google Scholar]
- 31.D'Arcangelo G, Homayouni R, Keshvara L, Rice D S, Sheldon M, Curran T. Neuron. 1999;24:471–479. doi: 10.1016/s0896-6273(00)80860-0. [DOI] [PubMed] [Google Scholar]
- 32.Christie R H, Chung H, Rebeck G W, Strickland D, Hyman B T. J Neuropathol Exp Neurol. 1996;55:491–498. doi: 10.1097/00005072-199604000-00012. [DOI] [PubMed] [Google Scholar]
- 33.Clatworthy A E, Stockinger W, Christie R H, Schneider W J, Nimpf J, Hyman B T, Rebeck G W. Neuroscience. 1999;90:903–911. doi: 10.1016/s0306-4522(98)00489-8. [DOI] [PubMed] [Google Scholar]
- 34.Kounnas M Z, Moir R D, Rebeck G W, Bush A I, Argraves W S, Tanzi R E, Hyman B T, Strickland D K. Cell. 1995;82:331–340. doi: 10.1016/0092-8674(95)90320-8. [DOI] [PubMed] [Google Scholar]
- 35.Jordan J, Galindo M F, Miller R J, Reardon C A, Getz G S, LaDu M J. J Neurosci. 1998;18:195–204. doi: 10.1523/JNEUROSCI.18-01-00195.1998. [DOI] [PMC free article] [PubMed] [Google Scholar]
- 36.Narita M, Holtzman D M, Schwartz A L, Bu G. J Neurochem. 1997;69:1904–1911. doi: 10.1046/j.1471-4159.1997.69051904.x. [DOI] [PubMed] [Google Scholar]
- 37.Hyman B T, Strickland D K, Rebeck G W. Arch Neurol. 2000;57:646–650. doi: 10.1001/archneur.57.5.646. [DOI] [PubMed] [Google Scholar]
- 38.Trommsdorff M, Borg J P, Margolis B, Herz J. J Biol Chem. 1998;273:33556–33560. doi: 10.1074/jbc.273.50.33556. [DOI] [PubMed] [Google Scholar]
