Prognostic factors for survival of patients with glioblastoma: Recursive partitioning analysis (original) (raw)
Abstract
Survival for patients with glioblastoma multiforme is short, and current treatments provide limited benefit. Therefore, there is interest in conducting phase 2 trials of experimental treatments in newly diagnosed patients. However, this requires historical data with which to compare the experimental therapies. Knowledge of prognostic markers would also allow stratification into risk groups for phase 3 randomized trials. In this retrospective study of 832 glioblastoma multiforme patients enrolled into prospective clinical trials at the time of initial diagnosis, we evaluated several potential prognostic markers for survival to establish risk groups. Analyses were done using both Cox proportional hazards modeling and recursive partitioning analyses. Initially, patients from 8 clinical trials, 6 of which included adjuvant chemotherapy, were included. Subsequent analyses excluded trials with interstitial brachytherapy, and finally included only nonbrachytherapy trials with planned adjuvant chemotherapy. The initial analysis defined 4 risk groups. The 2 lower risk groups included patients under the age of 40, the lowest risk group being young patients with tumor in the frontal lobe only. An intermediate-risk group included patients with Karnofsky performance status (KPS) >70, subtotal or total resection, and age between 40 and 65. The highest risk group included all patients over 65 and patients between 40 and 65 with either KPS < 80 or biopsy only. Subgroup analyses indicated that inclusion of adjuvant chemotherapy provides an increase in survival, although that improvement tends to be minimal for patients over age 65, for patients over age 40 with KPS less than 80, and for those treated with brachytherapy.
Survival for patients with glioblastoma multiforme (GBM)3 is short. Because of the poor prognosis with existing treatments, there has been an interest in developing phase 2 protocols for experimental therapies used at the time of initial diagnosis. To do this, one needs to have a thorough understanding of the prognostic factors affecting survival and a mechanism for adjusting for these factors so that historical data can be used in the evaluation of new therapies. An understanding of these factors will help to ensure appropriate selection of treatments for phase 3 trials and will also be useful in selecting stratification variables for randomization and analysis in these phase 3 trials.
Historically, the primary method of identifying prognostic factors has been through the use of the Cox proportional hazards model; however, there are a number of limitations to this approach as it is standardly implemented. First, it requires that the assumptions of the model are at least approximately met. In particular, the proportional hazards model assumes that the impact of the change in one factor on predicted survival is not dependent on the status of another factor. The standard implementation also requires that the information on all variables of interest be complete for a patient’s data to be included. Finally, although the proportional hazards model provides information on relative risk based on patient characteristics, it does not immediately translate into defined risk groups and, to be most useful as a tool in evaluating the efficacy of new therapies, the actual patient data from the historical database should be available for direct comparison to the data from the patients receiving the experimental treatment.
While many of the limitations of the proportional hazards model can be addressed by modifications of the standard methodology and additional programming, increased availability of high-speed computing has led to extensive use of an alternative approach to identifying prognostic factors—the use of recursive partitioning analysis (RPA; Keles and Segal, 2002; Schmoor et al., 1993). This method makes fewer modeling assumptions and has an established procedure to adapt to missing data through use of surrogate measures. Also, because the method is designed to divide patients into groups based on length of survival, it produces natural strata for future phase 2 comparisons or for stratification in randomization for phase 3 trials. The Radiation Therapy Oncology Group (RTOG) presented results from an RPA based on all patients with high-grade gliomas (astrocytomas with anaplastic features as well as GBM) treated during their trials (Curran et al., 1993). We wished to reproduce these results, but to focus specifically on patients with GBM. Since our interest was in predicting survival outcome for patients who would be likely to enroll in clinical trials, we reviewed our database for patients who were placed on clinical protocols at the time of an initial diagnosis of GBM.
Methods
This study was approved by the University of California San Francisco (UCSF) Committee on Human Research. Eight hundred thirty-two GBM patients (including 1 patient with gliosarcoma) who were enrolled in 1 of 8 clinical protocols were identified. Patients with optic, cerebellar, pineal, or brain stem tumors were not included. In more than 97% of cases, determination that the tumor was a GBM was based on central pathology review at UCSF. Recent studies have used WHO II criteria. For the earlier studies, the UCSF system differed from the standard criteria, in that UCSF pathologists did not require necrosis in order to declare the tumor to be glioblastoma. In that regard, the UCSF designation was effectively equivalent to the current WHO II criteria. Trials and key characteristics are provided in Table 1, including the number of patients and the number censored. These trials represent a combination of single-institution (UCSF) and multi-institution trials. The multi-institution trials were led by UCSF and run through the Northern California Oncology Group, a regional clinical-trials consortium sponsored by the National Cancer Institute. All protocols included provision for external-beam radiotherapy. In addition, some of these studies planned to include a temporary radioactive seed boost and/or adjuvant chemotherapy. Following the concept of intent-to-treat, treatment allocation (e.g., brachytherapy or no brachytherapy, chemotherapy or no chemotherapy) was based on the protocol in which the patient was enrolled and not on the treatment that the patient actually received. Survival was measured from the time of surgical diagnosis. All patients were enrolled prior to external-beam radiotherapy.
Table 1.
Characteristics of the clinical trials used in analysis
| Protocol | Number of patients | Number censored | Radiation dose and schedule | Adjuvant chemotherapy | Enrollment period |
|---|---|---|---|---|---|
| 6G901 | 223 | 2 | 60 Gy at 1.8- to 2.0-Gy fractions vs. 70.4 Gy at 1.6-Gy BID fractions ± difluoromethylornithine | none | 1991–1996 |
| BTRC 9901 | 67 | 21 | 60 Gy at 2.0-Gy fractions | temozolomide + thalidomide | 2000–2001 |
| 6G61* | 59 | 3 | 60 Gy + hydroxyurea | BCNU vs. PCV | 1975–1981 |
| 6G91* | 70 | 5 | 60 Gy + hydroxyurea + misonidazole | procarbazine, vincristine, BCNU, 5FU | 1979–1983 |
| 6G902 | 111 | 6 | 59.4 Gy at 1.8-Gy fractions + hydroxyurea followed by interstitial boost ± hyperthermia | none | 1990–1995 |
| 6G82-2 | 61 | 4 | 60 Gy at 1.8- to 2.0-Gy fractions + hydroxyurea + interstitial boost | PCV | 1982–1990 |
| 8822 | 141 | 12 | 60 Gy at 1.8- to 2.0-Gy fractions + HU | 6-thioguanine, BCNU | 1988–1991 |
| 6G82-1* | 100 | 6 | 60 Gy at 1.8- to 2.0-Gy fractions + bromodeoxyuridine | PCV | 1982–1988 |
Variables selected for consideration were those that were consistently acquired during these trials: specifically, age at diagnosis, race (Caucasian vs. other), Karnofsky performance status (KPS), gender, and anatomical site. Anatomical site was defined as frontal, temporal, parietal, or “other.” If tumor was present that extended beyond a single site, anatomical site was included in the “other” category. Also included in “other” were cases where the tumor was in the corpus callosum or thalamus and tumors that were occipital. Treatment variables were extent of resection, whether or not the protocol included brachytherapy, and whether or not it included adjuvant chemotherapy. Extent of resection was scored as 1, 2, or 3, respectively, according to whether the surgery was a biopsy (less than 10% resected), subtotal (10% to 90% resected), or total resection (greater than 90% resected) on the basis of the surgeon’s intraoperative impression in conjunction with examination of postoperative images. The definition was standard for all protocols included in this report. For patients who underwent surgery at UCSF, the standard was to obtain the postoperative magnetic resonance images within 72 h of surgery. For all patients seen at UCSF, the UCSF neuro-oncology group defined the extent of resection, whether or not the surgery was done at UCSF. Cases classified by the surgeon as “gross total” in which the postoperative scan was felt to show less than 90% resection were reclassified as “subtotal.”
Statistical Methods
Comparison of patient characteristics among treatment groups was done by using the Wilcoxon test for variables that were either continuous or ordered categorical (e.g., extent of resection). Age was analyzed as a continuous variable. Variables that did not have any inherent ordering were tested by using a general test for association.
Initially, we evaluated the potential prognostic factors following the standard method of Cox proportional hazards modeling using backwards stepwise selection. Because of the number of variables considered, we chose to include variables in the final model only if the results were statistically significant at P < 0.01. Our second analysis approach used RPA as described by Breiman et al. (1984). The program was constrained to have a minimum final node size of 30 patients. Tenfold cross-validation was used. The minimum-size model within 0.1 standard error of the overall minimum cost tree was selected for review. To allow for censoring we used the method of martingale residuals described by Therneau et al. (1990). Once RPA selected the tree, we confirmed that the log-rank test met our criterion of P < 0.01 for each of the splits identified. Any split that did not meet this criterion was deleted. The final nodes were then compared. Final nodes that did not meet the criterion of P < 0.01 using the log-rank test were combined. Kaplan-Meier graphs are presented for the final set of prognostic groups.
Results
The baseline characteristics of the patient groups are provided in Table 2. _P_-values are provided to indicate where patient characteristics may differ between treatment groups. It was anticipated that there would be some differences between the patients enrolled in brachytherapy protocols and patients enrolled in nonbrachytherapy protocols, and this was confirmed. KPS tended to be higher, the extent of resection tended to be greater, and fewer patients had a frontal tumor site in the brachytherapy studies. Among those in nonbrachytherapy trials, patients in chemotherapy trials tended to be younger and to have more extensive resections, and fewer had frontal lobe–only tumors than for the protocols with no chemotherapy. In interpreting the results, it must be kept in mind that because the number of patients in the brachytherapy trials was smaller, the _P_-values would be higher than for the nonbrachytherapy comparisons, even if the difference between chemotherapy and nonchemotherapy studies was the same. While the differences between chemotherapy and nonchemotherapy trials in terms of age and tumor site were statistically significant for the nonbrachytherapy studies and not significant for the brachytherapy studies, the pattern of the differences seems to be the same. For example, in both cases, nonchemotherapy trials tended to include proportionately more patients over the age of 65. On the other hand, the patients in the nonchemotherapy trials that included brachytherapy were more likely to have had extensive resections, the opposite from the non-brachytherapy trials. All variables presented in Table 2 were considered potential predictors of survival. Age at diagnosis was initially considered as a continuous variable and then categorized for the purposes of the RPAs as described below.
Table 2.
Baseline characteristics of patient groups
| No brachytherapy | Brachytherapy | |||||||
|---|---|---|---|---|---|---|---|---|
| Characteristic | Total no. (%) | Chemo no. (%) | No chemo no. (%) | Total no. (%) | Chemo no. (%) | No chemo no. (%) | P -value (a, b, c)* | |
| Age at diagnosis | Age <30 | 26 ( 4) | 21 (4.8) | 5 (2.2) | 10 (6) | 4 (6.6) | 6 (5.4) | (a) 0.35 |
| 30 ≤age ≤40 | 85 (13) | 59 (13.5) | 26 (11.7) | 13 (8) | 6 (9.8) | 7 (6.3) | (b) <0.001 | |
| 40 <age ≤50 | 136 (21) | 96 (22.0) | 40 (17.9) | 43 (25) | 15 (24.6) | 28 (25.2) | (c) 0.28 | |
| 50 <age ≤60 | 181 (27) | 126 (28.8) | 55 (24.7) | 54 (31) | 19 (31.2) | 35 (31.5) | ||
| 60 <age <65 | 99 (15) | 65 (14.9) | 34 (15.3) | 27 (16) | 12 (19.7) | 15 (13.5) | ||
| Age ≥65 | 133 (20) | 70 (16.0) | 63 (28.2) | 25 (15) | 5 (8.2) | 20 (18.0) | ||
| KPS | 60 | 28 (5) | 15 (3.8) | 13 (5.8) | 0 | 0 | 0 | (a) <0.001 |
| 70 | 78 (13) | 51 (12.8) | 27 (12.1) | 11 (7) | 5 (10.6) | 6 (5.4) | (b) 0.43 | |
| 80 | 137 (22) | 88 (22.1) | 49 (22.0) | 21 (13) | 8 (17.0) | 13 (11.7) | (c) 0.18 | |
| 90 | 280 (45) | 194 (48.6) | 86 (38.6) | 79 (50) | 22 (46.8) | 57 (51.4) | ||
| 100 | 99 (16) | 51 (12.8) | 48 (21.5) | 47 (30) | 12 (25.5) | 35 (31.5) | ||
| Gender | Female | 249 (38) | 161 (36.8) | 88 (39.5) | 62 (36) | 25 (41.0) | 37 (33.3) | (a) 0.68 (b) 0.53 |
| Male | 411 (62) | 276 (63.2) | 135 (60.5) | 110 (64) | 36 (59.0) | 74 (66.7) | (c) 0.32 | |
| Race | White | 557 (92) | 393 (93) | 164 (88.1) | 126 (91) | 48 (94.1) | 78 (88.6) | (a) 0.71 |
| Other | 51 (8) | 29 (6.9) | 22 (11.9) | 13 (9) | 3 (5.9) | 10 (11.4) | (b) 0.04 (c) 0.29 | |
| Extent of resection | B | 101 (15) | 46 (10.6) | 55 (24.6) | 12 (7) | 5 (8.2) | 7 (6.3) | (a, b) <0.001 |
| STR | 469 (71) | 322 (74.4) | 147 (65.9) | 110 (64) | 46 (75.4) | 64 (57.7 | (c) 0.01 | |
| GTR | 86 (13) | 65 (15.0) | 21 (9.4) | 50 (29) | 10 (16.4) | 40 (36.0) | ||
| Tumor site | Frontal | 193 (29) | 135 (30.9) | 58 (26.0) | 37 (22) | 16 (26.2) | 21 (18.9) | (a) 0.04 |
| Parietal | 147 (22) | 106 (24.3) | 41 (18.4) | 55 (32) | 21 (34.4) | 34 (30.6) | (b) 0.05 | |
| Temporal | 153 (23) | 98 (22.4) | 55 (24.7) | 40 (23) | 12 (19.7) | 28 (25.2) | (c) 0.53 | |
| Other | 167 (25) | 98 (22.4) | 69 (30.9) | 40 (23) | 12 (19.7) | 28 (25.2) |
Predictors of Survival (Overall Analysis)
Cox proportional hazards results are presented in Table 3. Only variables statistically significant at P < 0.01 are presented. Younger age at diagnosis, higher KPS, adjuvant chemotherapy, use of brachytherapy, and greater extent of resection all predicted for improved survival. Because of missing data on one or more of the predictors, only 776 patients were included in this analysis.
Table 3.
Multivariate Cox proportional hazards results. All protocols (776 patients)
| Variable | Hazard ratio | 95% CI | P value |
|---|---|---|---|
| Chemotherapy (Y) | 0.60 | 0.52–0.71 | <0.001 |
| Extent of resection | 0.75 | 0.65–0.86 | <0.001 |
| KPS | 0.97 | 0.96–0.98 | <0.001 |
| Age at diagnosis (years) | 1.03 | 1.02–1.04 | <0.001 |
| Brachytherapy (Y) | 0.73 | 0.60–0.89 | 0.002 |
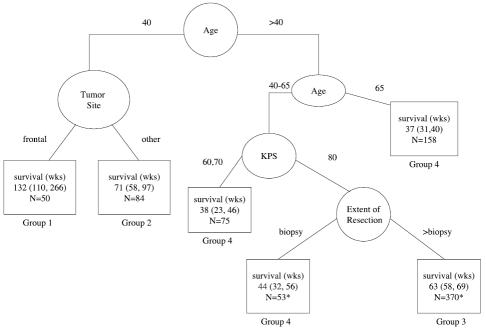
The results of the RPA are presented in Fig. 1. Eight hundred thirty-two patients were included in this analysis. Initially, when we used age at diagnosis as a continuous variable, the patients were split by a diagnosis age of 41.6 and then divided on the basis of the ages of 65.9 and 29.6. Based on these splits, we created an ordered age category that was age <30, age 30 to 40 inclusive, age 40 to 50, age 50 to 60, age 60 to 65, and age ≥65, adding extra categories to more evenly balance the number of patients per category. With these categories, both the ≤40 and ≥65 age categories were retained. The under 30 category was no longer selected. One reason may have been that there were only 31 patients in this category. Since it was felt that the use of the categories was more logical, and the results were similar, all RPAs presented are based on this age categorization.
Fig. 1.
Recursive partitioning analysis for all patients (N = 832). For terminal nodes (□), median survival and the 95% confidence interval for the median are given. N = number of patients. Estimates with an asterisk (*) exclude 40 patients missing KPS and 2 patients missing extent of resection.
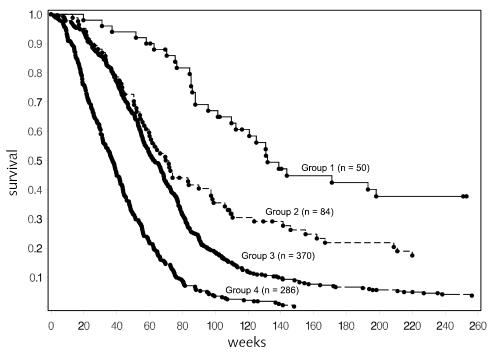
As would have been predicted from the proportional hazards model, age at diagnosis, KPS, and extent of surgery were among the factors selected to divide the patient population. The group of youngest patients (age ≤40) had the best outcome. Interestingly, within this relatively small group, a further split occurred into those who had frontal-only tumors versus all others. Five hundred forty patients were between the ages of 40 and 65. For the patients in this group, KPS of ≤70 indicated a poorer prognosis, and among those with KPS >70, biopsy-only indicated a poorer prognosis. The outcomes for these 2 groups were similar to those for the group of patients who were ≥65 years old. Thus 4 groups were ultimately defined, and the Kaplan-Meier curves for these 4 groups are provided in Fig. 2. The median survival and 95% CI were 132 weeks (110–226), 71 weeks (60–97), 63 weeks (58–69), and 37 weeks (32–42) for the low-risk, low-moderate-risk, moderate-high-risk, and high-risk groups, respectively. The estimated 2-year survival rates were 65%, 35%, 17%, and 4%, respectively. These results are summarized in Table 4.
Fig. 2.
Survival for all patients, by risk group. Fourteen patients in group 1, 12 patients in group 2, and 9 patients in group 3 lived beyond 5 years (260 weeks). Individual survival times (including those for patients who are censored) are indicated by a solid circle (•). Fifty-three patients were censored (13 in group 1, 14 in group 2, 21 in group 3, and 5 in group 4). Additional detail is given in Table 4.
Table 4.
Risk-group splits, results of RPA analysis including all protocols
| Category | Number of patients/number of events | Median survival in weeks (95% CI) | 2-Year survival estimate |
|---|---|---|---|
| Group 1: Low risk (age ≤40, frontal tumor) | 50/37 | 132 (110–226) | 65% |
| Group 2: Low-moderate risk (age ≤40, other tumor sites) | 84/70 | 71 (60–97) | 35% |
| 2 lower-risk groups combined | 134/107 | 97 (77–121) | 46% |
| Group 3: Moderate-high risk (40 < age < 65, KPS >70, and STR or GTR) | 370/349 | 63 (58–69) | 17% |
| Group 4: High risk (age ≥65 or 40 < age < 65 and KPS <80 or 40 < age < 65, KPS >70, and biopsy only) | 286/281 | 37 (32–42) | 4% |
Impact of Postoperative Therapy
It is of note that the nature of the planned postoperative treatment did not appear in the RPA, even though both chemotherapy and brachytherapy were highly statistically significant in the Cox proportional hazards model where adjustments were made for patient characteristics. We therefore divided the patients on the basis of the protocols to see if we could more fully understand the impact of the planned treatment regimens.
Nonbrachytherapy Trials
Initially we considered the 660 patients who were on nonbrachytherapy trials. The proportional hazards results are presented in Table 5. Age at diagnosis, chemotherapy, extent of resection, and KPS continued to be highly statistically significant. The hazard ratio estimates were similar to those for the overall analysis, which is not surprising given that this group constitutes the majority of the cases.
Table 5.
Multivariate Cox proportional hazards results. Nonbrachytherapy protocols (618 patients)
| Variable | Hazard ratio | 95% CI | P -value |
|---|---|---|---|
| Chemotherapy (Y) | 0.58 | 0.48–0.69 | <0.001 |
| Extent of resection | 0.69 | 0.59–0.81 | <0.001 |
| KPS | 0.97 | 0.96–0.98 | <0.001 |
| Age at diagnosis (years) | 1.03 | 1.02–1.04 | <0.001 |
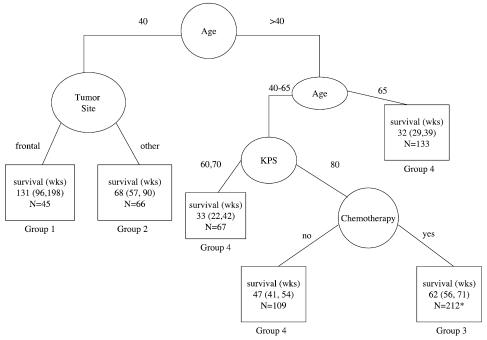
The RPA analysis was also similar (Fig. 3). Comparison of Fig. 1 and Fig. 3 reveals that the only difference is the split criterion for good-KPS patients between ages 40 and 65. Whereas previously the split for this group was based on extent of resection, in this analysis it was based on whether or not the protocol included chemotherapy. On review of the overall RPA analysis, we found that if one more split had been included, it would have been for this group (middle age, good KPS), excluding the biopsy-only patients, and would have been based on whether or not the patients received chemotherapy. Therefore, the results of the 2 analyses are not inconsistent.
Fig. 3.
Recursive partitioning analysis for all patients on non-brachytherapy protocols (n = 660). For terminal nodes (□), median survival and the 95% confidence interval for the median are given. N = number of patients. *Twenty-eight patients without KPS were excluded from the estimates.
It seemed unlikely that the inclusion of adjuvant chemotherapy would impact the outcome for patients between the ages of 40 and 65 and not be of benefit for those younger than 40. On further exploration of the regression tree algorithm, it was found that chemotherapy was a very close competitor for anatomic site as a split for the younger patients within the group of patients on nonbrachytherapy trials. In fact, if the 111 patients under 40 were split according to chemotherapy protocol (Y/N), median survival was 60 weeks (CI, 37–76) and 110 weeks (CI, 86–141) for nonchemotherapy protocols and chemotherapy protocols, respectively. This is in contrast to the patients over 65, where the median survival was 32 weeks for both chemotherapy protocols and nonchemotherapy protocols.
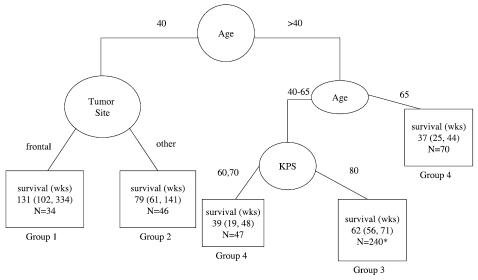
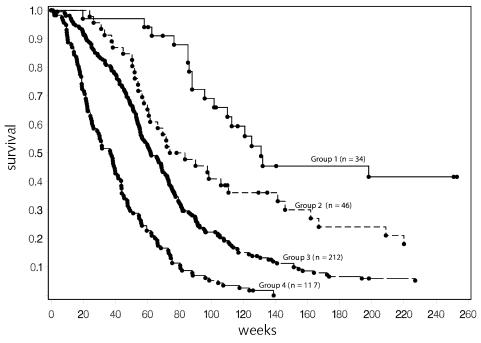
One major purpose of this analysis was to identify stratification variables for planning future studies. For this purpose, it was useful to consider only patients on trials including adjuvant chemotherapy. This also provided a group of patients who could be considered to have been on equivalent postoperative therapy. Figure 4 is the result of this analysis of 437 patients on non-brachytherapy trials who received adjuvant chemotherapy. The resulting tree cut points are similar to the overall tree, although the estimated median survival is slightly better for those groups that previously included some patients who were not on adjuvant chemotherapy protocols. With the smaller number of patients, the split on anatomical site in the younger patient group no longer met the criterion of P < 0.01 based on the log-rank test. However, it did meet the other RPA criteria and is included in the figures for comparison purposes. The resulting survival curves with this split are presented in Fig. 5, and the summary survival estimates are provided in Table 6.
Fig. 4.
Recursive partitioning analysis for all patients on non-brachytherapy protocols that included adjuvant chemotherapy (n = 437). For terminal nodes (□), median survival and the 95% confidence interval for the median are given. N = number of patients. *Twenty-eight patients with missing KPS were excluded from the estimates.
Fig. 5.
Survival for patients on nonbrachytherapy protocols that included adjuvant chemotherapy. Nine patients in group 1, 6 patients in group 2, and 7 patients in group 3 survived beyond 5 years (260 weeks). Individual survival times (including those for patients that are censored) are indicated by a solid circle (•). Forty-four patients were censored (12 in group 1, 8 in group 2, 21 in group 3, and 3 in group 4). Additional detail is given in Table 6.
Table 6.
Risk-group splits, results of RPA analysis including nonbrachytherapy protocols with adjuvant chemotherapy
| Category | Number of patients / number of events | Median survival in weeks (95% CI) | 2-Year survival estimate |
|---|---|---|---|
| Group 1: Low risk (age ≤40, frontal tumor) | 34/22 | 131 (102–334) | 66% |
| Group 2: Low-moderate risk (age ≤40, other tumor sites) | 46/38 | 79 (61–141) | 41% |
| 2 lower risk groups combined | 80/60 | 110 (86–141) | 51% |
| Group 3: Moderate-high risk (40 < age < 65, KPS >70) | 212/191 | 62 (56–71) | 21% |
| Group 4: High risk (age ≥65 or 40 < age < 65 and KPS <80) | 117/114 | 37 (26–44) | 5% |
Brachytherapy Trials
Initially, we analyzed the data using the Cox proportional hazards model with the variables identified in the overall Cox proportional hazards model (Table 7). Again, KPS and age at diagnosis were clearly important. The importance of chemotherapy and extent of surgery was less clear. While some increase in _P_-value would be expected because of the smaller sample size, the hazard ratio estimates give no indication of benefit from increased resection or addition of adjuvant chemotherapy in the setting of brachytherapy.
Table 7.
Multivariate Cox proportional hazards model. Brachytherapy protocols (158 patients)
| Variable | Hazard ratio | 95% CI | P value |
|---|---|---|---|
| Chemotherapy (Y) | 0.93 | 0.65–1.3 | 0.69 |
| Extent of resection | 1.05 | 0.78–1.42 | 0.74 |
| KPS | 0.97 | 0.95–0.99 | 0.004 |
| Age at diagnosis (years) | 1.04 | 1.03–1.06 | <0.001 |
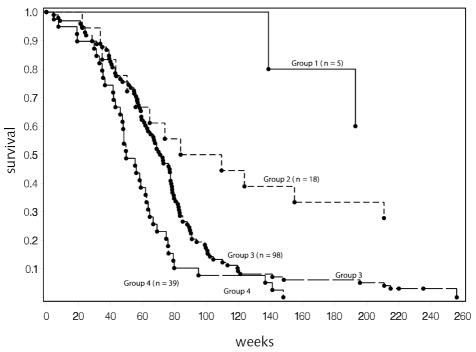
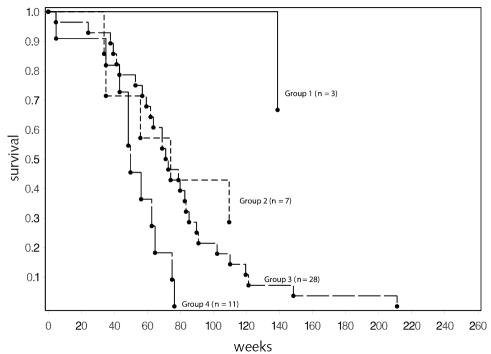
The number of patients on brachytherapy trials was too small to complete an independent RPA. However, we did assign patients from these protocols to groups based on the risk assignments from the overall RPA analysis to confirm that the results were consistent. Figure 6 provides the Kaplan-Meier curves that resulted for all patients on these trials, and Fig. 7 includes only those on chemotherapy trials. On the basis of Fig. 6, it would appear that the strata selected provide a meaningful grouping of patients in this new data set, although the number in the lowest risk group is small. The similarity in the curves comparing outcome in all patients and in the chemotherapy-only group is consistent with the assessment that chemotherapy has a smaller role to play when brachytherapy is given.
Fig. 6.
Survival for all patients on brachytherapy protocols (n = 160). Risk groups are as defined in Table 4 for all patients. Three patients in group 1 and 5 patients in group 2 lived beyond 5 years (260 weeks). Individual survival times (including those for patients that are censored) are indicated by a solid circle (•). Eight patients were censored (1 in group 1, 5 in group 2, 2 in group 3, and 0 in group 4).
Fig. 7.
Survival for patients on brachytherapy protocols that included adjuvant chemotherapy (n = 49). Risk groups are as defined for all patients in Table 4. Two patients in group 1 and 2 patients in group 2 lived beyond 5 years (260 weeks). Individual survival times (including those for patients that are censored) are indicated by a solid circle (•). Two patients were censored (both in group 2).
Anatomic Site as a Predictor in Younger Patients
The finding that age, KPS, and adjuvant chemotherapy predicted survival was expected. The finding of the anatomic site of tumor as a predictor was not. We therefore evaluated this further using Cox proportional hazards models. When analyses included all ages, there was some trend toward improved survival among those with frontal-only tumors, but the results were never statistically significant at the 0.05 level. However, when the patient group was limited to those ≤40 years old at the time of diagnosis, the results were statistically significant. The results of this analysis for all patients ≤40 are provided in Table 8. Initially, we hypothesized that tumor site might be a surrogate for extent of resection. However, the Cox proportional hazards model indicates that the association with location is much stronger than any association with extent of resection. On review of the data, few of these younger patients had biopsy only (11% of cases), and 73% of those with frontal tumors had a subtotal resection compared to between 68% and 73% in the remaining three groups. Thus, the lack of association with extent of resection is likely due to the high proportion of patients with subtotal resections, limiting the ability to detect impact of resection, and the association of frontal-only tumors compared with other locations remains to be confirmed and explained with further studies.
Table 8.
Multivariate Cox proportional hazards model including anatomic site and other variables as predictors. Patient age ≤ 40 (124 patients)
| Variable | Hazard ratio | 95% CI | P -value |
|---|---|---|---|
| Chemotherapy (Y) | 0.44 | 0.28–0.69 | <0.001 |
| Extent of resection | 0.80 | 0.54–1.20 | 0.28 |
| KPS | 0.96 | 0.94–0.98 | <0.001 |
| Age at diagnosis (years) | 1.05 | 1.01–1.10 | 0.027 |
| Brachytherapy | 0.50 | 0.27–0.92 | 0.025 |
| Frontal-only tumor | 0.53 | 0.34–0.83 | 0.005 |
Discussion
A difference in survival among patients with GBM has been consistently seen to depend on age and KPS. Although individual studies have generally not shown improved survival with the use of adjuvant chemotherapy, meta-analyses have observed improvement in survival with adjuvant chemotherapy (GMT, 2002). The roles of extent of resection and use of brachytherapy are less certain. Two randomized trials of brachytherapy did not show an improvement in outcome (Laperriere et al., 1998; Selker et al., 2002). In the case of extent of resection, this variable is highly dependent on resectability and, therefore, difficult to assess.
Prior to this study, investigators have relied on the RTOG RPA to identify risk groups when planning and evaluating treatment regimens for patients with newly diagnosed GBM in phase 2 single-arm studies. This study differs in a number of respects from that study. This study included only patients with GBM, while the RTOG study was open to patients with any high-grade glioma. Clearly, the inclusion of only GBM patients has affected some of the splits in the RPA. This study focused on protocols led by clinicians at UCSF, although some were open to patient entry at multiple institutions. The studies reported here had a smaller portion of patients with low KPS, which will also affect splits. The RTOG study did have the advantage of some additional variables that were not routinely collected on these trials and so could not be studied as possible predictors.
Recursive partitioning is an exploratory tool that has found favor in recent years because it provides a method of categorizing patients into risk groups. However, the technique has limitations. It is an exploratory tool with the possibility of selecting apparently prognostic factors by chance, and no probability statements can be made related to the final splits because all these analyses are post hoc tests. The selection of factors may vary because of small changes in the patient group studied. This can occur if one or more variables are highly correlated. It can also occur if 2 variables have close to the same discrimination ability, which can happen even if the 2 variables are not highly correlated. The choice between chemotherapy and tumor location as the selection criterion among younger patients seen in the analyses reported here is an example of this.
It is also important to recognize that the definition of risk groups does not mean that there is no predictive ability of variables within risk groups. This can be seen in the analysis of the data in the younger patients, where several factors were still predictive even among this good-risk patient group. What the risk groups do is define a limited set of characteristics that are the most meaningful for grouping patients based on prediction of outcome.
More and more, it is being recognized that patients with GBM do not have a homogeneous prognosis. While many of today’s efforts are focused on identifying molecular markers for prognosis and targeting treatments to specific patients, the use of clinical factors to assign risk groups continues to be of importance. In randomized phase 3 trials it is possible to use the actual values in proportional hazards models for the final analyses, but the definition of risk groups provides a practical method of stratifying patients at the time of randomization to ensure reasonable balance among the treatment groups. Most phase 2 trials use historical controls to evaluate whether the therapy is worth studying in a phase 3 trial. Use of actual historical data if available is optimal; however, it is often not available. The identification of risk groups with estimates of the expected outcomes for each provides some level of assurance that results that seem either promising or discouraging are not primarily due to a particular selection bias for that study.
In summary, it may be possible to further refine groupings if more information is available, but the risk groups identified in this study have meaningful differences in estimated survival and should be readily used in a multicenter environment, either at the time of randomization or as a basis for historical comparison.
Conclusions
Based on the analyses reported here, a recommendation for grouping of patients for evaluation of clinical trials involving chemotherapy and standard radiotherapy would appear to be ages ≤40, ages between 40 and 65, and ages ≥65. Within the middle age group, patients should be further split by KPS < 80 versus ≥ 80, with patients with low KPS grouped with the older patients (ages ≥65) for purposes of stratification. For prospective randomized trials, the 3 categories could be the basis for stratified randomization. For single-arm trials, the analysis could take into account the proportion of patients who fit into each of the 3 groups.
The identification of tumor site as a predictor of survival in the youngest patients is a new finding and so is subject to more questions about its usefulness. The number of these patients is likely to be a small subset of those in any trial; however, the observed difference in survival was large. In instances where the protocol is such that it tends to favor selection of younger patients with more circumscribed tumors, this report would indicate that tumor location might need to be considered as a factor in evaluating the results. This would especially be true if our results are confirmed in future studies.
This study is consistent with results seen in meta-analyses indicating that inclusion of adjuvant chemotherapy provides an increase in survival, although that improvement tends to be minimal for patients over age 65, for those over age 40 with a KPS less than 80, and for patients treated with brachytherapy.
Acknowledgment
The authors thank Sharon Reynolds, Department of Neurological Surgery, University of California San Francisco, for editorial support.
Footnotes
1
This study was supported by grants CA13525, NS42927, CA82103, CA097257. This paper is presented on behalf of the University of California San Francisco Brain Tumor Research Center (BTRC) and is based on clinical trials that depended on leadership from a number of individuals within the BTRC.
3
Abbreviations used are as follows: GBM, glioblastoma multiforme; KPS, Karnofsky performance status; RTOG, Radiation Therapy Oncology Group; RPA, recursive partitioning analysis; UCSF, University of California San Francisco.
References
- Breiman, L., Friedman, J.H., Olshen, R.A., and Stone, C.J. (1984) Classification and Regression Trees Belmont, Calif.: Wadsworth International Group.
- Curran WJ, Jr, Scott CB, Horton J, Nelson JS, Weinstein AS, Fischbach AJ, Chang CH, Rotman M, Asbell SO, Krisch RE, Nelson DF. Recursive partitioning analysis of prognostic factors in three Radiation Therapy Oncology Group malignant glioma trials. J Natl Cancer Inst. 1993;85:704–710. doi: 10.1093/jnci/85.9.704. [DOI] [PubMed] [Google Scholar]
- GMT. Glioma Meta-analysis Trialists (GMT) Group. Chemotherapy in adult high-grade glioma: A systematic review and meta-analysis of individual patient data from 12 randomised trials. Lancet. 2002;359:1011–1018. doi: 10.1016/s0140-6736(02)08091-1. [DOI] [PubMed] [Google Scholar]
- Keles S, Segal MR. Residual-based tree-structured survival analysis. Stat Med. 2002;21:313–326. doi: 10.1002/sim.981. [DOI] [PubMed] [Google Scholar]
- Laperriere NJ, Leung PMK, McKenzie S, Milosevic M, Wong S, Glen J, Pintilie M, Bernstein M. Randomized study of brachytherapy in the initial management of patients with malignant astrocytoma. Int J Radiat Oncol Biol Phys. 1998;41:1005–1011. doi: 10.1016/s0360-3016(98)00159-x. [DOI] [PubMed] [Google Scholar]
- Schmoor C, Ulm K, Schumacher M. Comparison of the Cox model and the regression tree procedure in analysing a randomized clinical trial. Stat Med. 1993;12:2351–2366. doi: 10.1002/sim.4780122411. [DOI] [PubMed] [Google Scholar]
- Selker RG, Shapiro WR, Burger P, Blackwood MS, Deutsch M, Arena VC, Van Gilder JC, Wu J, Malkin MG, Mealey J, Jr, Neal JH, Olson J, Robertson JT, Barnett GH, Bloomfield S, Albright R, Hochberg FH, Hiesiger E, Green S Brain Tumor Cooperative Group. The Brain Tumor Cooperative Group NIH trial 87-01: A randomized comparison of surgery, external radiotherapy, and carmustine versus surgery, interstitial radiotherapy boost, external radiation therapy, and carmustine. Neurosurgery. 2002;51:343–357. [PubMed] [Google Scholar]
- Therneau TM, Grambsch PM, Fleming TR. Martingale-based residuals for survival models. Biometrika. 1990;77:147–160. [Google Scholar]
