Conformational Changes in the Pore of CLC-0 (original) (raw)
Abstract
The Torpedo Cl− channel, CLC-0, is inhibited by clofibric acid derivatives from the intracellular side. We used the slow gate-deficient mutant CLC-0C212S to investigate the mechanism of block by the clofibric acid–derivative p-chlorophenoxy-acetic acid (CPA). CPA blocks open channels with low affinity (KD O= 45 mM at 0 mV) and shows fast dissociation (koff = 490 s−1 at −140 mV). In contrast, the blocker binds to closed channels with higher affinity and with much slower kinetics. This state-dependent block coupled with the voltage dependence of the gating transitions results in a highly voltage-dependent inhibition of macroscopic currents (KD ∼1 mM at −140 mV; KD ∼65 mM at 60 mV). The large difference in CPA affinity of the open and closed state suggests that channel opening involves more than just a local conformational rearrangement. On the other hand, in a recent work (Dutzler, R., E.B. Campbell, and R. MacKinnon. 2003. Science. 300:108–112) it was proposed that the conformational change underlying channel opening is limited to a movement of a single side chain. A prediction of this latter model is that mutations that influence CPA binding to the channel should affect the affinities for an open and closed channel in a similar manner since the general structure of the pore remains largely unchanged. To test this hypothesis we introduced point mutations in four residues (S123, T471, Y512, and K519) that lie close to the intracellular pore mouth or to the putative selectivity filter. Mutation T471S alters CPA binding exclusively to closed channels. Pronounced effects on the open channel block are observed in three other mutants, S123T, Y512A, and K519Q. Together, these results collectively suggest that the structure of the CPA binding site is different in the open and closed state. Finally, replacement of Tyr 512, a residue directly coordinating the central Cl− ion in the crystal structure, with Phe or Ala has very little effect on single channel conductance and selectivity. These observations suggest that channel opening in CLC-0 consists in more than a movement of a side chain and that other parts of the channel and of the selectivity filter are probably involved.
Keywords: CLC, fast gate, double-barreled, chloride channel, clofibric acid
INTRODUCTION
CLC Cl− channels are of prime physiological importance in many organs including muscle, brain, kidney, and bones as demonstrated by various human hereditary diseases in which CLC channels are involved and by the phenotype of CLC knock-out mice (Koch et al., 1992; Lloyd et al., 1996; Simon et al., 1997; Piwon et al., 2000; Bösl et al., 2001; Kornak et al., 2001; Stobrawa et al., 2001). Yet, the biophysical and in particular the pharmacological properties of CLC channels are poorly understood. The muscle channel CLC-1 and its close relative, the prototype Torpedo channel CLC-0, are the best studied members in this respect. Both are dimeric proteins where each subunit forms a separate protopore that gates independently from the neighboring pore (fast gate) (Ludewig et al., 1996; Middleton et al., 1996). These proteins also have a slower gate that acts on both protopores simultaneously with very slow kinetics (slow gate). Both gates are voltage dependent and are strongly dependent on the extra- and intracellular Cl− concentration to the extent that Cl− movement in the pore is believed to underlie most of the voltage dependence of the fast protopore gate (Pusch et al., 1995; Chen and Miller, 1996; for reviews see Maduke et al., 2000; Jentsch et al., 2002). The dimeric, double-barreled appearance of these channels was recently confirmed by the crystal structure of two bacterial CLC-homologues (Dutzler et al., 2002).
The classical inhibitors of the muscle channel CLC-1 include 9-anthracene-carboxylic acid (9-AC) and the more recently studied derivatives of the p-chlorophenoxy-propionic acid (CPP), a substance that was known to reduce the macroscopic skeletal muscle background Cl− conductance (gCl) (Conte-Camerino et al., 1988). The intimate connection between gating and permeation in these channels suggests that any pore blocker will also act as a gating modifier. In other words, binding of the inhibitor will not only impede ion flow but also alter the equilibrium between open and closed pore conformations. Indeed, the effect of CPP on CLC-1 can be described as a “shift” of the conductance-voltage relationship toward more positive voltages (Aromataris et al., 1999; Pusch et al., 2000), suggesting that CPP acts mostly as a gating modifier that stabilizes the closed state of the channel.
CLC-1 has a low single channel conductance (Saviane et al., 1999), complex gating (Accardi and Pusch, 2000), and strong inward rectification, making a detailed investigation of the mechanism of block extremely difficult. CLC-0, with its larger single-channel conductance and slower kinetics, is far more amenable to the study of CPP block. Additionally, mutation C212S locks the slow gate in the open state (Lin et al., 1999), further reducing the complexity of the system. In a previous paper we investigated the block by the CPP derivative p-chlorophenoxy-butyric acid (CPB) (Pusch et al., 2001). Quantitative analysis led us to propose a model in which CPB binds to closed channels with submillimolar affinity, while its affinity for open channels was too low to be reliably estimated. From the macroscopic and single-channel analysis it was, however, impossible to distinguish between a direct pore block and an allosteric mechanism. A strong indication that CPB binds to the pore was provided by a single-point mutation (K519E) that showed measurable open channel block at positive voltages (Pusch et al., 2001).
Here we investigate the block of CLC-0 by the simplest CPP derivative: p-chlorophenoxy-acetic acid (CPA). CPA exerts a low-affinity open channel block and a higher-affinity closed channel binding. We also determine the CPA dissociation constant of closed (KD C) and of open (KD O) pores of CLC-0C212S.
In a recent paper (Dutzler et al., 2003), Mackinnon's group put forth a very intriguing model for gating in CLC channels: the conformational change associated with channel opening is limited to the movement of the side chain of a single residue. They proposed this model based on several observations. In the first crystal structure (Dutzler et al., 2002) the side chain of a highly conserved glutamate, E148 in EcCLC and E166 in CLC-0, occludes the putative permeation pathway. They then crystallized the E148A and the E148Q mutants of EcCLC and found that the mutants have the same structure as the WT save for the position of the side chain in position 148: it moves away from the permeation pathway and the vacant space is filled by a Cl− ion. The corresponding mutations in CLC-0 induce a constitutively open phenotype. The sum of these observations led Dutzler et al. (2003) to propose that gating in CLC channels consists of the movement of the side chain of the glutamate away from the permeation pathway.
In this paper we employ CPA as a tool to test this hypothesis. If the model proposed by Dutzler et al. (2003) was applicable to CLC-0 we would expect that mutations that affect CPA binding do so in a similar manner for channels in the open and closed states as the structure of the intracellular part of the pore is unchanged. To this end we investigated the effect of mutations in four amino acids that either coordinate the central Cl− ion in the crystal structure (Dutzler et al., 2002) or lie close to the permeation pathway. Some of these mutations affect either the open or the closed channel affinity. This suggests that the open conformation of the channel is significantly different from the closed one. Mutating the Cl− coordinating residue, Tyr 512, to either Phe or Ala has little effect on the permeation properties of CLC-0. This lack of effect suggests that the conformational change associated with channel opening might also involve a rearrangement of the selectivity filter.
MATERIALS AND METHODS
Molecular Biology and Oocyte Expression
Throughout this study we used the point mutant C212S of CLC-0. This locks the slow common pore gate in the open configuration with almost no effect on permeation or fast gate properties (Lin et al., 1999). It was expressed in Xenopus oocytes as described (Pusch et al., 2001). All other mutations studied were constructed in the background of C212S. They were generated by recombinant PCR and the fragments generated by the PCR were fully sequenced. The additional mutants include S123T, T471S, Y512A, Y512F, K519E, and K519Q.
Electrophysiology and Solutions
Inside-out patch-clamp experiments were performed using an EPC-7 amplifier (List) and the Pulse program (HEKA). The solutions had the following composition: the standard intracellular solution contained (in mM) 100 NMDG-Cl, 2 MgCl2, 10 HEPES, 2 EGTA at pH 7.3; the standard extracellular solution contained 100 NMDG-Cl, 5 MgCl2, 10 HEPES at pH 7.3. The extracellular solution with 5 mM Cl− contained 100 NMDG-Glutamate, 2.5 MgCl2, 10 HEPES. Liquid junction potentials (<10 mV) were not corrected. Solutions were changed by a local perfusion system consisting of eight tubes of ∼200 μm diameter in which the tip of the patch pipette was inserted.
CPA and all other chemicals were purchased from Sigma-Aldrich. CPA was dissolved in an equimolar amount of NMDG to a concentration of 1 M. This was then added to our solution to a concentration of 50 mM and the pH subsequently readjusted to the desired value (pH 7.3). Different concentrations of blocker were obtained by serial dilutions from this stock solution.
Single Channel Analysis
Single-channel analysis was essentially performed as described by Ludewig et al. (1997b). Briefly, after digital filtering at 500 Hz, amplitude histograms were fitted with the sum of an adequate number of Gaussian functions using custom software. Traces were then automatically idealized using a 50% threshold criterion, the transitions were manually inspected and suspicious events were discarded. For the dwell-time analysis only events >1 ms were used. Dwell time distributions were fitted by a maximum likelihood criterion taking all events into consideration without any binning using custom software.
Determination of Apparent Inhibition Constants (KD)
Apparent steady-state inhibition constants (KD) were obtained from the ratio of currents in the presence of CPA at concentration c, I(c), and the current in the absence of CPA, I(0), as a function of the concentration, c, using the equation
 |
(1) |
|---|
with KD as a free parameter. In all cases the inhibition could be well described by Eq. 1. For voltages ≥20 mV, the estimated KD was larger than the highest CPA concentration used (20 mM). In these cases a good fit of Eq. 1 will not prove a 1:1 binding stoichiometry. It is nevertheless reasonable to assume the validity of Eq. 1 and the error for the estimate of the KD is <20% (see results).
To quantify the open channel block at the single-channel level, relatively long events during which only one pore was active were selected on the basis of a crude idealization process; the events were then inspected manually, and pooled. The mean (baseline subtracted) current amplitude of these events was divided by the protopore current in the absence of CPA and fitted to Eq. 1.
Model Calculations
The kinetic model (Model 1) that was previously established for the block of CLC-0 by CPB was adapted to the block by CPA and parameterized in the following way. Opening and closing rate constants in the absence of CPA, α and β, were determined to fit the steady-state open probability and the gating time constants as described previously (Pusch et al., 2001) and were described analytically by

and

with α0 =180 s−1, zα0 = 0.62, α1= 5.6 s−1, zα1 = −0.16, β0 = 6.8 s−1 and zβ0 = −0.36.
The nonmonotonic voltage dependence of α has been described by Chen and Miller (1996). The increase of both opening and closing rate constants at negative voltages leads to nonzero minimal popen despite a hastening of the gating kinetics (Chen and Miller, 1996).
Binding of CPA was assumed to “stabilize” the open-close equilibrium toward the closed state by a factor H > 1 that we assume to be a constant (i.e., voltage-independent) for simplicity: β′/α′ = H × β/α. In addition, opening and closing transitions of CPA bound states were allowed to be slower compared with drug-free states: β′ = β/Kβ and α′ = α/(H × Kβ), introducing a second parameter, Kβ, that takes into account the altered kinetics of the channel closing with a bound CPA molecule as compared with a CPA-free channel.
In contrast to CPB, we could reliably measure the open channel block of CLC-0C212S by CPA at positive voltages. However, the kinetics of binding and unbinding of CPA to the open state are very fast compared with the gating kinetics. We thus arbitrarily fixed the on rate constant, kon O, to a value of 37 s−1 mM−1 in accordance with a rough spectral analysis (see results) and the voltage dependence of the open channel KD to the value found experimentally (zKD = 0.21). In accordance with our previous model for CPB block, the slight direct voltage dependence of drug binding/unbinding was best implemented by assigning it completely to the off reaction. Thus, kon O = 37 s−1mM−1 and koff O = kon O × KD(0) × exp (zKD × V × F/(RT)), with KD(0) = 45 mM for CLC-0C212S.
The third adjustable parameter was the on rate constant to the closed state, kon C, assumed similarly as for the open state to be independent of voltage. The off rate from the closed state at 0 mV was determined from the principle of microscopic reversibility, koff C(0) = kon C × α′(0) × koff O(0) × β(0)/(α(0) × kon O × β′(0)), and the voltage dependence was assumed to be the same as that for the open state: koff C = koff C(0) × exp (zKD × V × F/(RT). The closed channel KD, KD C = koff C/kon C, is decreased below the open channel, KD O = koff O/kon O, by the same factor H that describes the stabilization of the closed state: KD O/KD C = H.
With these assumptions made, the behavior of the model depends on just three adjustable parameters, H, Kβ, and kon C(0). They were determined by obtaining a reasonable agreement with the macroscopic apparent KD (Fig. 3) and the slow time constant in the presence of 20 mM CPA (Fig. 4 A).
Figure 3.
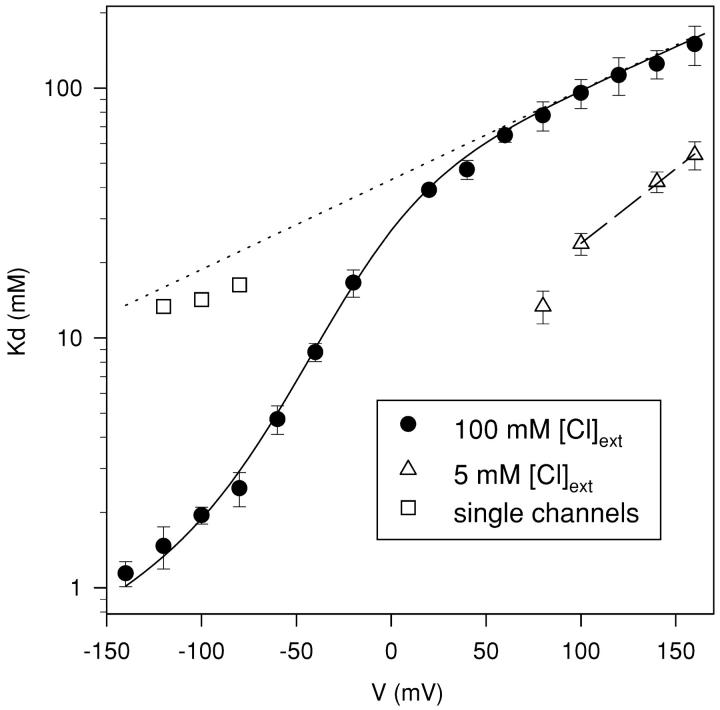
Voltage dependence of CPA block. From the mean values of the ratio of the steady-state current in presence and absence of CPA, I(CPA)/I(0), for CPA concentrations of 1, 5, and 20 mM the apparent dissociation constant, KD, was obtained by a fit with Eq. 1 for voltages ranging from −140 to +140 mV. The resulting KD values are plotted as a function of voltage (filled circles). The open squares are the KD values measured from the open channel block of single channels. The open triangles are the KD values were measured at 5 mM extracellular Cl−. The straight, dotted line represents the extrapolation to voltages between −140 and +160 mV of a fit of the KD values for V > 60 mV measured in high (100 mM) extracellular Cl− with Eq. 2. It has a slope corresponding to an apparent electrical distance of 0.21. The dashed straight line is a similar fit to the values measured with 5 mM extracellular Cl− for V ≥ 100 mV with z = 0.35. The solid line represents the fit of Model 1 with H as a single free parameter (see materials and methods), resulting in H = 20. Error bars are SEM.
Figure 4.
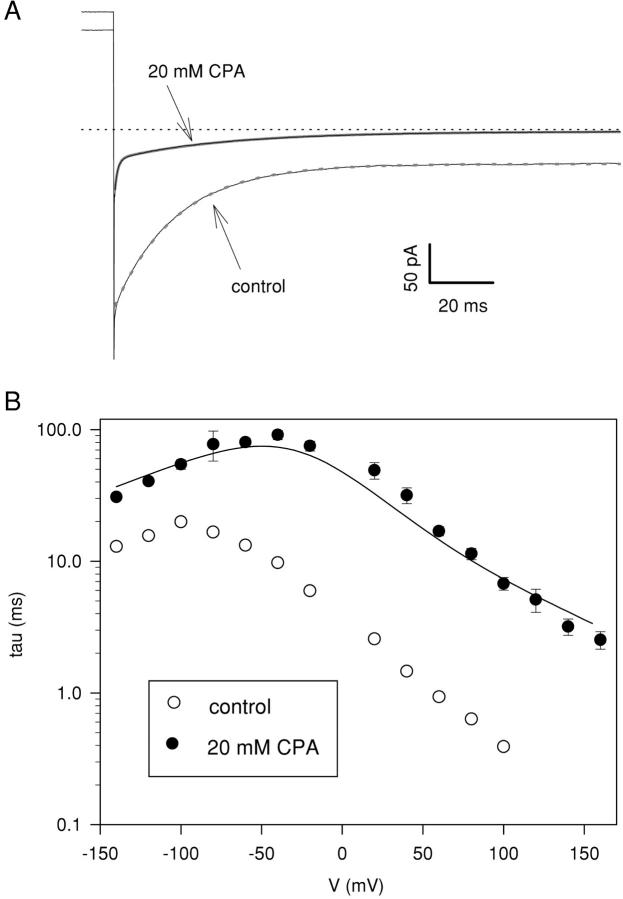
Voltage dependence of the slow time constant measured at 20 mM CPA. (A) Currents recorded immediately after a voltage step to −140 mV from the holding potential of 0 mV without and with 20 mM CPA (see arrows). In control the time course of the deactivating currents is well described with a single exponential function (τ(control) = 19.5 ms, dashed gray line). In the presence of 20 mM CPA the deactivation is described with the sum of two exponentials (thick solid gray line): a very fast one with a time constant <1 ms and a second one whose time constant is slightly slower that recorded in control condition (τf(CPA 20 mM) = 0.9 ms and τs(CPA 20 mM) = 35 ms). The capacitive transients were not subtracted. (B) The slow time constants were measured with protocols similar to those described in Fig. 1. Open circles: control; filled circles: 20 mM CPA. The solid line represents the predictions of Model 1 if the simulated relaxations are fitted with a single exponential function (see materials and methods), considering only the slow relaxations and ignoring the faster relaxation.
Spectral Analysis
Power spectra were calculated as the square of the fourier transformed current signal in steady-state for single-channel and macroscopic recordings. The fast-fourier transform algorithm was used with a window of 8,192 or 16,384 sample points. For macroscopic recordings no background was subtracted, whereas for single-channel spectra the background was calculated from current segments that contained no apparent channel activity in 20 mM CPA, and subtracted. Several power-spectra calculated from different segments were averaged and then binned using a log-binning with a bin-width of 0.02 before display. They were fitted with the sum of one or two Lorentzian functions of the form

with an amplitude, A, and a characteristic frequency, fC, as parameters. The characteristic frequency, fC, is related to an underlying relaxation process that occurs with a time constant, τC, by 2π fC τC = 1.
We used spectral analysis to estimate the rate-constants for the association of CPA to (kon O) and its dissociation from the open state (koff O). For this case fC is given by 2π fC = koff O + [CPA] × kon O. If the open channel, KD O=koff O/kon O, is known, the two individual rate constants can be determined from the latter two equations.
RESULTS
In the present work we were interested in investigating the interactions of CPA with the fast gate of CLC-0 in an attempt to uncover possible conformational changes associated with this process. As a consequence, the characterization of block properties as well as the additional mutations were introduced in the background of the slow gate-deficient mutant C212S (Lin et al., 1999), henceforth referred to as WT.
Block of WT CLC-0 by CPA
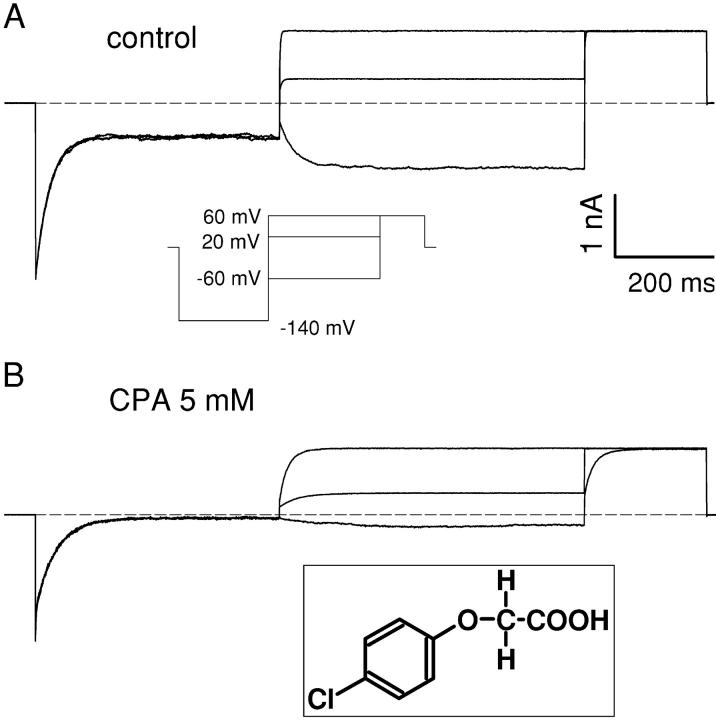
The p-chlorophenoxy-acetic acid, CPA (Fig. 1 B, inset), is the simplest nonchiral derivative of CPB in which the group on the chiral carbon atom is replaced with a simple H atom. Like CPB, CPA is effective only when applied from the intracellular side and the effect is rapidly reversible.
Figure 1.
Effect of intracellular CPA on macroscopic currents of the CLC-0 mutant C212S. (A) Currents recorded from an inside out patch in control conditions with a pulse protocol in which, after a 400-ms pulse to −140 mV, to maximally deactivate the channels, the voltage was varied between Vp = −140 and +60 mV, followed by a constant tail pulse to +60 mV. Only the traces for Vp = +60, +20, and −60 are shown. The inset shows a schematic representation of the pulse protocol. (B) Currents recorded from the same patch in the presence of 5 mM CPA in the intracellular solution. The inset shows the chemical structure of CPA. Scale bars in A apply also to B.
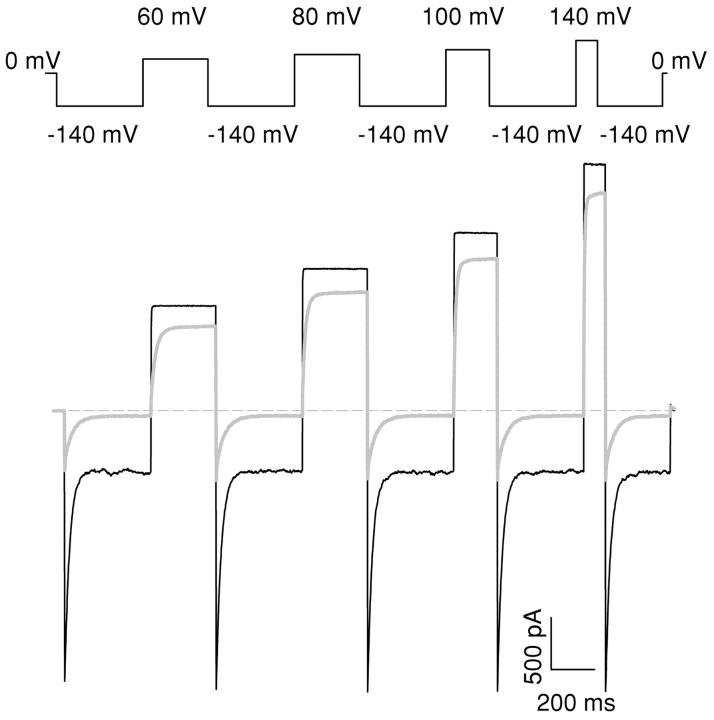
Fig. 1 shows typical currents mediated by WT CLC-0 in the absence (Fig. 1 A) and in the presence of 5 mM CPA (Fig. 1 B) elicited with the pulse protocol shown in the inset (Fig. 1 A). Addition of 5 mM CPA to the intracellular solution induces a more complete deactivation of the currents at −140 mV than that observed in control conditions. This pronounced block is partially relieved when the voltage is stepped to more positive voltages, as evidenced by the slowly activating kinetics that can be observed in Fig. 1 B. Qualitatively, these properties are strongly reminiscent of the characteristics of CPB block of CLC-0 (Pusch et al., 2000) although the apparent KD at −140 mV is 1.1 ± 0.1 mM, indicating a twofold lower affinity than for CPB at this voltage. The two main qualitative differences between the inhibition by CPA and by CPB are the kinetics of block and the open channel affinity measured at positive voltages. While raising the applied potential to V > 40 mV induced a complete unblock from CPB at 5 mM (Pusch et al., 2001), this does not hold true for CPA. Fig. 2 shows CLC-0 currents recorded without (black line) and with 20 mM CPA (gray line) elicited by pulses to the indicated voltages. While current inhibition is much more pronounced at negative than at positive voltages, a substantial block can be observed at positive voltages, even as high as 140 mV. At such large voltages nonspecific endogenous currents might be suspected. However, in noninjected oocytes practically no currents were measured even at voltages as large as 200 mV (unpublished data; see also Accardi and Pusch, 2000). Steady-state inhibition was measured using protocols similar to those shown in Figs. 1 and 2, and the KD was derived as described in materials and methods and is shown in Fig. 3 as a function of voltage (filled circles). At negative voltages the KD is in the low millimolar range, increasing monotonically with the applied voltage. For V > 60 mV the voltage dependence can be well described with an exponential function of the form:
 |
(2) |
|---|
where KD(0) is the (extrapolated) KD at 0 mV, V is the applied potential, and zKD is the slope of the voltage-dependence in that range. The fit was obtained with KD(0) = 45 mM and zKD = 0.21 (Fig. 3, dotted line).
Figure 2.
Open channel block of CPA at positive voltages. Currents recorded with the protocol shown in the top panel in the absence (black line) and in the presence of 20 mM intracellular CPA (gray line). Note the significant inhibition even at +140 mV.
In our evaluation of the KD at high positive voltages we have used CPA concentrations only up to 20 mM, a value much lower than the estimated KDs in that voltage range. This will lead to an error due to the fact that r, the ratio of the current in presence of the drug to the current in control, is close to one in some instances. For example, at 140 mV and 20 mM CPA r = 0.89. From a simple argument it is possible to estimate the error that we are incurring; from Eq. 1 it follows that
 |
(3) |
|---|
where c is the CPA concentration, and thus the relative error of KD is given by:

where Δr is the standard deviation of r. For all data points measured at 20 mM CPA Δr ≤ 0.03, so that ΔKD/KD ≤ 0.2, meaning that the relative error is <20%.
The macroscopic current analysis described above shows that CPA can bind to CLC-0 channels at positive voltages, resulting in a measurable current reduction even for V = 140 mV (Fig. 2). The open probability for CLC-0 channels at such positive voltages is very close to unity, both with and without CPA as estimated by nonstationary noise analysis (unpublished data). It is thus likely that this inhibition reflects an open channel block, rather than a reduction of the open probability through a stabilization of the closed state. Further lines of evidence supporting this idea will be presented in the following paragraphs.
Macroscopic Currents Kinetic Analysis
Gating relaxations of the slow gate-deficient mutant C212S can be described at all investigated voltages by a single exponential (Lin et al., 1999; Lin and Chen, 2000; Chen and Chen, 2001; Pusch et al., 2001) (see Fig. 4 A, thick gray dashed line). The time constants are shown in Fig. 4 B (open circles). In the presence of CPA two exponential relaxations can be seen: a fast component with kinetics faster than 1 ms (at −140 mV) and a much slower one (thick gray line in Fig. 4 A). The small value and the relatively small amplitude of the first component are consistent with the hypothesis that it mainly reflects the rapid reequilibration of the slightly voltage-dependent open channel block described above (Figs. 2 and 3). This hypothesis is also supported by the observation that a similar process could not be observed with CPB in similar conditions (Pusch et al., 2001). We did not quantitatively study the fast process since its kinetics and deactivating time course are overlapping with the transient capacitive artifact. At positive voltages this process was not visible.
Two different stimulation protocols were used to measure the time-constant of the slow component for voltages between −140 and 160 mV. At negative voltages the decay of currents, that reflects a mixture of channel closing and drug binding, is best seen after a prepulse to positive voltages that fully opens and maximally “unblocks” the channels. The converse is true for the relaxations at positive voltages (see e.g., Fig. 1 B) that reflect drug unbinding and channel opening. The time constants of the slower process are between 30 and 100 ms at negative voltages and the kinetics become faster at positive voltages as shown in Fig. 4 B where the slow time constant is shown as a function of voltage in control (open circles) and at 20 mM CPA (filled circles). At smaller CPA concentrations the time constant was more difficult to extract in quantitative terms.
Single Channel Analysis of CPA Block of WT CLC-0
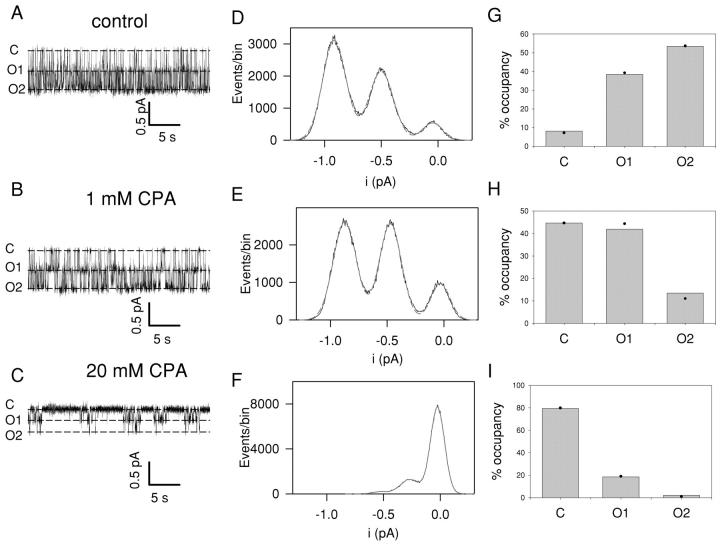
If CPA has a finite, albeit low, affinity for open CLC-0 protopores, a flickery block might be observable at the single-channel level. This is indeed the case. Fig. 5 shows long (30 s) recordings from a patch with a single CLC-0 channel at −80 mV in control conditions (Fig. 5 A) and with 1 mM (Fig. 5 B) and 20 mM CPA (Fig. 5 C). CPA has two distinct effects on CLC-0: it reduces the time that the channel spends in its conductive states and it also reduces the single-channel amplitude (measured at a filtering frequency of 500 Hz). The reduction of the mean time spent by the channel in any of the two conductive states is already visible with 1 mM CPA present in the bath (Fig. 5 E), while the reduction in conductance is too low to be accurately measured (i(ctrl) = 0.45 pA and i(1 mM CPA) = 0.42 pA). Increasing CPA concentration to 20 mM not only further decreases the time spent in the conductive states but also drastically reduces the apparent single-channel conductance (i(20 mM CPA) = 0.24 pA), suggesting that CPA can bind to the open CLC-0 channel.
Figure 5.
Inhibition of single protopores. A single CLC-0 channel present in an inside-out patch was measured at a holding potential of −80 mV in control conditions (A) and in the presence of 1 mM CPA (B) and 20 mM CPA (C). Next to each trace (D–F) is an amplitude histogram of the complete recording together with a fit of the sum of three Gaussian components (dashed gray lines). The peaks of the Gaussian fits are indicated as dashed lines on the current traces. The respective area of each Gaussian component was used to calculate the relative open probability of each conductance state. G–I show the binomial fits. Gray bars represent the values from the traces in A–C, while the filled circles are the expected values from the binomial fits.
The amplitude histograms of the recordings in the absence and presence of CPA (shown next to the traces in Fig. 5) were fitted with the sum of three Gaussian distributions from which, the occupation probabilities of the three conductance levels, p0, p1, and p2, were obtained. These occupation probabilities could be approximated by a binomial distribution (Fig. 5, G–I), suggesting that CPA resembles CPB in its ability to independently inhibit single protopores. Also, the reduction of the open probability of the individual protopores of CLC-0 demonstrates that CPA stabilizes the closed state, similar to CPB (Pusch et al., 2001).
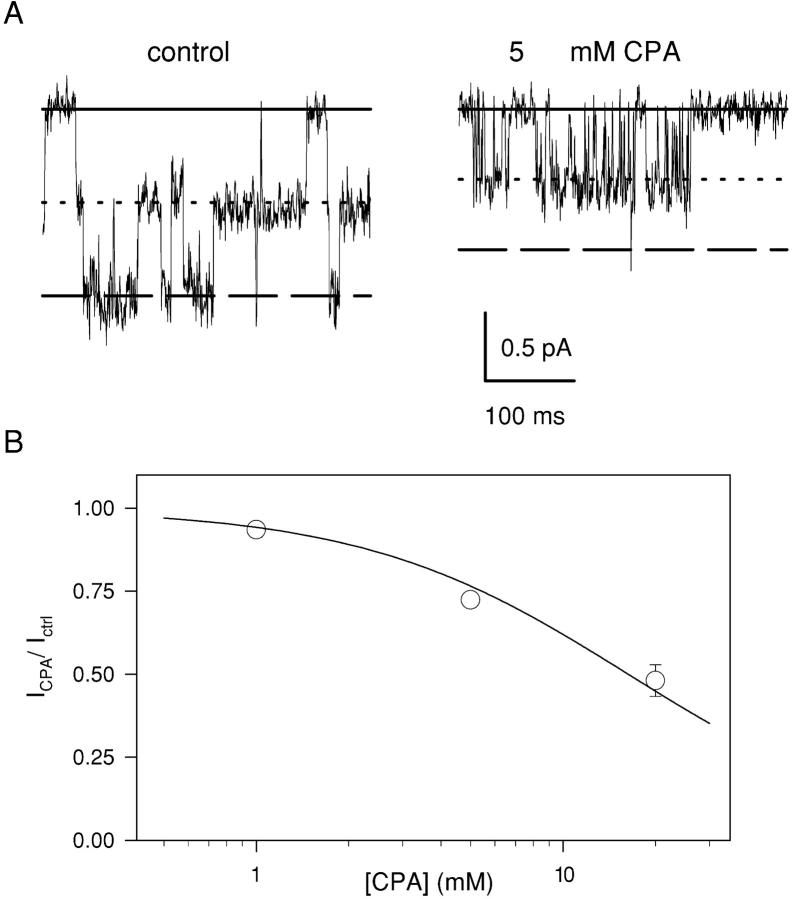
The fast flickery process observed upon addition of CPA probably represents its rapid binding and unbinding to the open channel. To have a better look at this fast intra-burst process, we show short stretches of single-channel activity (Fig. 6 A) in control (left) and in presence of 5 mM CPA (right) at a filtering frequency of 1 kHz. As can be seen, the fast intraburst transitions induced by CPA block are not clearly resolved as their amplitude is reduced by the filter and they are partially masked by the baseline noise. Lowering the filtering frequency only reduces further the apparent single-channel conductance (unpublished data).
Figure 6.
Fast open channel block by CPA**.** (A) The fast open channel block is illustrated at an expanded time scale. Short stretches of a single-channel recording without (left) and with 5 mM CPA in the intracellular solution (right) at −100 mV are shown (digitally filtered at 1 kHz). The solid line represents the zero current level, the dotted line represents the current level associated to one pore open, and the dashed line represents the current level due to the simultaneous opening of two pores. (B) Long events like those shown in Fig. 5 were used to estimate the current reduction caused by the fast flickery block. Mean values of the ratio of the open channel current with and without CPA is plotted as a function of the CPA concentration at −80 mV. The solid line is a fit of Eq. 1. A similar analysis was performed also at −120 and −100 mV and the resulting KD values are shown in Fig. 3 as open squares.
To quantify the open channel block we evaluated the current reduction in presence of CPA as described in materials and methods. Fig. 6 B shows the reduction of the single-channel current at −80 mV plotted as a function of CPA concentration (empty circles). Fitting these data to Eq. 1 (solid line in Fig. 6 B) yields KD values plotted in Fig. 3 (open squares) that are in the range of ∼15 mM. No information on the voltage dependence of the open channel KD could be inferred from the single-channel data. However, if we extrapolate the exponential voltage dependence of the macroscopic current inhibition seen at high positive voltages (Eq. 2) to the potentials at which this single-channel analysis was performed we find that the measured open channel KDs (open squares in Fig. 3) are relatively close to the extrapolation (dotted line in Fig. 3). This finding strongly supports the interpretation that the inhibition observed at high positive voltages indeed represents an open channel block.
Kinetic Analysis of Single CLC-0 Channels with CPA
In addition to reducing the single-channel conductance CPA also strongly influences gating of CLC-0 channels (Figa. 4 A, and 5, B and C). In the following paragraph we are going to analyze the various gating components to extract parameters that will allow a quantitative modeling of the properties of block.
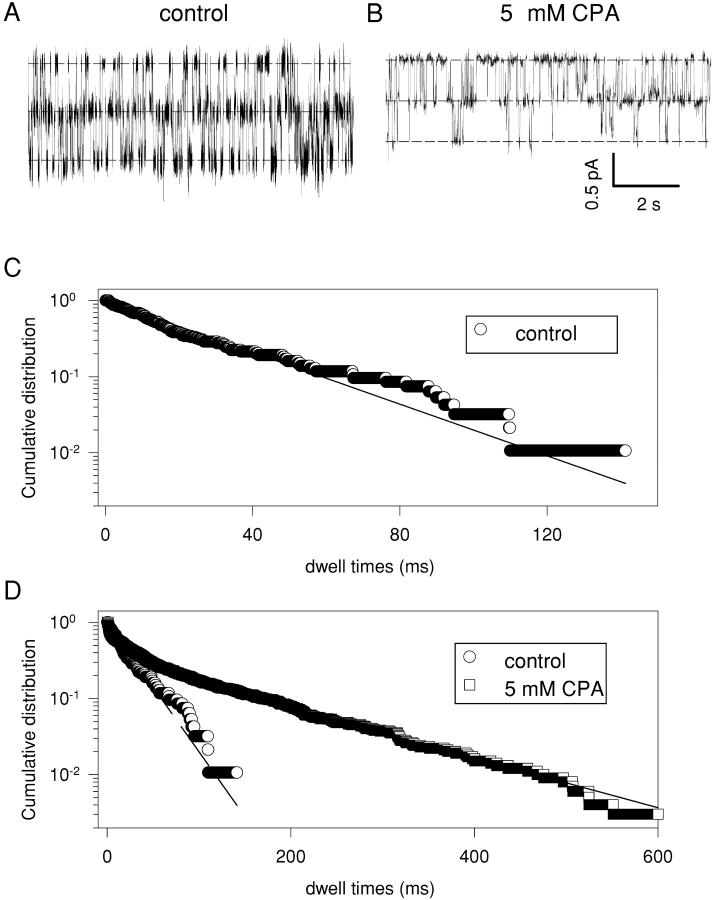
Fig. 7, A and B , show long stretches of a single CLC-0 channel recorded, respectively, without and with 5 mM CPA at −100 mV. In control conditions we performed a dwell time analysis for all three conduction levels (Chen and Miller, 1996) (the closed state dwell time analysis is shown in Fig. 7 C as circles). In contrast, in presence of CPA a similar analysis could be performed only for the closed state (Fig. 7 D, squares). For the two open states the contamination due to the fast process associated with the open channel block effectively prevented any quantitative determination of the dwell times.
Figure 7.
Kinetic analysis of a single channel at −100 mV. The long recordings shown in A (control) and B (with 5 mM CPA in the bath solution) were subjected to idealization after filtering at 500 Hz as described in materials and methods. In C is shown the dwell time distribution of the closed state in control conditions. In D are shown in the same graph the dwell time distribution of the closed state in control conditions (circles) (same data as in C; note, however, the different time scale) and in presence of 5 mM CPA (squares). In the absence of CPA dwell times could be well fitted with single exponential function with τ0 = 13.6 ms (dashed line). In the presence of CPA, the distribution of zero current epochs (empty squares) was fitted with the sum of three exponential functions (solid line) with time constants: τ01 = 132.9 ms, τ02 = 30.3 ms, and τ03 = 3.0 ms. The idealization was performed not accepting transitions lasting <1 ms.
In the absence of CPA all three dwell time histograms (double open level, single open level, closed) could be well fitted with single exponential distributions with time constants: τ2 = 37.1 ms (double open) (unpublished data); τ1 = 18.9 ms (single open) (unpublished data); τ0 = 13.6 ms (closed times) (Fig. 7, C and D circles). From the determination of τ0 and τ2 we can calculate the opening and closing rate of the channel, α = 36.8 s−1 and β = 13.5 s−1, respectively (τ0 = 1/(2α) and τ2 = 1/(2β)). From these values it follows that τ1 = 19.9 ms and the single protopore open probability P = 0.73, both calculated values are in good agreement with the experimentally determined ones (τ1 = 18.9 ms and P = 0.75).
Addition of 5 mM CPA to the solution yields a much more complicated pattern. The closed state is described by the sum of three exponentials with time constants τ01 = 132.9 ms, τ02 = 30.3 ms and τ03 = 3.0 ms. The longer time constant, τ01, absent in control conditions likely reflects the residence time of CPA bound to closed CLC-0 protopores. Consistent with the macroscopic measurements, this value is smaller than that found for CPB. The fast time constant τ03 is likely caused by fast closures associated with the open channel block that are longer than the imposed threshold (1 ms, see materials and methods). Its value, therefore, is not a reliable estimate of the duration of these short events. The intermediate and slow time constants reflect dwelling of the channel in the closed state or in drug bound states, respectively, and their evaluation is thus only slightly affected by the fast open channel block.
Dwellings in the open states are frequently interrupted by short blocking events, most of which are smeared out by the low pass filter. Using a higher filter frequency leads to an unfavorable signal to noise ratio, rendering a quantitative open dwell time analysis almost meaningless.
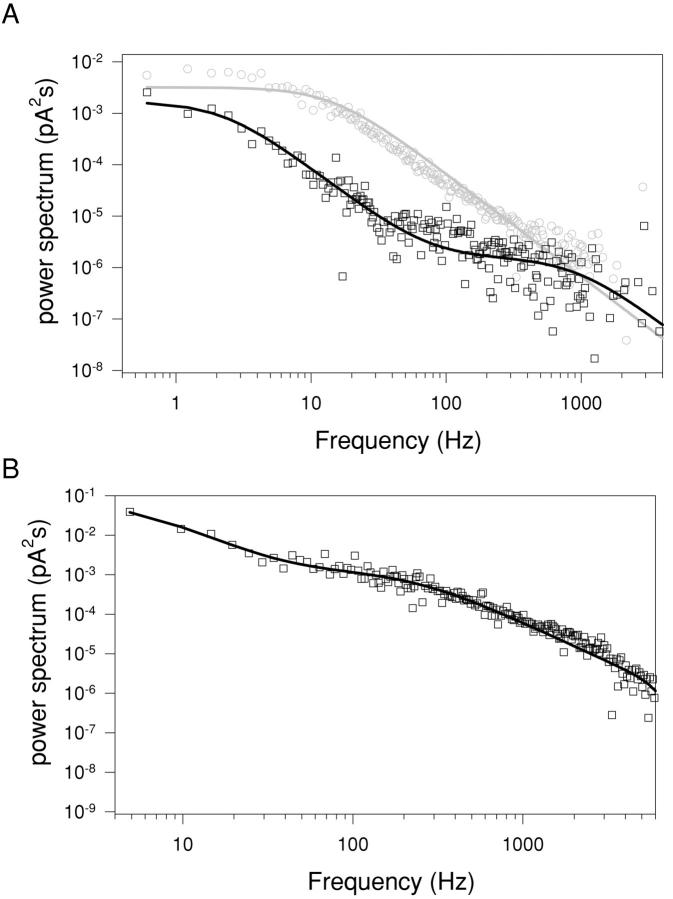
To obtain a rough estimate of the frequency associated with the fast blocking process we calculated the power spectra from long single-channel recordings both in control conditions and in presence of CPA. Fig. 8 A shows the spectra obtained from one such recording at −80 mV in control (gray circles) and with 20 mM CPA (black squares). The spectrum without CPA is well described by a single Lorentzian function (solid gray line) with a corner frequency of ∼14 Hz in good agreement with the expected value of 11 Hz, calculated from the macroscopic relaxation time constant. The spectrum in presence of 20 mM CPA requires two Lorentzians for an adequate fit (solid black line) with corner frequencies of 2.3 and 920 Hz, respectively. The smaller frequency reflects the slowed macroscopic relaxation found in the presence of CPA and it is in good agreement with the expected value of 3.2 Hz (calculated from the macroscopic slow time constant (Fig. 4)). The higher frequency observed most likely reflects the fast binding and unbinding of CPA from the open channel. Because of limited single-channel data we performed an exhaustive spectral analysis of macroscopic data at −140 mV with and without 20 mM CPA. We chose −140 mV because the largest amount of macroscopic data was available at this voltage. A representative example is shown in Fig. 8 B that shows a spectrum of macroscopic currents measured with 20 mM CPA (circles) fitted with the sum of two Lorentzian functions (line). The higher frequency component had a mean value of 195 ± 22 Hz (SD, n = 13) a value that is of the same order of magnitude as the one found from the single-channel analysis (Fig. 8 A). Under the assumption that this frequency is due exclusively to a rapid equilibrium between the open and open-blocked states, we can estimate the individual on and off rate constants (see materials and methods). For this purpose we used the measured open channel KD at −120 mV (13.3 mM; Fig. 3, squares), the most negative voltage for which sufficient single channel data was available. The 20 mV difference between −140 (macroscopic data) and −120 mV (single-channel data) will lead to a slight underestimation of kon that is, however, expected to be <7% because the voltage dependence of the open channel KD is small (zKDO = ∼0.21). The difference will therefore be ignored. With this value of KD O = 13.3 mM we obtain the estimates kon O = 37 s−1 mM−1 and koff O = 490 s−1 at −140 mV.
Figure 8.
Power spectra of a single channel and of macroscopic currents. (A) Power spectrum analysis of a single channel at −80 mV in control conditions (gray circles) and in presence of 20 mM CPA (black squares). The control spectrum is well fitted with a single Lorentzian function with a corner frequency of 14 Hz (solid gray line). The sum of two Lorentzians (see materials and methods) with corner frequencies of 2.3 and 920 Hz was needed to fit the spectrum in presence of 20 mM CPA. Baseline spectrum was subtracted from both spectra. The spectra were calculated as described in materials and methods. (B) A representative spectrum of macroscopic currents measured with 20 mM CPA at −140 mV (circles) fitted with the sum of two Lorentzian functions (see materials and methods) with corner frequencies of 5.1 Hz and 231 Hz, respectively. Spectra of macroscopic currents in the absence of CPA presented a major component at 14 Hz and a small component above 2 kHz (unpublished data).
Effect of the Extracellular Cl− Concentration on the Open-channel Block
If CPA acts as an open-channel blocker its affinity for the open pore should be sensitive to the extracellular Cl− concentration when there is an inward Cl− ion flux. High [Cl−]ext should then destabilize CPA binding at positive voltages either by increasing the off rate or by reducing the on rate. Consequently, reducing [Cl−]ext is expected to increase the CPA affinity for the open channel in the same voltage regime. At negative voltages, on the other hand, the Cl− flux should be unchanged and the open channel affinity should not be altered since the outward flux of Cl− ions is unaltered.
We found, using experiments similar to those detailed above (Fig. 2), that at positive voltages the affinity for the open channel is increased by a factor of ∼3−4 in 5 mM [Cl−]ext, whereas the steepness of the voltage dependence seems to be slightly increased (zKD(low Cl−) = 0.35). There is a meaningful difference for KD values in low and high [Cl−]ext, since the relative error is <20% in each case (see above). It is known that lowering the external Cl− concentration shifts the activation curve of CLC-0 toward more positive voltages (Pusch et al., 1995). In our case the measured half activation potential with 5 mM Cl− ext is V1/2(Cl− = 5 mM) = (−45 ± 5) mV (n = 5), an ∼50 mV shift compared with control condition. Since CPA has a higher affinity for the closed state than for the open state, such a shift of the activation curve toward positive voltages in low [Cl−]ext could misleadingly appear as an apparent increase in the open-channel affinity of the blocker, whereas it is in fact due to the reduced open probability. However, even in low Cl− for V ≥ 100 mV the open probability is very close to unity, so the contamination from the drug binding to the closed channels should be negligible. In accordance with these considerations the voltage dependence of block is exponential only for V ≥ 100 mV (see dashed line in Fig. 3) and there is a relatively sharp drop of the KD at 80 mV that is probably caused by the fact that popen < 1. The increase in block for V ≥ 100 mV observed in low [Cl−]ext is consistent with the idea that the reduction of the currents at positive voltages indeed reflects an open-channel block.
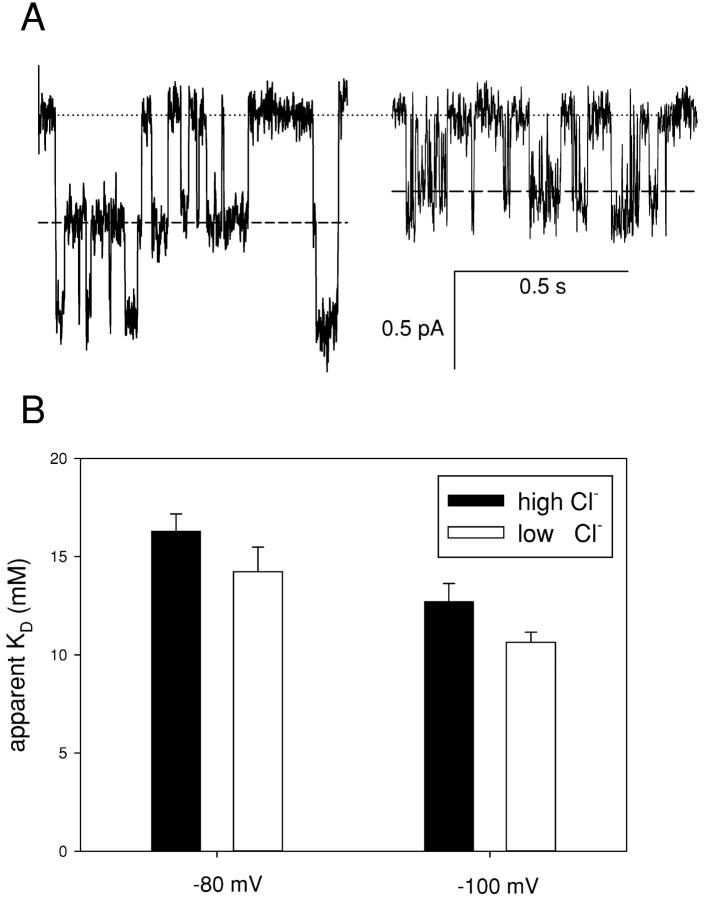
Next we investigated the effect of the reduction of [Cl−]ext on the open-channel block at negative voltages. Macroscopic current analysis will not allow us to clearly separate open and closed channel block at negative voltages due to the complex mixing of the two processes, so we resorted to single-channel analysis. The Fig. 9 A, right and left, respectively, show traces of a single CLC-0 channel in low [Cl−]ext with and without 5 mM CPA. The visible reduction in the single channel amplitude is very similar to that observed with high [Cl−]ext (Fig. 6). Fig. 9 B shows the open channel KDs at −80 and −100 mV in high (black bars) and low (gray bars) [Cl−]ext. Only a slight difference is visible, consistent with the idea that the increase in affinity seen at positive voltages is due only a direct coupling of blocking CPA molecules with permeating Cl− ions.
Figure 9.
Effect of [Cl−]ext on the open channel KD at negative voltages. (A) Open channel block with 5 mM [Cl−]ext. Stretches of a single-channel recording without (left) and with 5 mM CPA in the intracellular solution (right) at −80 mV are shown. The dotted line represents the zero current level, the dashed line the current level associated to one pore open. (B) Comparison of the open channel KD in high (black bars) and low (gray bars) [Cl−]ext at −80 and −100 mV. Errors bars are SEM.
A Quantitative Model for CPA Block
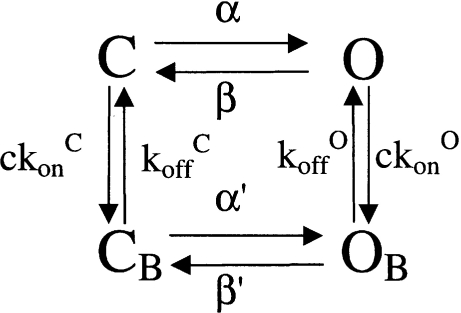
Our data clearly shows that CPA can bind to open and closed CLC-0 channels. The apparent KD and the blocking kinetics will thus be a mixture of these two components weighted with channel gating. It is thus difficult to immediately extract the values of the on and off rates for the two states and the results will clearly be model dependent. The simplest kinetic description of CPA block will then need at least four states: two unbound states (O and C) and two drug-bound states (OB and CB). We have previously established a simple four-state model (Model 1) that could quantitatively describe the inhibition of CLC-0 protopores by CPB (Pusch et al., 2001).
MODEL 1.
We asked what modifications are necessary to adapt the model for a description of CPA block. An important feature of CPA block is that the open-channel affinity (kon O/koff O) can be measured. We could estimate the individual on and off rate constants from the power spectra, but we were unable to directly measure them. Implementing the voltage-dependent open channel KD (see dotted line in Fig. 3), and with a few other assumptions as detailed in materials and methods, the model could be parameterized by three adjustable variables: H, a number that describes the stabilization of the closed state; Kβ, a kinetic factor that describes the relative slowing of β′ compared with β; and kon C, the on rate constant to the closed state, assumed to be independent of voltage. The apparent macroscopic KD is independent of Kβ and kon C, being determined only by H. Therefore, we first estimated the value of H by fitting the KD-voltage relationship (Fig. 3). The best fit (continuous line in Fig. 3) was found for H = 20. The fit with this value for H leads to a very good description of the voltage dependence of the macroscopic KD. The value of H = 20 means that the free energy of the closed CPA-bound state is lowered by ∼7.3 kJ/mol compared with drug-free channels, or in other words, that the affinity for CPA of the closed state is 20-fold higher than that of the open state. We then estimated the values for Kβ and kon C by fitting the time constants measured in the presence of 20 mM CPA to that predicted by the model. As for any four-state model, three different time constants are predicted at all voltages. One of these is very fast and corresponds to the fast equilibration of states O and OB. This time constant was neglected. Of the remaining two time constants one was more predominant such that after a small delay the predicted time course could be well fitted by a single exponential function. The two parameters, Kβ and kon C, were adjusted to obtain a good agreement with the data (Fig. 4 A, solid line). The best values found were kon C = 29.5 s−1 mM−1 and Kβ = 4.3. Interestingly, the on-rate constant to the closed state has a similar value as that estimated for the open state (kon O = 37 s−1 mM−1).
Through Model 1 we are thus able to separate the binding reactions to open and closed WT channels, and to describe the voltage dependence of the apparent macroscopic KD and of the kinetics in the presence of CPA (Figs. 3 and 4 B, solid lines).
Investigating the CPA Binding Site
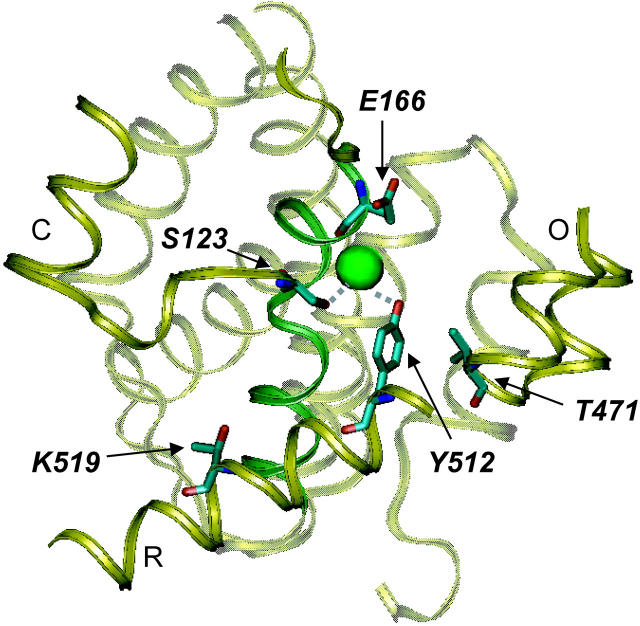
To investigate the binding site of CPA to the channel we focused on four different residues predicted to be located near the intracellular side of the pore: S123, T471, Y512, and K519 (Dutzler et al., 2002). Fig. 10 shows a view of the intracellular side of the crystal structure of the StCLC (Dutzler et al., 2002). The explicitly shown residues are those equivalent to the ones mutated in this study and a glutamate residue (Glu 148 of StCLC) that appears to prevent Cl− ion flux in the crystallographic model (Dutzler et al., 2002). Among these, only T471 does not directly line the putative permeation pathway. This threonine, however, has been shown to play an important role in 9-AC and CPA block in CLC-1, CLC-2, and CLC-0 (Estévez et al., 2003). Residues S123 and Y512 are highly conserved among CLC channels and correspond to S107 and Y445 in the bacterial StCLC where their side-chains directly coordinate the Cl− ion in the crystal structure (Dutzler et al., 2002) and thus constitute natural candidates to investigate a possible pore location of the binding site. The last residue, K519, has been shown to play an important role in intracellular Cl− binding to the channel (Chen and Chen, 2002) and lines the intracellular portion of the permeation pathway (Ludewig et al., 1997a), thus being a good candidate to probe the access pathway of CPA to its binding site.
Figure 10.
Location of mutated residues. The residues of StCLC that correspond to the ones mutated here (correspondence according to the alignment of (Dutzler et al., 2002): S123(CLC-0) → S107(StCLC); E166(CLC-0)->E148(StCLC); T471(CLC-0) → V402(StCLC); Y512(CLC-0) → Y445(StCLC); K519(CLC-0) → T452 (StCLC)) and the highly conserved Glut148 are highlighted in a view of part of the structure of StCLC (Dutzler et al., 2002). Several helices and loops are shown as cartoon. The green sphere corresponds to the Cl− ion seen in the crystal structure. The figure was prepared with the program VMD (Humphrey et al., 1996).
Biophysical Properties of Investigated Mutants
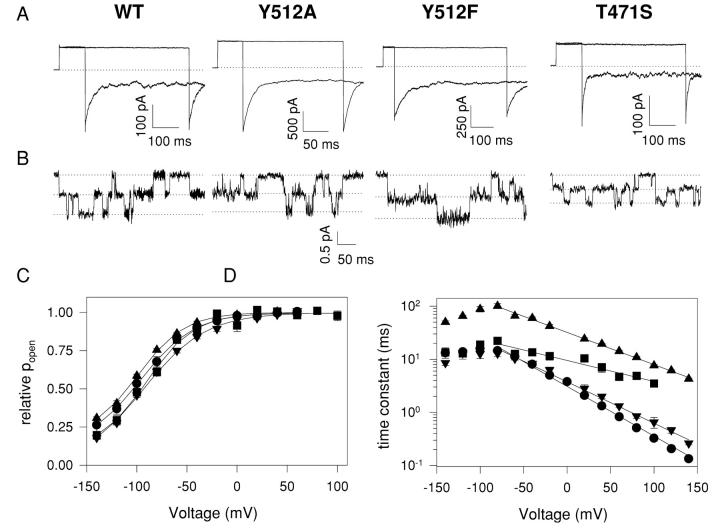
Some of the mutations investigated here for their impact on CPA block also have other interesting effects that have already been reported in the literature: S123T slows gating, slightly alters the selectivity, and reduces the single-channel conductance by fivefold (Ludewig et al., 1996). Placing a Glu or a Gln in position 519 is known to reduce single-channel conductance and to slow down channel kinetics (Ludewig et al., 1996, 1997a; Middleton et al., 1996). Fig. 11 shows the characteristics of the WT and the other three mutants investigated: Y512A, Y512F, and T471S. Fig. 11 A shows examples of macroscopic currents. Mutation T471S slightly speeds up the deactivation kinetics at −140 mV while Y512F slows down this process. At −140 mV Y512A does not alter the kinetics. Fig. 11 B shows single-channel traces recorded at −100 mV. None of these mutations significantly alter the single-channel conductance: the chord conductance at −100 mV of the WT channel was γ = 7.6 ± 1.1 pS, whereas for the T471S mutant we found γ = 5.4 ± 1.1 pS, for Y512A γ = 6.5 ± 1.6 pS, and for Y512F γ = 8.3 ± 1.6 pS. The mutations maintained the WT halide selectivity sequence of Cl−>Br−>I− (unpublished data).
Figure 11.
Properties of mutants. (A) Macroscopic traces of WT CLC-0, Y512A, Y512F, and T471S mutants. After a prepulse to 60 mV the voltage was varied between −140 and +60 mV followed by a constant tail pulse to −140 mV. Pulse duration was adjusted depending on the characteristics of the different mutants. Only the traces at −140 and +60 mV are shown for clarity's sake. The dotted line represents zero current level. (B) Single-channel traces recorded at −100 mV. The traces were acquired at 1 KHz and digitally filtered at 500 Hz for display. The three dotted lines represent the three conductance levels found in CLC-0 single-channel recordings. (C) Activation curves for the WT (circles), T471S (inverted triangles), Y512A (squares), and Y512F (triangles). Solid lines represent fits obtained with the following equation: f(V)=P0 + (1 − P0)/(1 + exp(zF(V1/2 − V)/RT)) where P0 is the residual open probability at most negative voltages, V1/2 is the half activation potential, and z is the apparent gating charge. (D) Voltage dependence of the time constants of the WT and mutant channels. Symbols are the same as in C. Solid lines represent fits obtained with Eq. 4 for V > −60 mV.
None of the mutations shown in Fig. 11 significantly affected the voltage dependence of activation (Fig. 11 C). In all cases the maximum open probability was evaluated with noise analysis and found not to be significantly affected (unpublished data). In contrast, the kinetics of gating are significantly slowed by mutations in position 512 (Fig. 11 D). Gating in the Y512F mutant (triangles) is considerably slowed down at all voltages, while mutation Y512A (squares) affects kinetics only at positive voltages. In all cases the voltage dependence for V > −80 mV could be well fitted with an exponential function of the form
 |
(4) |
|---|
where τ0 is the time constant at 0 mV, zτ is the slope of the voltage dependence, and the other symbols have their usual meaning. The slope of the voltage dependence of the T471S mutant is very similar to that of the WT channel (zτ(WT) = 0.55, zτ(T471S) = 0.46), whereas Y512F and Y512A strongly alter this value to zτ(Y512F) = 0.35 and zτ(Y512A) = 0.23.
Effect on CPA Block of the Selected Mutants
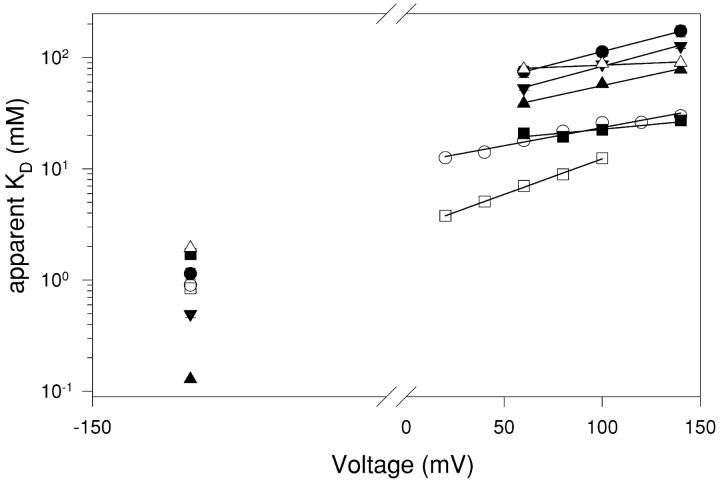
To investigate the effects of the selected mutants on open and closed channel CPA block, pulse protocols similar to those used for the WT channel, with pulse lengths adjusted to the time necessary to achieve steady-state conditions, were applied and the resulting steady-state inhibition was measured at 0.1, 1, 5, and 20 mM CPA for voltages ranging from −140 to +140 mV. For clarity Fig. 12 shows the apparent KDs only at −140 mV and at positive voltages (V > 40 mV). The solid lines are exponential fits obtained with Eq. 2.
Figure 12.
Apparent KD of the mutants. The apparent KD of the WT (filled circles), S123T (filled squares), T471S (triangles), Y512A (open squares), Y512F (inverted triangles), K519E (diamonds), and K519Q (open circles) is shown as a function of voltage. For clarity only the values at −140 mV and at positive voltages are shown. Solid lines are fits with Eq. 2. Error bars are SEM.
Mutation T471S (filled triangles) had a drastic effect on the apparent dissociation constant at negative voltages: at −140 mV the KD is tenfold less than the WT (filled circles). At positive voltages on the other hand there is less than a twofold increase in affinity and the voltage dependence of block is not altered (zWT KD = 0.21 and zT471S KD = 0.22).
Mutating the positively charged Lys 519 to either the negatively charged Glu (empty triangles) or to the neutral Gln (empty circles) has little to no effect on block at negative voltages (at most a twofold increase in the KD). At positive voltages, on the other hand, the two mutations have profoundly different effects: the negative Glu almost completely eliminates the voltage dependence of block (zK519E KD = 0.04) without a drastic change of the affinity at high positive voltages. The neutral Gln instead increases the affinity at 140 mV sixfold while leaving unchanged the voltage-dependence of block (zWT KD = 0.21 and zK519Q KD = 0.19).
Mutations in the selectivity filter (residues S123 and Y512) have little to no effect on the block at negative voltages but have strong effects at positive voltages. Mutation S123T (filled squares) strongly increases the affinity at positive voltages, with more than a sixfold effect at 140 mV, whereas the voltage dependence of block is reduced to zS123T KD = 0.10.
The conservative mutation Y512F (inverted triangles) only slightly affected CPA block at any voltage. In contrast, the more drastic mutation Y512A (empty squares) induces an increase in the affinity at positive voltages by almost a factor of 10 at 100 mV. The voltage dependence of block is also increased to zY512A KD = 0.37.
DISCUSSION
Clofibric acid derivatives are among the few known CLC channel blockers. Based on macroscopic whole-cell measurements Aromataris et al. (1999) have proposed that CPP acts as a gating modifier shifting the activation of CLC-1 toward more positive voltages. A detailed study of the inhibition of CLC protopores by CPB led to the proposal of a model of block in which CPB binds to the pore in both the open and closed state (Accardi et al., 2001; Pusch et al., 2001). However, a direct proof of CPB binding to open channels was lacking, as the affinity was too low to be detected. Here we show that CPA, the simplest CPB analogue, can bind with measurable affinity to CLC protopores in both the open and closed conformation. Several lines of evidence led us to conclude that, in an open channel, CPA acts by directly occluding the permeation pathway. There is an incomplete relief from block even at very high positive voltages (Fig. 2), fast blocking events are observed at the single channel level (Fig. 6 A) and lowering the extracellular Cl− concentration increases the apparent affinity for CPA at positive voltages (Fig. 3, open triangles). Furthermore, mutations that line the putative permeation pathway (K519) or that form the selectivity filter of the channel (S123 and Y512) (Dutzler et al., 2002) specifically influence this process, reinforcing the idea that it happens deep inside the channel pore. These results are in good agreement with those of Estévez et al. (2003) that proposed that the CPA binding site to the closed channel is located deep inside the pore and partially overlaps with the central Cl− ion binding site. However, even if all available data points to a pore location of the binding site in the closed state, a direct proof would require crystallization of a CLC channel in the presence of CPA or an equivalent inhibitor.
Properties of the Open Channel Block
The open channel block exerted by CPA is manifested at the single-channel level as a fast flickery block. The characteristic frequency of this process is too high to be correctly resolved at 500 Hz and using a higher filtering frequency drastically worsens the signal to noise ratio, rendering a quantitative dwell time analysis almost meaningless, especially for the open states. For this reason we turned to power spectra analysis to quantitatively estimate the frequency associated with this process. The spectrum in control conditions is well described by a single Lorentzian function, whereas with 20 mM CPA the sum of two Lorentzians was needed for a satisfactory fit. This analysis, together with the measure of the open channel KD at negative voltages (Figs. 3 and 6 B), allowed a rough estimate of the value of the individual on and off rates for the open channel, and we found that kon O = 37 s−1 mM−1 and koff O = 490 s−1, confirming that the open channel block is too fast to be directly kinetically resolved at the single-channel level. From the analysis of the slower gating relaxations in the presence of 20 mM CPA, based on the four-state model, we estimated for the on-rate constant to the closed state kon C = 29.5 s−1 mM−1, a value that is very similar to that for the open state. Thus, it appears that the dissociation of CPA from the channel rather than its association is state dependent.
Where does the voltage dependence of the open channel block come from? It might arise directly from the movement of the charged CPA molecule within the transmembrane electric field or indirectly from a coupling of the movement of permeant ions to the binding/unbinding of CPA. In the latter case, the closed channel affinity would be expected to be almost voltage independent. Our model, however, leads to a nice quantitative description of CPA block, assuming the same voltage dependence of open and closed channel block. In addition, the closed channel affinity had to be assumed to be voltage dependent for a quantitative description of CPB block (Pusch et al., 2001). However, since the closed channel affinity is difficult to measure directly, the conclusions regarding the origins of the voltage dependence have to be tested in future experiments.
Is Tyrosine 512 in the Selectivity Filter of the Open Channel?
The recently published crystal structures of bacterial CLC analogs has shown that Tyr 445, the homologous residue to Tyr 512 in CLC-0, is one of two residues whose OH-side-chain group directly coordinates the central Cl− ion bound to the channel (Dutzler et al., 2002). The authors of the paper also argued that the structure represents a closed channel, as the side-chain of Glu148 occluded the putative permeation pathway. Here we show that mutating the highly conserved tyrosine residue in CLC-0 does not significantly alter the conduction properties of the channel. For both residues introduced, phenylalanine and alanine, the single-channel conductance was comparable to that of the WT channel and the selectivity was unchanged. Similar results have been obtained for the equivalent mutations in CLC-1 (Estévez et al., 2003).
Phenylalanine differs from tyrosine in lacking the Cl− coordinating hydroxyl group in paraposition of the aromatic ring. The WT-like open-channel properties of mutant Y512F suggest that the hydroxyl group is of little importance in the open channel. It could be that another part of the side-chain, i.e., the aromatic ring, plays an important part in coordinating Cl− ions in the open channel. To investigate this possibility we also mutated the tyrosine to alanine, thus substituting the aromatic ring with a −CH3-group. Again, we found that neither the single-channel conductance nor the selectivity were affected, thus ruling out the possibility that the aromatic ring of the tyrosine plays a decisive role for the conduction properties of the open channel. A possibility that might account for this lack of effect could be that in the open state Cl− ions are coordinated by backbone atoms, similar to what happens in K+ channels (Doyle et al., 1998), implying that its properties are less sensitive to the nature of the side-chains.
It is interesting to note that both tyrosine mutations significantly slow gating kinetics while having little effect on the steady-state open probability. This suggests that both these mutations increase the energy barrier between the open and closed conformations of the channel without changing the free energy difference between them.
Differential Effect of the Mutations on the Affinity for the Open and Closed Channel
The data on the WT channel shows that block at negative and positive voltages, respectively, reflect the CPA affinity for the closed and open channel conformations. None of the mutations introduced qualitatively alters the properties of block, i.e., in all cases the inhibition at negative voltages is stronger than at positive voltages. We can thus qualitatively separate the changes in affinity for the open and the closed state induced by the mutations. Interpreting the data shown in Fig. 12 from this point of view we see that the only mutant to have a strong effect at negative voltages, and thus on the affinity for the closed channel, is T471S: there is an almost 10-fold increase in affinity at −140 mV. All other mutations induce less than a twofold change in affinity for the closed channel. The situation at positive voltages, and thus for the open channel, is the opposite. Three mutants that had little to no effect on the closed state affinity (S123T, Y512A, and K519Q) increase the open channel block 6- to 10-fold. On the other hand, mutation T471S has almost no effect on the open-channel affinity.
The strong effect of mutations in the selectivity filter on CPA affinity for the open channel suggests that a blocker molecule moves deep inside the permeation pathway. In good agreement with this hypothesis a conservative substitution in position 512, Tyr to Phe, has little effect on the affinity for either the closed or the open channel. On the other hand, substituting the bulky side-chain of a Tyr with the smaller one of an alanine greatly increases the affinity for the open channel and almost doubles the fraction of the electric field felt by CPA. This suggests that with an Ala in position 512 CPA can go deeper in the pore and lodge itself closer to the selectivity filter.
Is Gating of CLC-0 Limited to the Movement of the Glutamate Side-chain?
In a recent paper, Dutzler et al. (2003) crystallized the alanine and the glutamine mutants of the glutamate in position 148, the amino acid that occluded the permeation pathway in the first structure (Dutzler et al., 2002), of one of the E. coli CLC channels. Both mutations free the permeation pathway and the now vacant space is occupied by a Cl− ion. Other than the position of the side chain of residue 148, the structures of the WT and mutant channels are very similar. The corresponding mutations in CLC-0 (E166A/Q) lead to a channel that loses its voltage sensitivity and has a very high open probability (Dutzler et al., 2003). These observations led the authors to propose that the mutant structures represent the open state of the channel. Furthermore, they proposed that CLC channels are gated by a very simple mechanism where movement of the glutamate side chain away from the permeation pathway is the only conformational change involved in channel opening.
Our results, however, together with other data present in the literature, challenge the generalization of this gating model from the prokaryotic to the eukaryotic channel.
First, mutating in CLC-0 the side chain of the tyrosine coordinating the central Cl− ion in the EcCLC structure has little effect on channel conductance and selectivity. This suggests that the open and conducting structure of CLC-0 is different from that proposed by Dutzler et al. (2003) for the bacterial channel, at least regarding the role of the Tyr side chain.
Second, if the structures of the glutamate mutants (Dutzler et al., 2003) were faithful representations of the eukaryotic CLCs open structure, then the KDs of the corresponding CLC-0 mutants should be similar to KD open(WT). In contrast Estévez et al. (2003) and Traverso et al. (2003) have shown that mutations in the glutamate residue in CLC-1 and CLC-0 drastically increase the apparent affinity of CPA. For the CLC-0 mutant E166A, Traverso et al. (2003) report a KD(−140 mV) in the micromolar range, over 3,000 times less than the expected value which is in the 10 mM range.
Third, we show that the affinity of CPA is much higher for the closed than for the open state of CLC-0 (an almost 100-fold difference). The affinity reflects the sum of the chemical and electrical interaction energies between blocker and protein: log(KD) ∼ ΔGel + ΔGchem. The model proposed by Dutzler et al. (2003) predicts that the chemical term in the free energy difference between open and closed channel-CPA interaction, ΔΔGchem, is exclusively due to the different positions of the glutamate in the open and closed states, as the intracellular pore structure of the open and closed states are virtually identical. For such a rigid pore it is expected that a given mutation changes the chemical interaction of CPA with the glutamate 166 side-chain equally for the open and the closed state, implying that ΔΔGchem has the same value as it has for WT CLC-0. The electrical component of the free energy difference, ΔΔGel, could arise from a direct change in the electric field inside the pore associated with channel opening or be mediated by different pore occupancy of Cl− ions or a combination of both. The differential effect of mutations T471S and Y512A on the open and closed channel affinity would thus reflect a different change in ΔGel open and ΔGel closed. Such a drastic change in the electric field inside the pore should strongly influence the channel conductance and gating. However, we found almost no change of these properties for the two mutants (Fig. 11). This observation suggests that not the electrical but mostly the chemical contribution to the interaction energy between CPA and CLC-0 is different in the open and in the closed state. This implies that in CLC-0 the structure of the intracellular pore is different in the open and closed conformations in contrast to Dutzler's proposal.
Strong evidence that gating in CLC-0 must involve a conformational rearrangement in the intracellular side of the pore comes also from the dependence of the open probability from the intracellular pH (Hanke and Miller, 1983). Hanke and Miller (1983) showed that increasing pHint shifts the activation curve toward more positive voltages. They also concluded that titration of a single residue regulates channel gating. Upon channel opening, the pK of this group changes from 6 to 9. This pK range is very far from that of the glutamate and, again, cannot be accounted for in Dutzler's model.
The basic assumption underlying their model is that the gating mechanism is conserved from the E. coli channel to CLC-0. Unfortunately, while we know that CLC-0 is gated by many different parameters, such as voltage, internal and external chloride concentrations, and pH, very little is known on the function of the prokaryotic channel. The only known fact is that it is gated by pH (Iyer et al., 2002). It could well be that gating of CLC-0 is a more complex process that involves additional parts of the channel. While it is plausible that the side chain of the glutamate residue identified by Dutzler et al. (2003) forms the physical gate of the channel, it is highly unlikely that the conformational change associated with channel opening is limited to its movement away from the permeation pathway. Rather, we have shown here that it is very likely that in CLC-0 the opening process implies a rearrangement of the intracellular side of the pore that is tightly coupled to the movement of the glutamate side chain.
Acknowledgments
We thank Dr. T.Y. Chen for providing the mutant C212S of CLC-0. We also thank Franco Conti, Chris Miller, Crina Nimigean and Ram Iyer for helpful discussion and suggestions. We also thank Mino Gaggero for building the perfusion system.
The financial support of Telethon, Italy (grant 1079) and of MIUR, Italy (FIRB RBAU01PJMS) is gratefully acknowledged.
David C. Gadsby served as editor.
Alessio Accardi's present address is Department of Biochemistry, Howard Hughes Medical Institute, Brandeis University, Waltham, MA 02454.
Abbreviations used in this paper: CPA, p-chlorophenoxy-acetic acid; CPB, p-chlorophenoxy-butyric acid; CPP, p-chlorophenoxy-propionic acid.
References
- Accardi, A., L. Ferrera, and M. Pusch. 2001. Drastic reduction of the slow gate of human muscle chloride channel (ClC-1) by mutation C277S. J. Physiol. 534:745–752. [DOI] [PMC free article] [PubMed] [Google Scholar]
- Accardi, A., and M. Pusch. 2000. Fast and slow gating relaxations in the muscle chloride channel CLC-1. J. Gen. Physiol. 116:433–444. [DOI] [PMC free article] [PubMed] [Google Scholar]
- Aromataris, E.C., D.S. Astill, G.Y. Rychkov, S.H. Bryant, A.H. Bretag, and M.L. Roberts. 1999. Modulation of the gating of CIC-1 by S-(-) 2-(4-chlorophenoxy) propionic acid. Br. J. Pharmacol. 126:1375–1382. [DOI] [PMC free article] [PubMed] [Google Scholar]
- Bösl, M.R., V. Stein, C. Hübner, A.A. Zdebik, S.E. Jordt, A.K. Mukhopadhyay, M.S. Davidoff, A.F. Holstein, and T.J. Jentsch. 2001. Male germ cells and photoreceptors, both dependent on close cell-cell interactions, degenerate upon ClC-2 Cl(−) channel disruption. EMBO J. 20:1289–1299. [DOI] [PMC free article] [PubMed] [Google Scholar]
- Chen, M., and T. Chen. 2002. Side-chain charge effect on the channel conductance of CLC-0. Biophys. J. 82:12d. [Google Scholar]
- Chen, M.F., and T.Y. Chen. 2001. Different fast-gate regulation by external Cl(-) and H(+) of the muscle- type ClC chloride channels. J. Gen. Physiol. 118:23–32. [DOI] [PMC free article] [PubMed] [Google Scholar]
- Chen, T.Y., and C. Miller. 1996. Nonequilibrium gating and voltage dependence of the ClC-0 Cl− channel. J. Gen. Physiol. 108:237–250. [DOI] [PMC free article] [PubMed] [Google Scholar]
- Conte-Camerino, D., M. Mambrini, A. DeLuca, D. Tricarico, S.H. Bryant, V. Tortorella, and G. Bettoni. 1988. Enantiomers of clofibric acid analogs have opposite actions on rat skeletal muscle chloride channels. Pflugers Arch. 413:105–107. [DOI] [PubMed] [Google Scholar]
- Doyle, D.A., J. Morais Cabral, R.A. Pfuetzner, A. Kuo, J.M. Gulbis, S.L. Cohen, B.T. Chait, and R. MacKinnon. 1998. The structure of the potassium channel: molecular basis of K+ conduction and selectivity. Science. 280:69–77. [DOI] [PubMed] [Google Scholar]
- Dutzler, R., E.B. Campbell, M. Cadene, B.T. Chait, and R. MacKinnon. 2002. X-ray structure of a ClC chloride channel at 3.0 Å reveals the molecular basis of anion selectivity. Nature. 415:287–294. [DOI] [PubMed] [Google Scholar]
- Dutzler, R., E.B. Campbell, and R. MacKinnon. 2003. Gating the selectivity filter in ClC chloride channels. Science. 300:108–112. [DOI] [PubMed] [Google Scholar]
- Estévez, R., B.C. Schroeder, A. Accardi, T.J. Jentsch, and M. Pusch. 2003. Conservation of chloride channel structure revealed by an inhibitor binding site in ClC-1. Neuron. 38:47–59. [DOI] [PubMed] [Google Scholar]
- Hanke, W., and C. Miller. 1983. Single chloride channels from Torpedo electroplax. Activation by protons. J. Gen. Physiol. 82:25–45. [DOI] [PMC free article] [PubMed] [Google Scholar]
- Humphrey, W., A. Dalke, and K. Schulten. 1996. VMD: visual molecular dynamics. J. Mol. Graph. 14:33–38. [DOI] [PubMed] [Google Scholar]
- Iyer, R., T.M. Iverson, A. Accardi, and C. Miller. 2002. A biological role for prokaryotic ClC chloride channels. Nature. 419:715–718. [DOI] [PubMed] [Google Scholar]
- Jentsch, T.J., V. Stein, F. Weinreich, and A.A. Zdebik. 2002. Molecular structure and physiological function of chloride channels. Physiol. Rev. 82:503–568. [DOI] [PubMed] [Google Scholar]
- Koch, M.C., K. Steinmeyer, C. Lorenz, K. Ricker, F. Wolf, M. Otto, B. Zoll, F. Lehmann-Horn, K.H. Grzeschik, and T.J. Jentsch. 1992. The skeletal muscle chloride channel in dominant and recessive human myotonia. Science. 257:797–800. [DOI] [PubMed] [Google Scholar]
- Kornak, U., D. Kasper, M.R. Bösl, E. Kaiser, M. Schweizer, A. Schulz, W. Friedrich, G. Delling, and T.J. Jentsch. 2001. Loss of the ClC-7 chloride channel leads to osteopetrosis in mice and man. Cell. 104:205–215. [DOI] [PubMed] [Google Scholar]
- Lin, C.W., and T.Y. Chen. 2000. Cysteine modification of a putative pore residue in ClC-0: implication for the pore stoichiometry of ClC chloride channels. J. Gen. Physiol. 116:535–546. [DOI] [PMC free article] [PubMed] [Google Scholar]
- Lin, Y.W., C.W. Lin, and T.Y. Chen. 1999. Elimination of the slow gating of ClC-0 chloride channel by a point mutation. J. Gen. Physiol. 114:1–12. [DOI] [PMC free article] [PubMed] [Google Scholar]
- Lloyd, S.E., S.H. Pearce, S.E. Fisher, K. Steinmeyer, B. Schwappach, S.J. Scheinman, B. Harding, A. Bolino, M. Devoto, P. Goodyer, et al. 1996. A common molecular basis for three inherited kidney stone diseases. Nature. 379:445–449. [DOI] [PubMed] [Google Scholar]
- Ludewig, U., T.J. Jentsch, and M. Pusch. 1997. a. Analysis of a protein region involved in permeation and gating of the voltage-gated Torpedo chloride channel ClC-0. J. Physiol. 498:691–702. [DOI] [PMC free article] [PubMed] [Google Scholar]
- Ludewig, U., M. Pusch, and T.J. Jentsch. 1996. Two physically distinct pores in the dimeric ClC-0 chloride channel. Nature. 383:340–343. [DOI] [PubMed] [Google Scholar]
- Ludewig, U., M. Pusch, and T.J. Jentsch. 1997. b. Independent gating of single pores in CLC-0 chloride channels. Biophys. J. 73:789–797. [DOI] [PMC free article] [PubMed] [Google Scholar]
- Maduke, M., C. Miller, and J.A. Mindell. 2000. A decade of CLC chloride channels: structure, mechanism, and many unsettled questions. Annu. Rev. Biophys. Biomol. Struct. 29:411–438. [DOI] [PubMed] [Google Scholar]
- Middleton, R.E., D.J. Pheasant, and C. Miller. 1996. Homodimeric architecture of a ClC-type chloride ion channel. Nature. 383:337–340. [DOI] [PubMed] [Google Scholar]
- Piwon, N., W. Günther, M. Schwake, M.R. Bösl, and T.J. Jentsch. 2000. ClC-5 Cl−-channel disruption impairs endocytosis in a mouse model for Dent's disease. Nature. 408:369–373. [DOI] [PubMed] [Google Scholar]
- Pusch, M., A. Accardi, A. Liantonio, L. Ferrera, A. De Luca, D.C. Camerino, and F. Conti. 2001. Mechanism of block of single protopores of the Torpedo chloride channel ClC-0 by 2-(p-chlorophenoxy)butyric acid (CPB). J. Gen. Physiol. 118:45–62. [DOI] [PMC free article] [PubMed] [Google Scholar]
- Pusch, M., A. Liantonio, L. Bertorello, A. Accardi, A. De Luca, S. Pierno, V. Tortorella, and D.C. Camerino. 2000. Pharmacological characterization of chloride channels belonging to the ClC family by the use of chiral clofibric acid derivatives. Mol. Pharmacol. 58:498–507. [DOI] [PubMed] [Google Scholar]
- Pusch, M., U. Ludewig, A. Rehfeldt, and T.J. Jentsch. 1995. Gating of the voltage-dependent chloride channel CIC-0 by the permeant anion. Nature. 373:527–531. [DOI] [PubMed] [Google Scholar]
- Saviane, C., F. Conti, and M. Pusch. 1999. The muscle chloride channel ClC-1 has a double-barreled appearance that is differentially affected in dominant and recessive myotonia. J. Gen. Physiol. 113:457–468. [DOI] [PMC free article] [PubMed] [Google Scholar]
- Simon, D.B., R.S. Bindra, T.A. Mansfield, C. Nelson-Williams, E. Mendonca, R. Stone, S. Schurman, A. Nayir, H. Alpay, A. Bakkaloglu, et al. 1997. Mutations in the chloride channel gene, CLCNKB, cause Bartter's syndrome type III. Nat. Genet. 17:171–178. [DOI] [PubMed] [Google Scholar]
- Stobrawa, S.M., T. Breiderhoff, S. Takamori, D. Engel, M. Schweizer, A.A. Zdebik, M.R. Bösl, K. Ruether, H. Jahn, A. Draguhn, et al. 2001. Disruption of ClC-3, a chloride channel expressed on synaptic vesicles, leads to a loss of the hippocampus. Neuron. 29:185–196. [DOI] [PubMed] [Google Scholar]
- Traverso, S., L. Elia, and M. Pusch. 2003. Gating competence of constitutively open CLC-0 mutants revealed by the interaction with a small organic inhibitor. In press. [DOI] [PMC free article] [PubMed]
