Y-chromosomal insights into the genetic impact of the caste system in India (original) (raw)
. Author manuscript; available in PMC: 2008 Dec 1.
Published in final edited form as: Hum Genet. 2006 Oct 31;121(1):137–144. doi: 10.1007/s00439-006-0282-2
Abstract
The caste system has persisted in Indian Hindu society for around 3,500 years. Like the Y chromosome, caste is defined at birth, and males cannot change their caste. In order to investigate the genetic consequences of this system, we have analysed male-lineage variation in a sample of 227 Indian men of known caste, 141 from the Jaunpur district of Uttar Pradesh and 86 from the rest of India. We typed 131 Y-chromosomal binary markers and 16 microsatellites. We find striking evidence for male substructure: in particular, Brahmins and Kshatriyas (but not other castes) from Jaunpur each show low diversity and the predominance of a single distinct cluster of haplotypes. These findings confirm the genetic isolation and drift within the Jaunpur upper castes, which are likely to result from founder effects and social factors. In the other castes, there may be either larger effective population sizes, or less strict isolation, or both.
Keywords: Y chromosome, haplotype, human population substructure, Indian caste system
Introduction
Modern India is a country of great diversity at many levels: cultural, linguistic and genetic (Cavalli-Sforza et al. 1994; Majumder 1998). One outstanding feature of Indian society is its organization around the Hindu caste system, which is observed by almost 80% of the population and forms one of the world's longest-surviving social hierarchies. This system is based on the division of society into four broad castes, each originally linked to a specific social occupation: Brahmins, the priests; Kshatriyas, the warriors; Vaishyas, the farmers, merchants and businessmen; Sudras, the servants and workers. A fifth caste, the Panchamas (sometimes called Dalits), was added later to include people outside the first four castes. Castes, especially the higher ones, are traditionally endogamous and membership is achieved by birth. Although officially abolished in 1949, this strict social structure has persisted for several thousand years (Thapar 1990; Wolpert 1997) and so is likely to have contributed to the substructuring of the Indian gene pool. Quantification of its effects is important not only for historical and anthropological insights, but also for understanding the distribution of the genetic variation that influences health and resolving population stratification issues in disease association studies.
The Y chromosome has proven to be one of the most informative loci for investigating genetic structure on both global and local scales (Jobling and Tyler-Smith 2003). It is particularly relevant to the investigation of the caste system because caste, like the Y chromosome, is paternally inherited, so a Y-chromosomal lineage should remain within its caste of origin. In the last few years, several Y-chromosomal studies have focused on understanding the origin of the Indian castes (Bamshad et al. 2001; Cordaux et al. 2004; Kivisild et al. 2003; Sengupta et al. 2006; Wooding et al. 2004), but fewer have concentrated on quantifying the genetic substructuring in the population as a result of social stratification among the castes (Bamshad et al. 2001; Basu et al. 2003; Wooding et al. 2004). To investigate such an effect, we performed a comparative study of Y-chromosomal data from 227 caste samples obtained with informed consent from men unrelated for the last three generations, as described elsewhere (Pandya 1997). Of these, 141 were collected from men born in 20 different villages spread over several hundred square kilometres in the Jaunpur district, a region of Uttar Pradesh in the north of India, and 86 samples were collected from men born in other Indian states (Jammu & Kashmir, Punjab, Haryana, Rajasthan, Uttar Pradesh (outside Jaunpur), Gujarat, Bihar, West Bengal, Maharashtra, Orissa, Karnataka, Andhra Pradesh and Tamil Nadu). To distinguish throughout this study between the two sample groups, we will refer to the samples from the Jaunpur district as “Jaunpur samples” and those from the rest of India as “Indian samples” although the Jaunpur samples are obviously also from India.
Materials and Methods
Sample collection and DNA extraction were performed as described elsewhere (Pandya 1997). Twenty-one binary markers were genotyped in all samples by Southern hybridisation or PCR-RFLP as described previously (Pandya 1997; Rosser et al. 2000), 115 in a hierarchical mode by mass spectrometry (Paracchini et al. 2002) and one (M69) by SNaPshot following the suppliers' recommendations (Applied Biosystems). There was some overlap between the marker sets, so the total number of different markers typed was 131, and we were able to measure an error rate of 0.1% in the RFLP-based analyses that arose from restriction enzyme digestion failures. Y-STR genotyping was performed following published methods (Ayub et al. 2000; Thomas et al. 1999). Statistical analyses, including calculation of summary statistics and Analysis of Molecular Variance (Excoffier et al. 1992), multidimensional scaling using SPSS 14.0, construction of networks (Bandelt et al. 1999) and BATWING (run on samples from individual castes) (Wilson et al. 2003) were performed as described previously (Xue et al. 2006; Zerjal et al. 2002).
Results and Discussion
Samples were typed with 131 binary markers and 16 STRs from the Y chromosome. In all, we found that 27 binary markers were polymorphic and identified 18 haplogroups (Figure 1). All 18 haplogroups were found in the Indian sample group and 13 were present in the Jaunpur samples (Table 1; full data are in Supplementary Table 1). The three most frequent haplogroups accounted for 52% (45/86) of the Indian Y chromosomes but for 76% (108/146) of Jaunpur Y chromosomes. Of these haplogroups, R1a1 and R2 were present in all castes with R1a1 being the most common haplogroup among the Indian caste samples (22%), especially among the Brahmins (35%) while R2 was the most common in the Jaunpur district (36%) and represented 87% of Jaunpur Kshatriya Y lineages. H1a* was the third most common haplogroup present in 16% of the Indian samples, and was equally distributed among all castes except the Vaishyas. In the Jaunpur district it represented 20% of the samples and was particularly frequent among Jaunpur Brahmins (65%). L1 was also well-represented among the Indian samples with a frequency of 10% but was relatively rare in Jaunpur (2%). These haplogroup frequencies are in good agreement with previous studies of caste populations (Sengupta et al. 2006), and suggest that our samples are representative of the larger caste population.
Figure 1.
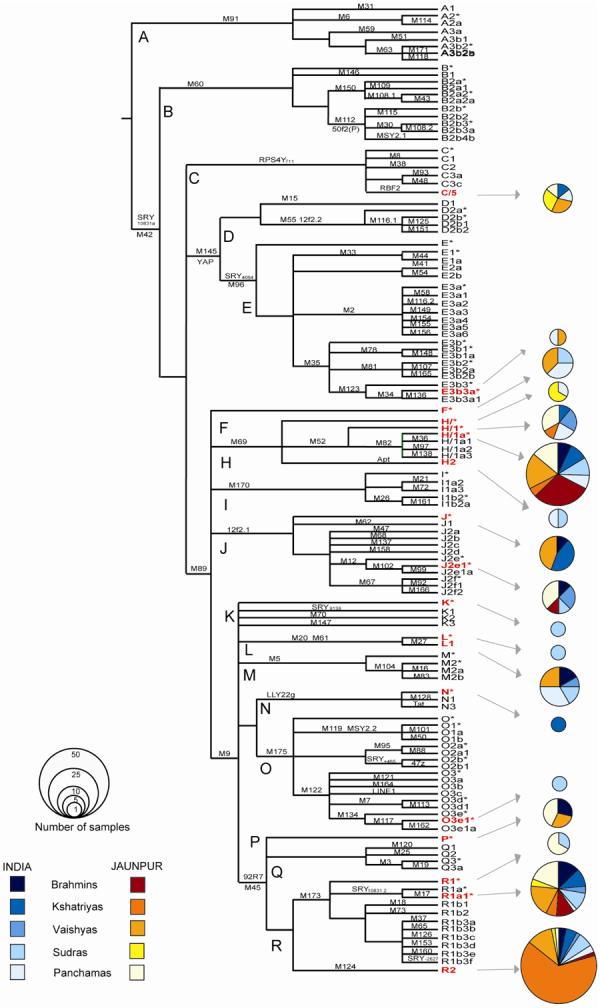
Y-chromosomal phylogeny of binary markers. The markers screened in this study are shown on each branch, and the haplogroup or paragroup (marked *) at the end. The haplogroups found in this survey are indicated in red. The pie charts are drawn with an area proportional to the haplogroup frequency, and the colored sectors represent the different castes from India and the Jaunpur district, as shown at bottom left.
TABLE 1.
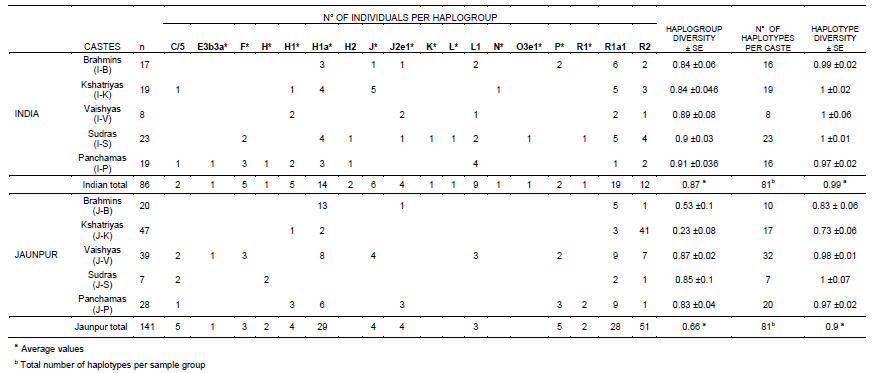
Haplogroup frequencies and haplogroup and haplotype genetic diversities
Overall, the Jaunpur castes showed a marked reduction in genetic diversity compared with the rest of India. However, this reduction was not equally distributed among the castes, but was instead restricted to the Brahmins and Kshatriyas. Genetic diversity (Nei 1987) based on haplogroup frequencies ranged from 0.84 to 0.91 (Standard Error (SE) <±0.08) in the Indian castes, and similar values were also detected among the Vaishyas, Sudras and Panchamas from the Jaunpur district. But it was 0.54 (SE ±0.1) among the Jaunpur Brahmins and only 0.23 (SE ±0.08) in the Jaunpur Kshatriyas (Table 1). A similar pattern was also seen when the microsatellite analysis was carried out. From the 227 samples we identified 156 microsatellite haplotypes, 81 in each sample group. Only 6 haplotypes were shared between the two sample groups and none between haplogroups. Of the 156 haplotypes, 133 (85%) were individual-specific, while the rest were shared by 2 to 27 individuals. As expected for these fast-mutating markers, a high genetic diversity was found in the Indian populations with values between 0.97 and 1 (SE <± 0.06) among the different castes. A similar range was also seen among the Vaishyas, Sudras and Panchamas from the Jaunpur district, but it decreased to 0.83 (SE ±0.06) in the Jaunpur Brahmins and to 0.73 (SE ±0.07) in Jaunpur Kshatriyas. These last two results are particularly striking since they are the lowest ever described using such a large number of microsatellites (Qamar et al. 2002; Xue et al. 2006; Zerjal et al. 2002).
To quantify the patterns of genetic variation among castes further, we calculated summary statistics and applied other methods of analysis to reveal features of the structure within each population, concentrating on microsatellite data because of their freedom from ascertainment bias (Table 2, Figures 2, 3 and 4). Low-diversity castes showed low θk values (less than 10) indicating a smaller male effective population size (Helgason et al. 2000b). The θk statistic also allows us to investigate the effect of the small sample sizes on our conclusions (Helgason et al. 2000a). We calculated the expected number of haplotypes after sampling to saturation (the point at which increasing the sample size by 10 is expected to add less than one new haplotype). The result (Table 2) shows that sampling is incomplete, even in Jaunpur, but that the expected number of haplotypes in a lower caste such as the Panchamas is similar (to within a factor of two) when Jaunpur and the rest of India are compared, but very different (by a factor of 18) when an upper caste such as the Brahmins is examined. A concordant result was also obtained when a Bayesian approach which models both mutational and demographic processes, implemented in the program BATWING (Wilson et al. 2003), was used to estimate effective population sizes of the different castes as described (Xue et al. 2006). With this method the Brahmins and the Kshatriyas from Jaunpur again showed the smallest effective population sizes (Table 2, Na). To measure the mutational distance between all pairs of haplotypes within castes, we calculated Average Squared Distance (ASD) values. Most castes showed ASD values greater than 145; however, the Brahmins and the Kshatriyas from Jaunpur were exceptions to this pattern, with values of 92 and 30 respectively (Table 2). Cumulative numbers of pairwise differences were used to compare the amount of genetic variation between haplotypes for all the castes. The Brahmins and the Kshatriyas from Jaunpur showed outstandingly low numbers of pairwise differences compared to the rest of the castes (Figure 2).
TABLE 2.
Population Statistics based on Microsatellite data
| Castes | θk | N of samples | N of haplotypes | Adjusted N of samples | Expected N of haplotypes | Na | ASD | |
|---|---|---|---|---|---|---|---|---|
| INDIA | Brahmins (I-B) | 125 | 17 | 16 | 1114 | 283 | 2900 (690-6500) | 187 |
| Kshatriyas (I-K) | ∞ | 19 | 19 | – | – | 1790 (200-5300) | 146 | |
| Sudras (I-S) | ∞ | 23 | 23 | – | – | 1300 (180-5600) | 179 | |
| Panchamas (I-P) | 50 | 19 | 16 | 445 | 113 | 2600 (630-5400) | 182 | |
| JAUNPUR | Brahmins (J-B) | 7.3 | 20 | 10 | 65 | 16 | 800 (370-1700) | 92 |
| Kshatriyas (J-K) | 9.1 | 47 | 17 | 81 | 21 | 690 (300-1400) | 30 | |
| Vaishyas (J-V) | 81 | 39 | 32 | 721 | 184 | 2300 (270-5200) | 150 | |
| Panchamas (J-P) | 30 | 28 | 20 | 267 | 68 | 2500 (870-4900) | 172 |
Figure 2.
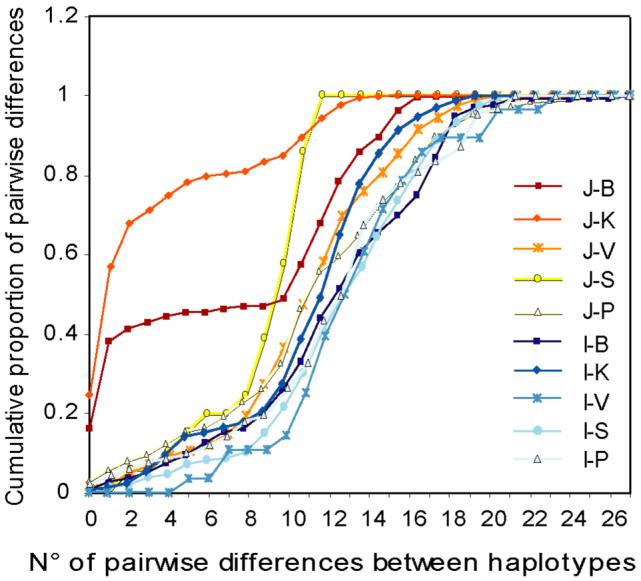
Cumulative pairwise differences between microsatellite haplotypes within each caste. The caste samples are indicated by the same colours as in Figure 1: from Jaunpur, Brahmins (J-B), Kshatriyas (J-K), Vaishyas (J-V), Sudras (J-S) and Panchamas (J-P); from the rest of India, Brahmins (I-B), Kshatriyas(I-K), Vaishyas (I-V), Sudras (I-S) and Panchamas (I-P).
Figure 3.
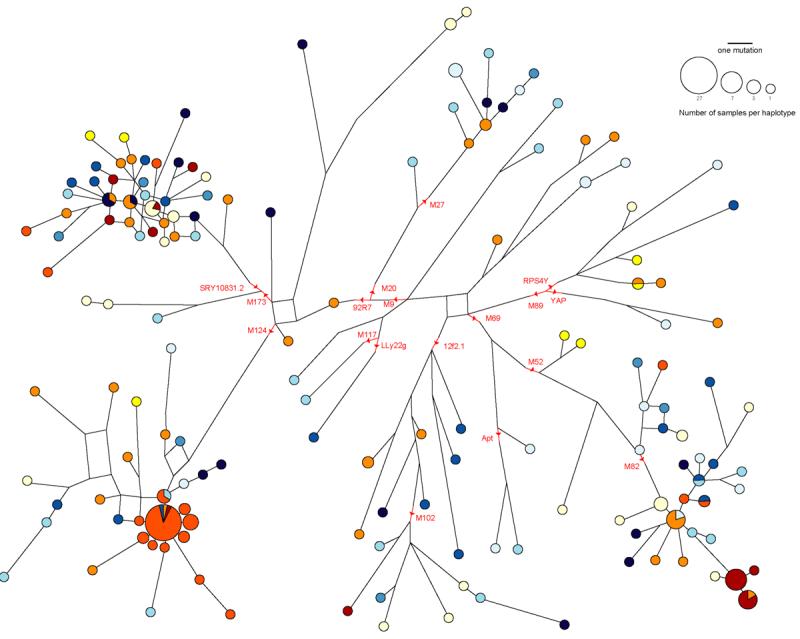
Median-joining network for all the microsatellite haplotypes found in this study. Binary marker data are also included. Circles represent haplotypes and the size is proportional to the number of chromosomes; the color scheme is the same as in Figure 1. Each line represents a mutational step and parallel lines refer to identical mutational events. Red lines represent binary marker mutations.
Figure 4.
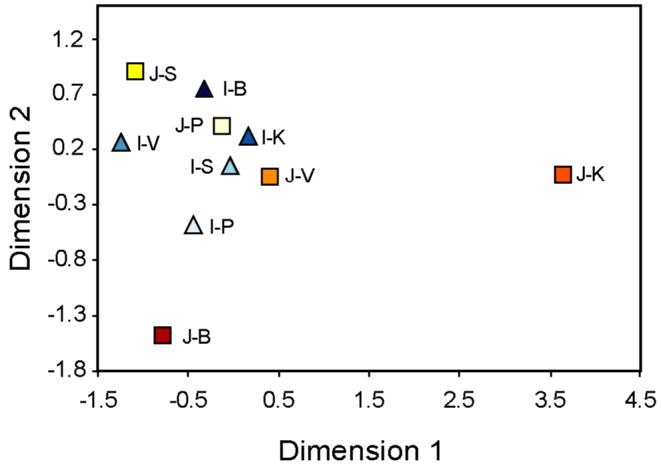
MDS analysis of population pairwise RST values based on microsatellite haplotypes. The color scheme and abbreviations are the same as in Figures 1 and 2. The stress value was 0.17.
To visualize the haplotype variation within each caste, we constructed a median-joining network from combined binary and microsatellite data using the program Network (version 4.1.1.1) (Bandelt et al. 1999) (Figure 3). Two star-shaped clusters stand out. The most striking one lies among haplogroup R2 chromosomes (M124-derived; lower left corner of the network). In this cluster, the central haplotype is present at high frequency (12% of the entire sample set) and contains mostly (24/27) Jaunpur Kshatriya samples. The surrounding haplotypes (one step away) also belong mainly to this population, while the more distant haplotypes are from a variety of castes from both Jaunpur and India. The second cluster in the network lies in haplogroup H1* (derived for M82; lower right corner of the network) and consists almost entirely of Jaunpur Brahmin chromosomes (13/15) distributed among three haplotypes. These star-like patterns are informative because they are, for neutrally evolving loci like the Y chromosome, the genetic signature of population bottleneck or founder events followed by drift and population expansion (Xue et al. 2005; Zerjal et al. 2002; Zerjal et al. 2003). It thus appears that in the Jaunpur district such events must have occurred, but only in the Brahmins and Kshatriyas. It is interesting to note that most of the samples in the Kshatriya cluster belong to the Chandel community. An oral tradition in the community claims that they are descendants of a king named Ajhuraj who moved in the Jaunpur area about 400 years ago, providing possible historical support for the genetic evidence of a founder event in this caste. The existence of a haplotype cluster that is highly specific for the Jaunpur Kshatriyas allows the recognition of likely gene flow from this caste to others in the same area, from the sharing of this cluster of lineages. We estimated the TMRCA (mean ± SD) for the Kshatriya cluster using the program Network 4.1.1.2 with the ‘evolutionary’ mutation rate proposed by Zhivotovsky et al. (Zhivotovsky et al. 2004). Since the shape of the genealogy is not known, we calculated minimum and maximum numbers of meioses corresponding to late or early branching. Assuming that each chromosome from this lineage in another caste represented a single gene flow event, we estimated the rate of Y-chromosomal movement out of the Kshatriyas at 0.7% per generation (0.104%-1.48%), somewhat lower than previously proposed rates (Wooding et al. 2004).
Microsatellite haplotype frequencies and their molecular distances were used to calculate the molecular variance (Analysis of Molecular Variance, AMOVA) within and between castes (Excoffier et al. 1992), and population pairwise genetic distances (Rst) (Slatkin 1995). When all castes were pooled together in one group, a substantial fraction of variability (14.5%, P<0.0001) was due to differences among castes. This value is higher than those described in previous studies with smaller number of Y binary markers (Basu et al. 2003), suggesting a stronger genetic differentiation among the populations examined here. However the “among castes variation” dropped to 1.2% (_P_>0.05) if the Brahmins and the Kshatriyas from Jaunpur were removed from the calculation. This analysis leads to two important conclusions. First, the majority of the genetic structuring is indeed restricted to the Jaunpur upper castes (Brahmins and the Kshatriyas); second, the other castes are not significantly different from one another by this measure. We displayed the pairwise RST values obtained from haplotype data as an MDS (Multi-Dimensional Scaling) plot (Figure 4). The Brahmins and the Kshatriyas from Jaunpur appear as outliers, while the rest of the castes are quite tightly grouped. Within this group, however, no clustering is evident, either according to caste or distinguishing the Jaunpur from the Indian samples. We performed the same analysis of molecular variance using haplogroup frequencies and pairwise ΦST values. The results (not shown) were similar to Figure 4, showing that consistent conclusions can be obtained using different markers.
Conclusions
Four main conclusions can be drawn from these combined findings. First, the Jaunpur district shows a marked reduction in genetic diversity when compared to the rest of India, but this reduction is restricted to the upper castes and is not detectable in the other castes. Second, the Brahmins and Kshatriyas from Jaunpur show a high level of genetic substructuring that is most probably the combined result of a founder effect and social stratification, rather than geography or other factors that are shared by the different castes. Third, Y-chromosomal gene flow between castes was low, <1% per generation. Fourth, no evident genetic differentiation was seen in the other Jaunpur castes, perhaps due to larger population sizes, greater gene flow among them, or a combination of these factors.
Are these features unique to the Jaunpur district or might we expect similar local genetic patterns in other parts of India? The Jaunpur district was selected for this study for reasons unconnected to its genetic makeup, which had not been investigated prior to this work. It seems likely that the stronger substructuring of the Jaunpur upper castes is a consequence of social ranking and is therefore not unique to the Jaunpur district, but is rather a common feature in India. Indeed, the observations of Basu et al. (2003) of higher FST values among upper castes than lower castes, and a lack of clustering according to caste in neighbour-joining trees, may reflect the same phenomenon. However, its full extent has not been revealed before because most studies have used samples collected from broader areas, and may contribute to the conflicting conclusions reached by different studies about the genetic contribution accompanying the establishment of the caste system (e.g. compare Basu et al. 2003; Cordaux et al. 2004; Sengupta et al. 2006). In the process, local differences would have been blended into heterogeneous caste groups characterized by high genetic variability and a lack of the genetic substructure seen in the present study. We conclude that, despite its very large size, the Indian Hindu population is better regarded as a highly substructured set of separate populations with limited gene flow among them than as a single population.
Acknowledgements
We thank all sample donors for participating in this project, and Kamal Bagai for help with sample collection. We also thank Ed Southern for his interest and contribution to this work, Yali Xue with advice on data analysis and Denise Carvalho-Silva for comments on the manuscript. TZ and CTS are supported by The Wellcome Trust.
References
- Ayub Q, Mohyuddin A, Qamar R, Mazhar K, Zerjal T, Mehdi SQ, Tyler-Smith C. Identification and characterisation of novel human Y-chromosomal microsatellites from sequence database information. Nucleic Acids Res. 2000;28:e8. doi: 10.1093/nar/28.2.e8. [DOI] [PMC free article] [PubMed] [Google Scholar]
- Bamshad M, Kivisild T, Watkins WS, Dixon ME, Ricker CE, Rao BB, Naidu JM, Prasad BV, Reddy PG, Rasanayagam A, Papiha SS, Villems R, Redd AJ, Hammer MF, Nguyen SV, Carroll ML, Batzer MA, Jorde LB. Genetic evidence on the origins of Indian caste populations. Genome Res. 2001;11:994–1004. doi: 10.1101/gr.173301. [DOI] [PMC free article] [PubMed] [Google Scholar]
- Bandelt HJ, Forster P, Röhl A. Median-joining networks for inferring intraspecific phylogenies. Mol Biol Evol. 1999;16:37–48. doi: 10.1093/oxfordjournals.molbev.a026036. [DOI] [PubMed] [Google Scholar]
- Basu A, Mukherjee N, Roy S, Sengupta S, Banerjee S, Chakraborty M, Dey B, Roy M, Roy B, Bhattacharyya NP, Roychoudhury S, Majumder PP. Ethnic India: a genomic view, with special reference to peopling and structure. Genome Res. 2003;13:2277–2290. doi: 10.1101/gr.1413403. [DOI] [PMC free article] [PubMed] [Google Scholar]
- Cavalli-Sforza LL, Menozzi P, Piazza A. The History and Geography of Human Genes. Princeton University Press; Princeton, New Jersey, USA: 1994. [Google Scholar]
- Cordaux R, Aunger R, Bentley G, Nasidze I, Sirajuddin SM, Stoneking M. Independent origins of Indian caste and tribal paternal lineages. Curr Biol. 2004;14:231–235. doi: 10.1016/j.cub.2004.01.024. [DOI] [PubMed] [Google Scholar]
- Excoffier L, Smouse PE, Quattro JM. Analysis of molecular variance inferred from metric distances among DNA haplotypes: application to human mitochondrial DNA restriction data. Genetics. 1992;131:479–491. doi: 10.1093/genetics/131.2.479. [DOI] [PMC free article] [PubMed] [Google Scholar]
- Helgason A, Sigurðardóttir S, Gulcher JR, Stefánsson K, Ward R. Sampling saturation and the European mtDNA pool: implications for detecting genetic relationships among populations. In: Renfrew C, Boyle K, editors. Archaeogenetics: DNA and the population prehistory of Europe. McDonald Institute for Archaeological Research; Cambridge, UK: 2000a. pp. 285–294. [Google Scholar]
- Helgason A, Sigurðardóttir S, Nicholson J, Sykes B, Hill EW, Bradley DG, Bosnes V, Gulcher JR, Ward R, Stefánsson K. Estimating Scandinavian and Gaelic ancestry in the male settlers of Iceland. Am J Hum Genet. 2000b;67:697–717. doi: 10.1086/303046. [DOI] [PMC free article] [PubMed] [Google Scholar]
- Jobling MA, Tyler-Smith C. The human Y chromosome: an evolutionary marker comes of age. Nature Reviews Genetics. 2003;4:598–612. doi: 10.1038/nrg1124. [DOI] [PubMed] [Google Scholar]
- Kivisild T, Rootsi S, Metspalu M, Mastana S, Kaldma K, Parik J, Metspalu E, Adojaan M, Tolk HV, Stepanov V, Golge M, Usanga E, Papiha SS, Cinnioglu C, King R, Cavalli-Sforza L, Underhill PA, Villems R. The genetic heritage of the earliest settlers persists both in Indian tribal and caste populations. Am J Hum Genet. 2003;72:313–332. doi: 10.1086/346068. [DOI] [PMC free article] [PubMed] [Google Scholar]
- Majumder PP. People of India: biological diversity and affinities. Evol Anthropol. 1998;6:100–110. [Google Scholar]
- Nei M. Molecular Evolutionary Genetics. Colombia University Press; New York: 1987. [Google Scholar]
- Pandya A. Human Y-chromosomal DNA variation. University of Oxford; 1997. D.Phil. thesis. [Google Scholar]
- Paracchini S, Arredi B, Chalk R, Tyler-Smith C. Hierarchical high-throughput SNP genotyping of the human Y chromosome using MALDI-TOF mass spectrometry. Nucleic Acids Res. 2002;30:e27. doi: 10.1093/nar/30.6.e27. [DOI] [PMC free article] [PubMed] [Google Scholar]
- Qamar R, Ayub Q, Mohyuddin A, Helgason A, Mazhar K, Mansoor A, Zerjal T, Tyler-Smith C, Mehdi SQ. Y-chromosomal DNA variation in Pakistan. Am J Hum Genet. 2002;70:1107–1124. doi: 10.1086/339929. [DOI] [PMC free article] [PubMed] [Google Scholar]
- Rosser ZH, Zerjal T, Hurles ME, Adojaan M, Alavantic D, Amorim A, Amos W, Armenteros M, Arroyo E, Barbujani G, Beckman G, Beckman L, Bertranpetit J, Bosch E, Bradley DG, Brede G, Cooper G, Corte-Real HB, de Knijff P, Decorte R, Dubrova YE, Evgrafov O, Gilissen A, Glisic S, Golge M, Hill EW, Jeziorowska A, Kalaydjieva L, Kayser M, Kivisild T, Kravchenko SA, Krumina A, Kucinskas V, Lavinha J, Livshits LA, Malaspina P, Maria S, McElreavey K, Meitinger TA, Mikelsaar AV, Mitchell RJ, Nafa K, Nicholson J, Norby S, Pandya A, Parik J, Patsalis PC, Pereira L, Peterlin B, Pielberg G, Prata MJ, Previdere C, Roewer L, Rootsi S, Rubinsztein DC, Saillard J, Santos FR, Stefanescu G, Sykes BC, Tolun A, Villems R, Tyler-Smith C, Jobling MA. Y-chromosomal diversity in Europe is clinal and influenced primarily by geography, rather than by language. Am J Hum Genet. 2000;67:1526–1543. doi: 10.1086/316890. [DOI] [PMC free article] [PubMed] [Google Scholar]
- Sengupta S, Zhivotovsky LA, King R, Mehdi SQ, Edmonds CA, Chow CE, Lin AA, Mitra M, Sil SK, Ramesh A, Usha Rani MV, Thakur CM, Cavalli-Sforza LL, Majumder PP, Underhill PA. Polarity and temporality of high-resolution Y-chromosome distributions in India identify both indigenous and exogenous expansions and reveal minor genetic influence of Central Asian pastoralists. Am J Hum Genet. 2006;78:202–221. doi: 10.1086/499411. [DOI] [PMC free article] [PubMed] [Google Scholar]
- Slatkin M. A measure of population subdivision based on microsatellite allele frequencies. Genetics. 1995;139:457–462. doi: 10.1093/genetics/139.1.457. [DOI] [PMC free article] [PubMed] [Google Scholar]
- Thapar R. A History of India. One. Penguin Books; London: 1990. [Google Scholar]
- Thomas MG, Bradman N, Flinn HM. High throughput analysis of 10 microsatellite and 11 diallelic polymorphisms on the human Y-chromosome. Hum Genet. 1999;105:577–581. doi: 10.1007/s004399900181. [DOI] [PubMed] [Google Scholar]
- Wilson IJ, Weale ME, Balding DJ. Inferences from DNA data: population histories, evolutionary processes and forensic match probabilities. Journal of the Royal Statistical Society: Series A (Statistics in Society) 2003;166:155–188. [Google Scholar]
- Wolpert S. A New History of India. Fifth Edition Oxford University Press; Oxford: 1997. [Google Scholar]
- Wooding S, Ostler C, Prasad BV, Watkins WS, Sung S, Bamshad M, Jorde LB. Directional migration in the Hindu castes: inferences from mitochondrial, autosomal and Y-chromosomal data. Hum Genet. 2004;115:221–229. doi: 10.1007/s00439-004-1130-x. [DOI] [PubMed] [Google Scholar]
- Xue Y, Zerjal T, Bao W, Zhu S, Lim SK, Shu Q, Xu J, Du R, Fu S, Li P, Yang H, Tyler-Smith C. Recent spread of a Y-chromosomal lineage in northern China and Mongolia. Am J Hum Genet. 2005;77:1112–1116. doi: 10.1086/498583. [DOI] [PMC free article] [PubMed] [Google Scholar]
- Xue Y, Zerjal T, Bao W, Zhu S, Shu Q, Xu J, Du R, Fu S, Li P, Hurles ME, Yang H, Tyler-Smith C. Male demography in East Asia: a north-south contrast in human population expansion times. Genetics. 2006;172:2431–2439. doi: 10.1534/genetics.105.054270. [DOI] [PMC free article] [PubMed] [Google Scholar]
- Zerjal T, Wells RS, Yuldasheva N, Ruzibakiev R, Tyler-Smith C. A genetic landscape reshaped by recent events: Y-chromosomal insights into central Asia. Am J Hum Genet. 2002;71:466–482. doi: 10.1086/342096. [DOI] [PMC free article] [PubMed] [Google Scholar]
- Zerjal T, Xue Y, Bertorelle G, Wells RS, Bao W, Zhu S, Qamar R, Ayub Q, Mohyuddin A, Fu S, Li P, Yuldasheva N, Ruzibakiev R, Xu J, Shu Q, Du R, Yang H, Hurles ME, Robinson E, Gerelsaikhan T, Dashnyam B, Mehdi SQ, Tyler-Smith C. The genetic legacy of the Mongols. Am J Hum Genet. 2003;72:717–721. doi: 10.1086/367774. [DOI] [PMC free article] [PubMed] [Google Scholar]
- Zhivotovsky LA, Underhill PA, Cinnioglu C, Kayser M, Morar B, Kivisild T, Scozzari R, Cruciani F, Destro-Bisol G, Spedini G, Chambers GK, Herrera RJ, Yong KK, Gresham D, Tournev I, Feldman MW, Kalaydjieva L. The effective mutation rate at Y chromosome short tandem repeats, with application to human population-divergence time. Am J Hum Genet. 2004;74:50–61. doi: 10.1086/380911. [DOI] [PMC free article] [PubMed] [Google Scholar]