Medial temporal lobe atrophy on MRI scans and the diagnosis of Alzheimer disease (original) (raw)
Abstract
Background:
Despite convenience, accessibility, and strong correlation to severity of Alzheimer disease (AD) pathology, medial temporal lobe atrophy (MTA) has not been used as a criterion in the diagnosis of prodromal and probable AD.
Methods:
Using a newly validated visual rating system, mean MTA scores of three bilateral medial temporal lobe structures were compared for subjects with no cognitive impairment (NCI) (n = 117), nonamnestic mild cognitive impairment (MCI) (n = 46), amnestic MCI (n = 45), and probable AD (n = 53). Correlations between MTA scores and neuropsychological test scores at baseline, and predictors of change in diagnosis at 1-year follow-up were evaluated.
Results:
With NCI as the reference group, a mean MTA cut score of 1.33 yielded an optimal sensitivity/specificity of 85%/82% for probable AD subjects and 80%/82% for amnestic MCI subjects. MTA and Clinical Dementia Rating Sum of Boxes scores at baseline were independent and additive predictors of diagnosis at baseline, and of transition from NCI to MCI or from MCI to dementia at 1-year follow-up.
Conclusion:
Medial temporal lobe atrophy (MTA) scores 1) distinguish probable Alzheimer disease (AD) and amnestic mild cognitive impairment (MCI) subjects from nonamnestic MCI and no cognitive impairment (NCI) subjects, 2) help predict diagnosis at baseline, and 3) predict transition from NCI to MCI and from MCI to probable AD. MTA scores should be used as a criterion in the clinical diagnosis of AD.
GLOSSARY
AD = Alzheimer disease; ADRDA = Alzheimer's Disease and Related Disorders Association; aMCI = amnestic mild cognitive impairment; ANOVA = analysis of variance; CDRSB = Clinical Dementia Rating Sum of Boxes; ERC = entorhinal cortex; FADRC-CC = Florida Alzheimer's Disease Research Center–Clinical Core; HPC = hippocampus; HR = hazard ratio; MCI = mild cognitive impairment; MMSE = Mini-Mental State Examination; MTA = medial temporal lobe atrophy; MTL = medial temporal lobe; NACC = National Alzheimer's Coordinating Center; naMCI = nonamnestic mild cognitive impairment; NCI = no cognitive impairment; NINCDS = National Institute of Neurological and Communicative Disorders and Stroke; NS = not significant; PRC = perirhinal cortex; VRS = visual rating system.
Structural MRI studies in subjects diagnosed with Alzheimer disease (AD) or mild cognitive impairment (MCI) consistently show atrophy in the entorhinal cortex (ERC) and hippocampus (HPC).1,2 Atrophy in the ERC and HPC on MRI scans predicts future cognitive decline and conversion to AD among individuals with MCI.3–5 Severity of medial temporal atrophy (MTA) assessed with MRI scans is strongly associated with severity of medial temporal degenerative pathology at autopsy.6–10 It has been suggested that MRI volumetry may surpass clinical evaluation in accuracy as a diagnostic tool.8
Despite considerable evidence that brain MRI provides important diagnostic information about AD, structural MRI has been used almost exclusively to exclude conditions other than AD that are known to cause cognitive impairment. Scheltens et al.11,12 developed a visual rating system to grade the severity of atrophy in the medial temporal lobe (MTL), which distinguishes AD and normal elderly control subjects in a clinical setting. This system has been used to predict progression from MCI to dementia in subjects diagnosed with prodromal AD.12
We have developed a visual rating system (VRS)13 that expands the scope and utility of the Scheltens system and provides reliable ratings of individual MTL structures, i.e., HPC, ERC, and perirhinal cortex (PRC). VRS is portable, does not require specialized software or hardware for image analyses, and is easy to learn. The goal of this study was to validate and extend these initial findings in a larger and more diverse group of subjects.
METHODS
Subject recruitment.
Subjects (n = 261) were recruited 1) from the Wien Center for Alzheimer's Disease and Memory Disorders at Mount Sinai Medical Center, Miami Beach, Florida, and 2) by advertisement from the community. From these two sources, the majority of subjects (n = 235) were ultimately enrolled into the Florida Alzheimer's Disease Research Center–Clinical Core (FADRC-CC) in Miami and Tampa, Florida. The Mount Sinai Medical Center Institutional Review Board approved this study, and all subjects or a legal representative gave informed consent.
Subject evaluation.
All subjects in this study had 1) a full clinical history; 2) a neurologic evaluation; 3) the Mini-Mental State Evaluation14 (MMSE; an MMSE score of 20 or greater was required to enter this study); 4) a neuropsychological test battery,15 according to the National Alzheimer's Coordinating Center (NACC) protocol (http://www.alz.washington.edu/), and Three Trial Fuld Object Memory Evaluation,16 Hopkins Verbal Learning Test,17 and Stroop Color–Word Test18 (the 16 subjects who did not participate in the FADRC-CC had an abbreviated battery of tests); 5) the Clinical Dementia Rating Scale19; 6) an MRI brain scan; and 7) standard blood tests according to the NACC for dementia workup.
Diagnostic classification.
FADRC-CC consensus diagnosis followed the NACC protocols. Diagnosis of probable AD was made according to National Institute of Neurological and Communicative Disorders and Stroke (NINCDS)–Alzheimer's Disease and Related Disorders Association (ADRDA) criteria for AD.20 The diagnosis of amnestic MCI (aMCI) was made according to Petersen criteria.21 A diagnosis of prodromal AD was used for subjects with aMCI, who were evaluated at the Wien Center and on the basis of the history and clinical findings met NINCDS–ADRDA criteria for probable AD, with the exception that they were not considered to have dementia. Diagnosis of no cognitive impairment (NCI) required that the informants reported “no decline in cognition,” and no cognitive test scores were 1.5 SD or more below age- and education-corrected means. Nonamnestic MCI (naMCI) diagnosis required that no memory test scores were less than 1.5 SD below education-corrected normative values, but one or more nonmemory test scores were 1.5 SD or more below normative values.
Longitudinal evaluation procedures.
Data from annual reevaluations (retention rate for 1-year follow-up = 91%), which included all initial evaluation procedures except MRI brain scans and blood tests, were used for consensus follow-up diagnoses. A total of 232 subjects were reevaluated and rediagnosed at the scheduled 1-year follow-up evaluation.
MRI procedures.
Brain MRI scans were obtained on a 1.5-tesla MRI machine using proprietary three-dimensional magnetization-prepared rapid-acquisition gradient echo (Siemens) or the three-dimensional spoiled gradient recalled echo (General Electric) sequences; MRI scans were acquired in the coronal plane, and contiguous slices with thickness of 1.5 mm or less were reconstructed.
Visual rating system.
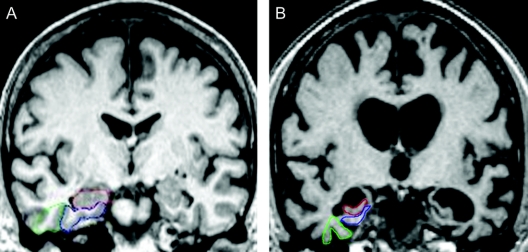
VRS incorporates the following features: 1) Coronal slices are selected using well-delineated landmarks, such as midpoints of anterior and posterior commissures, or mammillary bodies (AC, PC, and MB slices). 2) Atrophy of the HPC, ERC, and PRC is rated visually on a single coronal slice (the MB slice), which intersects the mammillary bodies. 3) To increase reliability of VRS measurements and to provide a training module for prospective raters, VRS uses drop-down reference images that delineate the outline of each anatomic region of interest and provide exemplars of all the degrees of atrophy included in a 0 to 4 scale, for rating atrophy of individual structures (figure 1). Atrophy scores for ERC, HPC, and PRC, individually and in combination, distinguished subjects diagnosed with probable AD and aMCI from subjects with NCI.13 VRS promotes standardization of ratings, facilitates continuing training of raters, and prevents reliability drift over time. For this study, three average scores for three bilateral structures, i.e., HPC, ERC, and PRC, on each side was calculated as the medial temporal atrophy (MTA) score. We have previously reported that excellent interrater reliability for individual MTL structures has been obtained with κ values among two raters ranging between 0.75 and 0.94 for interrater reliability 0.87 and 0.93 for intrarater reliability.13 Two MRI scans (less than 1% of the total) were rejected from this study because they had sufficient movement or positioning artifact to compromise reliable VRS ratings.
Figure 1 Visual rating system for assessing medial temporal atrophy
(A) The three regions of interest are outlined in the right hemisphere in color (hippocampus = red; entorhinal cortex = blue; perirhinal cortex = green), all showing no atrophy (score = 0) in both hemispheres. (B) All structures have severe atrophy (score = 4), with the exception of the right perirhinal cortex, which has moderate atrophy.
Statistical analyses.
Group comparisons of atrophy scores were analyzed using a series of one-way analyses of variance (ANOVAs). The Scheffé post hoc procedure was used to examine differences between means; Pearson product–moment correlation coefficients evaluated the strength of relationships between atrophy scores and cognitive measures. Receiver operator curve analyses determined sensitivity and specificity of various MTA cut points for distinguishing between diagnostic groups. Hazard ratios (HRs) for specific predictors of transition from NCI to MCI, MCI to NCI, and MCI to probable AD (endpoint) were calculated using a three-state Markov model22 in continuous time. The proportional intensity model was used to analyze effects of covariates on HRs.
RESULTS
Demographics.
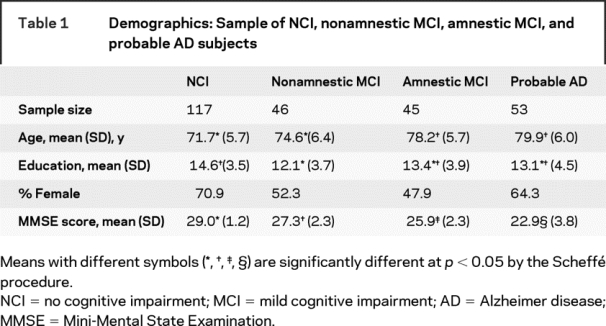
Among the cross-sectional study participants (table 1) there were significant differences between NCI, aMCI, naMCI prodromal AD, and AD subjects with regard to age (F[3,253] = 29.07, p < 0.001), education (F[3,235] = 4.87, _p_ < 0.01), sex (χ2[_df_ = 3] = 9.83, _p_ < 0.03), and MMSE scores (F[3,248] = 85.32, _p_ < 0.001), but not language (χ2[_df_ = 5] = 5.43, _p_ > 0.14). Using Scheffé post hoc tests of means, NCI and naMCI subjects were found to be younger, relative to subjects in other diagnostic groups. The mean educational level of naMCI subjects was lower than that of NCI, but not of aMCI or probable AD subjects. NCI subjects had the highest average MMSE scores (29.0; SD = 1.2), followed by naMCI (27.3; SD = 2.3), aMCI (25.9; SD = 2.3), and finally probable AD subjects (22.9; SD = 3.8). The NCI group had a higher percentage of women, in comparison with the aMCI group.
Table 1 Demographics: Sample of NCI, nonamnestic MCI, amnestic MCI, and probable AD subjects
Comparison of NCI, nonamnestic MCI, amnestic MCI, and probable AD subjects, using MTA scores (cross-sectional study).
Highly significant differences in left and right MTA scores between NCI, aMCI, and AD groups were observed, after adjusting for the effects of age, for individual HPC, ERC, PRC, and MTA scores on the right and left sides (table 2 and figure 2). Left MTA scores for NCI subjects (0.48 ± 0.6; 95% CI 0.37–0.59) and naMCI subjects (0.57 ± 0.5; 95% CI 0.41–0.74) were not different, whereas aMCI subjects had intermediate values (1.88 ± 1.0; 95% CI 1.57–2.19), between naMCI and AD subjects (2.45 ± 1.1; 95% CI 2.14–2.77). Similar results were obtained for right mean MTA scores and for right and left mean HPC, ERC, and PRC scores (table 2).
Table 2 Medial temporal lobe atrophy scores in different diagnostic groups (cross-sectional study)
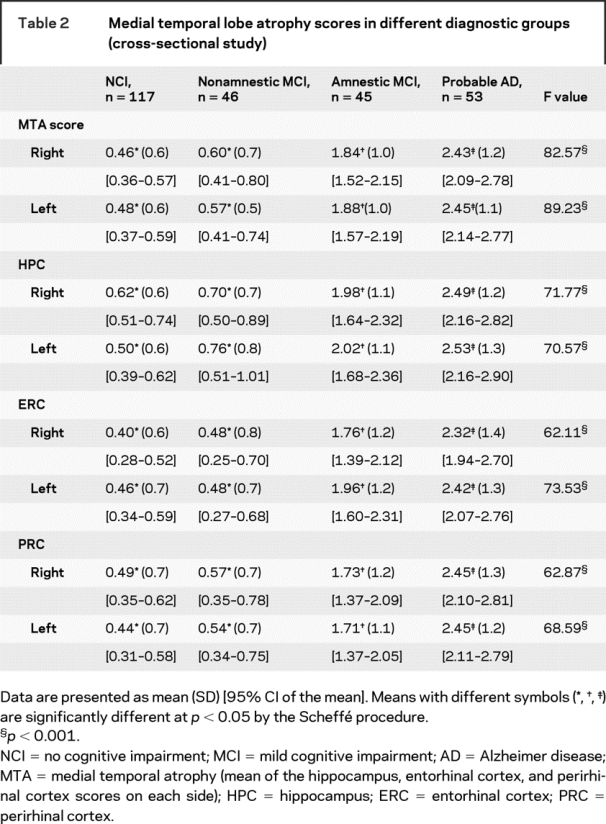
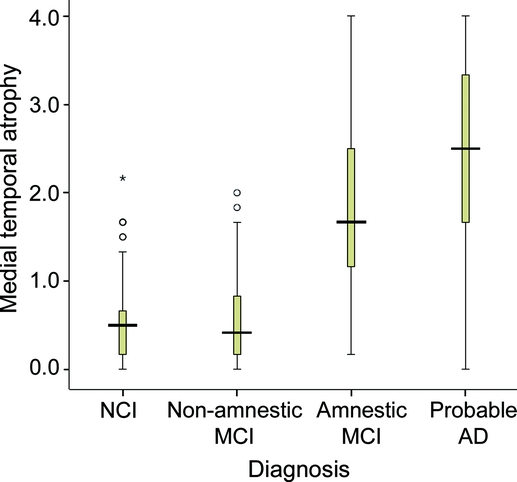
Figure 2 Medial temporal atrophy from visual rating system vs clinical diagnosis
Box plot of medial temporal atrophy score (average of left and right) for subjects diagnosed with no cognitive impairment (NCI), nonamnestic mild cognitive impairment (MCI), amnestic MCI, and probable Alzheimer disease (AD). The median visual rating system score is represented by a horizontal line within the shaded box. The top and bottom of the box represent the 75th and 25th percentiles. The lines that extend out the top and bottom are 1.5 times the interquartile range (IQR) (value of 75th minus 25th percentile) above and below the box. Open circles are outliers (1.5–3 times the IQR above the box). The asterisk is an extreme outlier (more than 3 times the IQR above the box).
MTA scores distinguished NCI, aMCI, and AD groups, even after adjusting for age affect. Point biserial correlations for left and right MTA and diagnostic group, in NCI vs aMCI and AD comparisons, were 0.56 and 0.54 after age adjustment and 0.64 and 0.65 before age adjustment. In NCI vs AD comparisons, point biserial correlations for left and right MTA and diagnostic group were 0.66 and 0.63 after age adjustment and 0.75 and 0.74 before age adjustment. Only 3.4% of NCI subjects had mean left MTA scores within the 95% CI of scores for probable AD patients, and 11% had scores that overlapped with the 95% CI of aMCI subjects.
Sensitivity and specificity of VRS in differentiating probable AD, amnestic MCI, and NCI subjects.
To simulate the behavior of clinicians, who typically use the most informative test or biomarker for diagnosis, we used the most abnormal atrophy rating from any of three bilateral medial temporal structures in each subject for classification. Using a score of 2 or greater, either the right or the left HPC provided the optimal sensitivity/specificity of 71%/88% for NCI vs aMCI and 81%/88% for NCI vs probable AD. Using an optimal cut point of 1.33 for either the right or left MTA score (which is the average score across three structures on each side) provided a sensitivity/specificity of 82%/82% for NCI vs aMCI and 85%/82% for NCI vs probable AD (table e-1 on the _Neurology_® Web site at www.neurology.org).
Diagnosis of NCI, aMCI, and probable AD using MTA and CDRSB scores in the cross-sectional study.
Clinical Dementia Rating Sum of Boxes (CDRSB) scores were available for 74% of subjects. Stepwise logistic regression determined the contribution of left MTA and CDRSB in predicting a clinical diagnosis of aMCI (i.e., clinic patients with amnestic impairment who otherwise fulfilled all the criteria for probable AD, except that they did not have dementia) vs NCI group membership. A similar stepwise logistic regression model was used to examine the contribution of right MTA and CDRSB to diagnostic accuracy. It was found that both left and right MTA scores provided significant additive predictive power, to CDRSB alone, to distinguish aMCI from NCI. CDRSB alone provided a correct classification of 83.9%, with a significant increase to 87.1% by the addition of left MTA scores and 89.6% by the addition of right MTA scores. For probable AD vs NCI comparisons, CDRSB scores alone provided a correct classification rate of 98.4%, with a significant increase to 99.2% by the addition of left MTA scores, but no increase with the addition of right MTA scores.
Use of MTA to predict transition in diagnosis at 1-year follow-up.
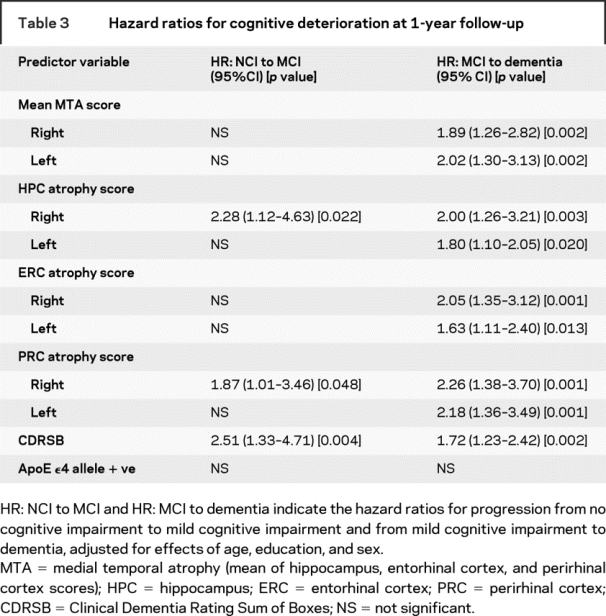
Transition from NCI to aMCI or naMCI was predicted by right HPC and PRC atrophy scores, whereas right and left MTA, as well as bilateral HPC, ERC, and PRC atrophy scores, were significant predictors of cognitive deterioration from any form of MCI to dementia (e.g., HR for transition from MCI to dementia for left MTA score = 2.02 [CI 1.30–3.13]; p = 0.002). Using the median score (0.33) for MTA scores in all subjects in this study as the cut score, 5.6% of subjects with right MTA scores at or below 0.33, whereas 30.6% of those with right MTA scores of 0.66 or greater transitioned from MCI to dementia at 1-year follow-up (p = 0.002). Similar results were obtained with the left MTA scores. ApoE ɛ4 allele was not a significant predictor, whereas CDRSB score predicted transition at 1 year from NCI to MCI (HR = 2.51 [CI 1.33–4.71]; p = 0.004) and from MCI to dementia (HR = 1.72 [CI 1.23–2.42]; p = 0.002), accounting for age, sex, and education. Evaluating CDRSB and left MTA scores in the same ANOVA, CDRSB (HR = 1.96 [CI 1.32–2.92]) and left MTA scores (HR = 1.79 [CI 1.01–3.17]) independently remained significant predictors of transition from MCI to dementia after accounting for the effects of age, sex, and education. Similar results were obtained for the right MTA and CDRSB scores, demonstrating that CDRSB and MTA scores are independent predictors of transition from MCI to dementia.
DISCUSSION
This study demonstrates a high level of correspondence between MTA scores assessed by VRS and cognitive impairment that is most frequently caused by AD pathology. As the clinical syndrome progressed from NCI and naMCI to aMCI and probable AD, MTA scores progressively increased (figure 2 and table 2). Some overlap in MTA scores between NCI, aMCI, and probable AD subjects may be expected because of clinical diagnostic errors, presence of AD pathology in cognitively normal elderly indivduals,23,24 or limitations in specificity and sensitivity of the VRS method. MTA scores also predicted cognitive decline among NCI and MCI subjects, who were reevaluated after a 1-year interval.
The advent of disease-modifying treatments for AD has made an earlier diagnosis of AD increasingly important,25 and aMCI26 in the presence of clinically significant MTA could serve as the basis for a diagnosis of prodromal AD. Approximately 40% of aMCI subjects in community studies27–29 and 5% in clinic-based studies30 revert to a cognitively normal state. Inclusion of MTA measurements could improve ability to predict which aMCI subjects are most likely to progress to AD31 and which are least likely to revert to NCI. The results of this study demonstrate that sufficient accuracy may be achieved for individual cases (as in the clinic) by using a cut score of 2 or greater for the right or left HPC to support a diagnosis of AD (table 2 and table e-1). However, the greater range of scores and the higher sensitivity achieved by using the MTA score (at a cut score of 1.33 or higher) would be advantageous for studying groups of subjects in research studies. Similarly, atrophy of either HPC (especially the right side) could provide clinically important information regarding the likelihood of progression from NCI to MCI or from MCI to AD (table 3).
Table 3 Hazard ratios for cognitive deterioration at 1-year follow-up
When either left- or right-sided MTA scores were entered in regression models, both MTA and CDRSB scores were found to be independent predictors of the clinical diagnosis of prodromal AD. The right MTA score combined with the CDRSB scores improved overall correct classification by nearly 6 percentage points. As expected, the CDRSB alone performed very well for distinguishing probable AD from NCI, correctly classifying more than 98% of the subjects. Although addition of left MTA scores to CDRSB provided a significant improvement in classification, it did not seem to be clinically important. Measurement of MTA by VRS and the Scheltens method12 provide similar results, although VRS is predictive of a diagnosis of aMCI vs NCI at a cut score of 1.33, whereas the Scheltens method distinguishes NCI from AD when MTA scores are dichotomized as 2 or less or more than 2 on a 0 to 4-point scale.12,23
Current criteria for the clinical diagnosis of AD, which require presence of dementia and exclusion of non-Alzheimer causes but do not require presence of an AD biomarker,20,25 show fairly high sensitivity but suboptimal specificity for the pathologic diagnosis of AD.24,32–36 Presence of AD pathology in the brain, years or even decades before the first manifestations of the disease,23,35,36 may explain the high sensitivity of the clinical diagnosis. The low specificity of clinical diagnostic criteria for AD may be explained by 1) difficulty in distinguishing AD from many non-AD dementias37,38 and 2) misclassification as NCI of individuals with substantial AD pathology in the brain, who nevertheless may be able to compensate cognitively because of high cognitive reserve.37,38
Because MTA on MRI scans has been found to correlate with severity of AD-related neuropathologic changes in the medial temporal lobe at postmortem examination,7,8 the severity of MTA may serve as a biomarker of the disease, enabling an earlier and more accurate clinical diagnosis of AD.26 Currently, MRI scans are part of the routine workup of memory disorders, for the purpose of excluding such pathologies as hydrocephalus, vascular, inflammatory or demyelinating, and space-occupying lesions as the cause of the cognitive syndrome. The results of the current study suggest that MRI scans could also be used for confirming the presence of AD pathology and serve as a predementia and even a preclinical marker of AD. Absence of MTA in a subject with a clinical diagnosis of AD, as well as presence of MTA in a subject diagnosed with a benign or non-AD form of memory or cognitive disorder, may alert the clinician about the accuracy of the clinical diagnosis of the patient. Thus, measurement of MTA on MRI scans by VRS could be a clinically useful method of improving both sensitivity and specificity of a clinical diagnosis of probable and prodromal AD.
Our results suggest that measurement of MTA using VRS, which could readily be incorporated into the routine assessment of patients presenting with memory symptoms, will likely assist in strengthening the diagnosis of AD or ruling it out, among subjects with dementia and even aMCI. Limitations of VRS methodology should be recognized: 1) ratings are based on assessments performed on a single coronal slice, thereby providing a limited perspective of overall brain pathology; and 2) atrophy in the medial temporal regions may not be specific to AD, but in some cases may be indicative of hippocampal sclerosis, frontotemporal lobar dementias, Lewy body dementia, vascular dementia, or cognitive impairment.7,10 Nevertheless, the presence of other characteristic MRI and clinical features and the relatively low prevalence of some of these non-AD diagnoses should result in infrequent misclassification of these disorders as AD. The high prevalence of AD among the elderly, in combination with the characteristic clinical presentation and MRI features described in this report, should result in improved clinical diagnostic accuracy of AD, even at an early or prodromal clinical stage.
AUTHOR CONTRIBUTIONS
Statistical analysis was performed by D.A.L.
Supplementary Material
[Data Supplement]
Received July 11, 2008. Accepted in final form September 15, 2008.
Address correspondence and reprint requests to Dr. Ranjan Duara, Wien Center for Alzheimer's Disease, Mount Sinai Medical Center, 4300 Alton Rd., Miami Beach, FL 33140 ranjan-duara@msmc.com
Supplemental data at www.neurology.org
Supported by 1P50AG025711-01 from the National Institute of Aging and by a grant from the Byrd Alzheimer Center and Research Institute.
Disclosure: The authors report no disclosures.
REFERENCES
- 1.Du AT, Schuff N, Amend D, et al. Magnetic resonance imaging of the entorhinal cortex and hippocampus in mild cognitive impairment and Alzheimer's disease. J Neuro Neurosurg Psychiatry 2001;71:441–447. [DOI] [PMC free article] [PubMed] [Google Scholar]
- 2.Killiany RJ, Hyman BT, Gomez-Isla T, et al. MRI measures of entorhinal cortex versus hippocampus in preclinical AD. Neurology 2002;58:1188–1196. [DOI] [PubMed] [Google Scholar]
- 3.Jack CR, Petersen RC, Xu YC, et al. Prediction of AD with MRI-based hippocampal volume in mild cognitive impairment. Neurology 1999;52:1397–1403. [DOI] [PMC free article] [PubMed] [Google Scholar]
- 4.Jack CR Jr, Petersen RC, Xu Y, et al. Rates of hippocampal atrophy correlate with change in clinical status in aging and AD. Neurology 2000;55:484–489. [DOI] [PMC free article] [PubMed] [Google Scholar]
- 5.Rusinek H, Endo Y, De Santi S, et al. Atrophy rate in medial temporal lobe during progression of Alzheimer disease. Neurology 2004;63:2354–2359. [DOI] [PubMed] [Google Scholar]
- 6.Bobinski M, de Leon MJ, Wegiel J, et al. The histological validation of post mortem magnetic resonance imaging-determined hippocampal volume in Alzheimer's disease. Neuroscience 2000;95:721–725. [DOI] [PubMed] [Google Scholar]
- 7.Jack CR, Dickson DW, Parisi JE, et al. Antemortem MRI findings correlate with hippocampal neuropathology in typical aging and dementia. Neurology 2002;58:750–757. [DOI] [PMC free article] [PubMed] [Google Scholar]
- 8.Gosche KM, Mortimer JA, Smith CD, Markesbery WR, Snowdon DA. Hippocampal volume as an index of Alzheimer neuropathology: findings from the Nun Study. Neurology 2002;58:1476–1482. [DOI] [PubMed] [Google Scholar]
- 9.Likeman M, Anderson VM, Stevens JM, et al. Visual assessment of atrophy on magnetic resonance imaging in the diagnosis of pathologically confirmed young-onset dementias. Arch Neurol 2005;62:1410–1415. [DOI] [PubMed] [Google Scholar]
- 10.Barkhof F, Polvikoski TM, van Straaten EC, et al. The significance of medial temporal lobe atrophy: a postmortem MRI study in the very old. Neurology 2007;69:1521–1527. [DOI] [PubMed] [Google Scholar]
- 11.Wahlund LO, Julin P, Johansson SE, Scheltens P. Visual rating and volumetry of the medial temporal lobe on magnetic resonance imaging in dementia: a comparative study. J Neurol Neurosurg Psychiatry 2000;69:630–635. [DOI] [PMC free article] [PubMed] [Google Scholar]
- 12.DeCarli C, Frisoni GB, Clark CM, et al. Qualitative estimates of medial temporal atrophy as a predictor of progression from mild cognitive impairment to dementia. Arch Neurol 2007;64:108–115. [DOI] [PubMed] [Google Scholar]
- 13.Urs R, Potter E, Barker W, Appel J, Loewenstein DA, Zhao W, Duara D. Visual rating system (VRS) for assessing magnetic resonance images (MRIs): a tool in the diagnosis of MCI and Alzheimer's disease. J Comput Assist Tomogr (in press). [DOI] [PubMed]
- 14.Folstein M, Folstein S, McHugh P. Mini-Mental State: a practical method for grading the cognitive state of patients for the physician. J Psychiatr Res 1975;12:189–198. [DOI] [PubMed] [Google Scholar]
- 15.Loewenstein DA, Barker WW, Harwood DG, et al. Utility of a modified mini-mental state examination with extended delayed recall in screening for mild cognitive impairment and dementia among community dwelling elders. Int J Geriatr Psychiatry 2000;15:434–440. [DOI] [PubMed] [Google Scholar]
- 16.Fuld PA. Fuld Object-Memory Evaluation. Wood Dale, IL: Stoelting Co.; 1981. [Google Scholar]
- 17.Lacritz LH, Cullum CM, Weiner M, Rosenberg RN. Comparison of the Hopkins Verbal Learning Test Revised to the California Verbal Learning Test in Alzheimer's disease. Appl Neuropsychol 2001;8:180–184. [DOI] [PubMed] [Google Scholar]
- 18.Golden JC. Stroop Color and Word Test. Chicago, IL: Stoelting Co.; 1978. [Google Scholar]
- 19.Morris JC. The Clinical Dementia Rating (CDR): current version and scoring rules. Neurology 1993;43:2412–2414. [DOI] [PubMed] [Google Scholar]
- 20.McKhann G, Drachman DA, Folstein MF, Katzman R, Price DL, Stadlan E. Clinical diagnosis of Alzheimer's disease: report of the NINCDS-ADRDA Work Group under the auspices of the Department of Health and Human Services Task Force on Alzheimer's Disease. Neurology 1984;34:939–944. [DOI] [PubMed] [Google Scholar]
- 21.Petersen RC, Smith GE, Waring SC, Ivnik RJ, Tangalos EG, Kokmen E. Mild cognitive impairment: clinical characterization and outcome. Arch Neurol 1999;56:303–308. [DOI] [PubMed] [Google Scholar]
- 22.Sonnenberg FA, Beck JR. Markov models in medical decision making: a practical guide. Med Decis Making 1993;13:322–338. [DOI] [PubMed] [Google Scholar]
- 23.Scheltens P, Leys D, Barkhof F, et al. Atrophy of medial temporal lobes on MRI in “probable” Alzheimer's disease and normal ageing: diagnostic value and neuropsychological correlates J Neurol Neurosurg Psychiatry 1992;55:967–72. [DOI] [PMC free article] [PubMed] [Google Scholar]
- 24.Crystal H, Dickson D, Fuld P, et al. Clinico-pathologic studies in dementia: nondemented subjects with pathologically confirmed Alzheimer's disease. Neurology 1988;38:1682–1687. [DOI] [PubMed] [Google Scholar]
- 25.Fleisher AS, Raman R, Siemers ER, et al. Phase 2 safety trial targeting amyloid beta production with a gamma-secretase inhibitor in Alzheimer disease. Arch Neurol 2008;65:1031–1038. [DOI] [PMC free article] [PubMed] [Google Scholar]
- 26.Petersen RC, Doody R, Kurz A, et al. Current concepts in mild cognitive impairment. Arch Neurol 2001;58:1985–1992. [DOI] [PubMed] [Google Scholar]
- 27.Ganguli M, Dodge HH, Shen C, DeKosky ST. Mild cognitive impairment, amnestic type: an epidemiologic study. Neurology 2004;63:115–121. [DOI] [PubMed] [Google Scholar]
- 28.Ritchie K, Artero S, Touchon J. Classification criteria for mild cognitive impairment: a population-based validation study. Neurology 2001;56:37–42. [DOI] [PubMed] [Google Scholar]
- 29.Pérès K, Chrysostome V, Fabrigoule C, Orgogozo JM, Dartigues JF, Barberger-Gateau P. Restriction in complex activities of daily living in MCI: impact on outcome. Neurology 2006;67:461–466. [DOI] [PubMed] [Google Scholar]
- 30.Luis CA, Barker WW, Loewenstein DA, et al. Conversion to dementia among two groups with cognitive impairment. Dement Geriatr Cogn Disord 2004;18:307–313. [DOI] [PubMed] [Google Scholar]
- 31.de Leon MJ, DeSant S, Zinkowski R, et al. Key Symposium: MRI and CSF studies in the early diagnosis of Alzheimer's disease. J Intern Med 2004;256:205–223. [DOI] [PubMed] [Google Scholar]
- 32.Lopez OL, Litvan I, Catt KE, et al. Accuracy of four clinical diagnostic criteria for the diagnosis of neurodegenerative dementias. Neurology 1999;53:1292–1299. [DOI] [PubMed] [Google Scholar]
- 33.Lopez OL, Becker JT, Klunk W, et al. Research evaluation and diagnosis of probable Alzheimer's disease over the last two decades. Neurology 2000;55:1854–1862. [DOI] [PubMed] [Google Scholar]
- 34.Nagy Z, Esiri MM, Hindley NJ, et al. Accuracy of clinical operational diagnostic criteria for Alzheimer's disease in relation to different pathological diagnostic protocols. Dement Geriatr Cogn Disord 1998;9:219–226. [DOI] [PubMed] [Google Scholar]
- 35.Braak H, Braak E. Neuropathological staging of Alzheimer related changes. Acta Neuropathologica (Berl) 1991;82:239–259. [DOI] [PubMed] [Google Scholar]
- 36.Silverman W, Wisniewski HM, Bobinski M, Wegiel J. Frequency of stages of Alzheimer-related lesions in different age categories. Neurobiol Aging 1997;18:377–379. [DOI] [PubMed] [Google Scholar]
- 37.Stern Y. Cognitive reserve and Alzheimer disease. Alzheimer Dis Assoc Disord 2006;20:112–117. [DOI] [PubMed] [Google Scholar]
- 38.Mortimer JA, Borenstein AR, Gosche KM, Snowdon DA. Very early detection of Alzheimer neuropathology and the role of brain reserve in modifying its clinical expression. J Geriatr Psychiatry Neurol 2005;18:218–223. [DOI] [PMC free article] [PubMed] [Google Scholar]
Associated Data
This section collects any data citations, data availability statements, or supplementary materials included in this article.
Supplementary Materials
[Data Supplement]
