Stim1 and Orai1 Mediate CRAC Currents and Store-Operated Calcium Entry Important for Endothelial Cell Proliferation (original) (raw)
. Author manuscript; available in PMC: 2009 May 21.
Abstract
Recent breakthroughs in the store-operated Calcium (Ca2+) entry (SOCE) pathway have identified Stim1 as the endoplasmic reticulum (ER) Ca2+ sensor and Orai1 as the pore forming subunit of the highly Ca2+ selective CRAC channel expressed in hematopoietic cells. Previous studies however, have suggested that endothelial cell (EC) SOCE is mediated by the non-selective Canonical Transient Receptor Potential (TRPC) channel family, TRPC1 or TRPC4. Here we show that passive store depletion by thapsigargin or receptor activation by either thrombin or the vascular endothelial growth factor (VEGF) activates the same pathway in primary EC with classical SOCE pharmacological features. EC possess the archetypical Ca2+ release-activated Ca2+ current (ICRAC), albeit of a very small amplitude. Using a maneuver that amplifies currents in divalent free bath solutions, we show that EC CRAC has similar characteristics to that recorded from RBL cells, namely a similar time course of activation, sensitivity to 2-Aminoethoxydiphenyl borate (2-APB) and low concentrations of lanthanides, and large Na+ currents displaying the typical depotentiation. RNA silencing of either Stim1 or Orai1 essentially abolished SOCE and ICRAC in EC which were rescued by ectopic expression of either Stim1 or Orai1, respectively. Surprisingly, knockdown of either TRPC1 or TRPC4 proteins had no effect on SOCE and ICRAC. Ectopic expression of Stim1 in EC increased their ICRAC to a size comparable to that in RBL cells. Knockdown of Stim1, Stim2 or Orai1 inhibited EC proliferation and caused cell cycle arrest at S and G2/M phase, although Orai1 knockdown was more efficient than that of Stim proteins. These results are first to establish the requirement of Stim1/Orai1 in the endothelial SOCE pathway.
Keywords: Orai1, Stim1, Endothelial cell proliferation, SOC channels, CRAC currents
INTRODUCTION
Store-operated calcium (Ca2+) entry (SOCE) is a common and ubiquitous mechanism of regulating Ca2+ influx into cells. In virtually all cell types depletion of endoplasmic reticulum (ER) Ca2+ content, using sarcoplasmic/ER Ca2+ ATPase (SERCA) inhibitors such as thapsigargin, activates SOCE1, 2. Under physiological conditions SOCE is initiated by inositol (1,4,5) trisphosphate (IP3)-mediated depletion of ER Ca2+ in response to a plethora of stimuli acting through Phospholipase C (PLC)-coupled receptors. The best characterized SOC current is the Ca2+-release-activated Ca2+ current (ICRAC) first recorded in RBL mast cells3, and later described in other cell types4. SOCE is necessary for the replenishment of ER Ca2+ content and is a key regulator of many Ca2+-dependent physiological processes (for review see4). Recently, high throughput RNA silencing (siRNA) screens by several laboratories have identified two molecules, Stim1 and Orai1 as key components of the ICRAC pathway in mast cells, lymphocytes and HEK293 cells 5-8. Upon ER Ca2+ depletion, Ca2+-sensing Stim1 proteins translocate to close proximity of the plasma membrane, where they aggregate into multiple puncta. Strikingly, Orai1 molecules also translocate to the same Stim1-containing structures upon store depletion where they open to mediate Ca2+ influx (for review, see 9-12).
In endothelial cells (ECs), SOCE in response to passive store depletion was reported for several EC types, including HUVECs13, bovine/rabbit aorta 14, 15 and bovine pulmonary artery 16. The electrophysiological profile of the SOC conductance in ECs is unclear with an early study reporting small (less than 0.5 pA/pF at -80mV) Ca2+ selective ICRAC-like currents17 and others describing larger currents (over 5pA/pF at -80mV) 18, 19. Studies reporting endothelial ICRAC are very scarce likely due to extremely low current densities (~6-10 times lower than those reported in Jurkat or RBL cells17). The molecular composition of the SOC channels in many cell types, and in ECs in particular, remains a highly controversial topic. Several studies have proposed members of the transient receptor potential canonical family, either TRPC1 18-22 or TRPC4 23-25 to mediate SOCE in ECs. However, it is not clear how non-selective TRPC channels can encode the highly Ca2+ selective ICRAC. In the light of the recent discovery of Stim1 and Orai1 as key players in ICRAC in mast cells and lymphocytes, we evaluated their involvement in endothelial SOCE and their contribution to EC proliferation. We show that: i) store depletion in ECs activates the highly Ca2+ selective SOC current, ICRAC that displays similar electrophysiological characteristics to that recorded from RBL cells; ii) SOCE and ICRAC in ECs are inhibited by low concentrations of lanthanides and by 2-Aminoethoxydiphenyl borate (2-APB); iii) SOCE and ICRAC are mediated by Stim1 and Orai1, while TRPC1 and TRPC4 are not involved; iv) the small ICRAC in ECs is due to low levels of Stim1 in these cells. Stim1 overexpression generated ICRAC of similar amplitude to that recorded in RBL cells, demonstrating that Stim1 is limiting in ECs and explaining the sporadic success in reliably recording these currents in the past; v) knockdown of Stim1 and Orai1 markedly reduced EC proliferation by inducing cell cycle arrest at S and G2/M phase.
MATERIALS AND METHODS
Experiments were performed using standard protocols. Please refer to supplementary material for details of these protocols along with list of reagents, drugs, media and solutions.
RESULTS
HUVEC and HPAEC exhibit classical SOCE
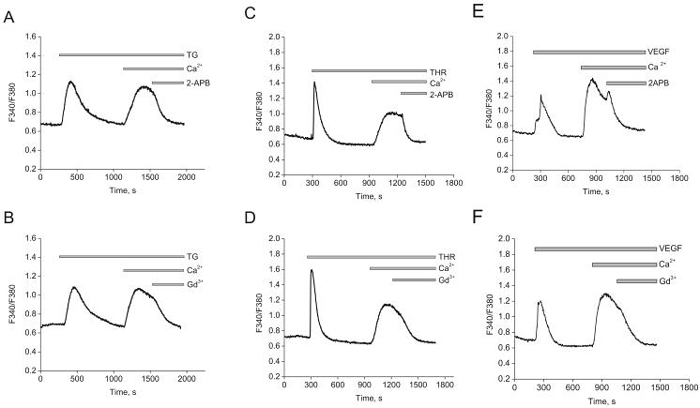
To characterize pharmacological properties of SOCE in ECs, we used Fura-2 Ca2+ imaging and thapsigargin (2μmol/L) to activate SOCE. In the absence of extracellular Ca2+ thapsigargin induces a passive Ca2+ leak from the ER (Figure 1). When Ca2+ was restored to the bath, Ca2+ entry through SOC channels occurred. thapsigargin-induced SOCE was completely inhibited by low concentrations of lanthanides (10μmol/L Gd3+) or by 30μmol/L 2-APB, reminiscent of SOCE in HEK29326 (Figure 1A, B).
Figure 1. Thapsigargin activates SOCE in HUVECs.
A and B, store depletion by 2μmol/L thapsigargin (TG) induces SOCE that is inhibited by 30μmol/L 2-APB (A)and 10 μmol/L Gd3+ (B).C and D, thrombin (100nmol/L) induces SOCE and is inhibited by similar concentrations of 2-APB (C) and Gd3+ (D).E and F, Similar results were obtained with VEGF (100ng/mL). Data in each panel is an average of 4-12 cells and representative of at least 3 independent experiments.
Physiological stimuli acting through Phospholipase C (PLC)-coupled receptors also activate SOCE in ECs. Thrombin, stimulating a G protein-coupled receptor, and vascular endothelial growth factor (VEGF), operating through a receptor tyrosine kinase, activate isoforms of PLC and cause IP3-mediated Ca2+ store depletion. Application of 100nmol/L thrombin elicited fast and transient cytosolic Ca2+ release from the ER (Figure 1C, D). Re-introduction of extracellular Ca2+ induced typical SOCE that was blocked by Gd3+ and 2-APB. Pre-incubation with the same concentrations of Gd3+ and 2-APB induced a complete block of SOCE (supplementary Figure 2). Similar results were obtained when HUVEC were stimulated by 100ng/mL of VEGF (Figure 1E, F). Similar results were obtained with another primary EC type; SOCE in human pulmonary artery ECs (HPAEC) induced by either thrombin or thapsigargin had the same pharmacological profile (Supplementary Figure 3). We conclude that thapsigargin and PLC-coupled agonists activates SOCE with similar characteristics.
ICRAC in HUVECs
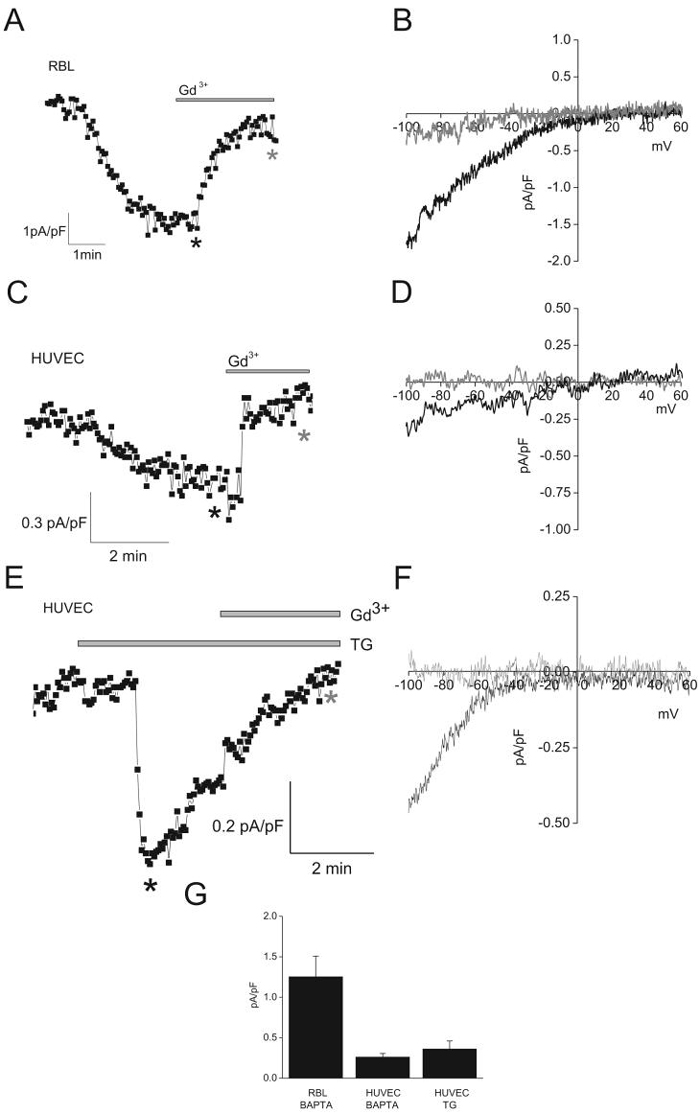
ICRAC have a unique set of electrophysiological features that are easily distinguishable from other Ca2+ currents4. These currents are very inwardly rectifying, are inhibited by low concentrations of lanthanides (1-10μmol/L Gd3+), potentiated by low concentrations of 2-APB (5μmol/L) and inhibited by higher concentrations (30-50μmol/L 2-APB). ICRAC is highly Ca2+ selective and is negatively regulated by cytosolic Ca2+. A standard method for ICRAC activation in whole-cell mode is intracellular dialysis by high concentrations of the pH-independent, fast Ca2+ chelator BAPTA27. As previously shown3, passive store depletion by BAPTA led to the activation of typical ICRAC in RBL cells with a magnitude of 1.25±0.25pA/pF at -100mV (n=5). This current was inhibited by low concentrations of Gd3+ (10μmol/L; Figure 2A, B). Similar inward currents, although of a much smaller magnitude, developed upon intracellular dialysis of HUVECs by BAPTA (0.26±0.04pA/pF at -100mV, n=5; Figure 2C, D), or extracellular application of thapsigargin (0.36±0.1pA/pF at -100mV, n=4; Figure 2E, F). These currents were also inhibited by Gd3+ (Figure 2C, E). Figure 2G shows a statistical comparison of the amplitudes of ICRAC in RBL and those in HUVEC.
Figure 2. ICRAC in HUVEC and RBL cells.
A and C, ICRAC activation upon intracellular dialysis with BAPTA in RBL and HUVEC, respectively. E, ICRAC activation upon extracellular application of thapsigargin (TG; 2μmol/L). Ramps from -100mV to +60mV were taken every 3sec, and data points from each ramp were taken at -100mV and plotted. B, D and F, representative ramps taken at time points marked by asterisks in A, C and E, respectively. Black asterisks, before application of Gd3+; grey asterisks, after application of 10μmol/L Gd3+. G, Statistical analysis of maximal current values at -100mV.
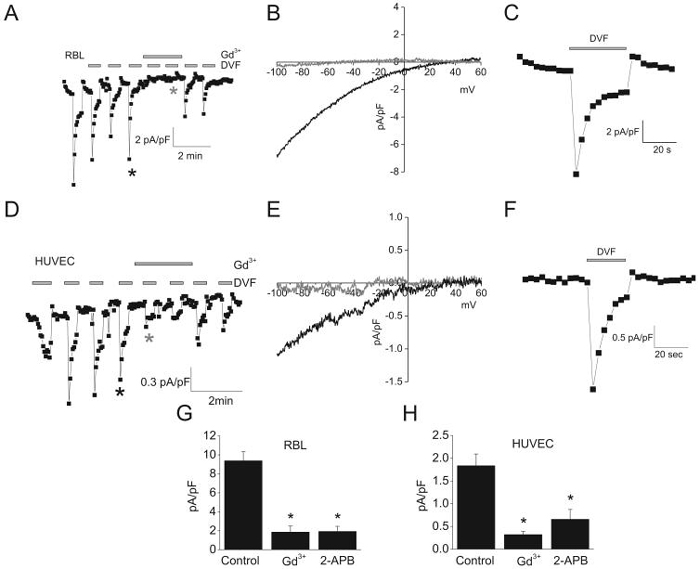
Given the small size of ICRAC in HUVECs, we sought to amplify its magnitude by performing whole cell patch clamp in divalent-free (DVF) bath solutions. In DVF conditions, ICRAC readily conducts Na+, mediating a significantly bigger conductance28-30. These large Na+ currents exhibit the unique property of being fast-inactivating over tens of seconds, a process called depotentiation31. Switching to DVF solution in RBL cells induced large (9.5±1.3pA/pF at -100mV, n=6), Gd3+-sensitive, 2-APB-sensitive and rapidly-inactivating inward Na+ currents (Figure 3A, B, G). Using this protocol in HUVECs we observed a relatively large (1.2±0.3pA/pF at -100mV, n=5) Na+ inward-current with I/V relationship typical of ICRAC (Figure 3D, E). As expected, these Na+ currents were blocked by Gd3+ and 2-APB (Figure 3D, E, H). In HUVECs however, we observed a small remaining linear current (0.50pA/pF ± 0.09 at -100mV; n=9) that was insensitive to Gd3+, representing possibly a leak current (see I/V relationship before and after subtraction in supplementary figure 4A). In addition, Na+-currents in both RBL and HUVECs showed the typical depotentiation characteristic of ICRAC30 (Figure 3A, D; for close-ups see Figure 3C, F). We conclude that HUVECs display the archetypical ICRAC, identical to that found in RBL but of a much smaller density (~ 6-fold smaller than RBL).
Figure 3. ICRAC in DVF conditions.
A and D, Na+ currents recorded in response to repetitive pulses (~ every min) of DVF bath solutions in RBL and HUVEC, respectively. After whole cell mode, ramps from -100mV to +60mV were applied, and data points taken at -100mV and plotted. 10μmol/L Gd3+ was added where indicated. B and E, representative ramps of DVF-induced Na+ currents in RBL (B) and HUVEC (E). Ramps shown were taken at time points indicated by asterisks in A and D, respectively. C and F, close-up of DVF-induced Na+ currents (black asterisks in A and D) in RBL and HUVEC. G and H, mean values of maximal Na+ currents at -100 mV before, after application of 10 μmol/L Gd3+ and 30 μmol/L 2-APB in RBL (G) and HUVEC (H).
Molecular players of SOCE in HUVECs
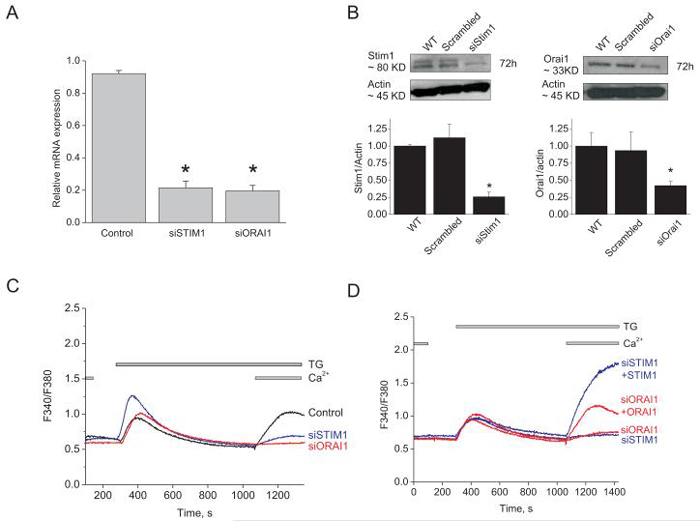
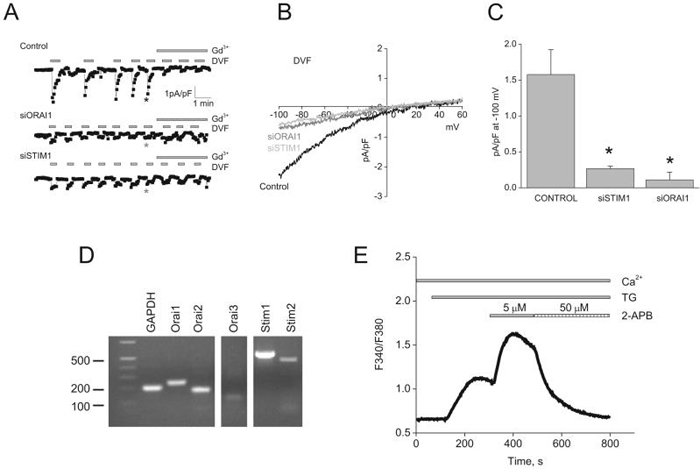
Recent studies have identified two conserved genes that are required for SOCE in lymphocytes, mast cells and HEK293 cells, Stim1 and Orai15-8, 32, 33. Stim1 is the Ca2+ sensor in the ER that somehow signals the activation of Orai1, a pore-forming subunit of the SOC channel. However, most studies on ECs have suggested either TRPC1 or TRPC4 as SOC channel components. We used siRNA to assess the involvement of Stim1, Orai1, TRPC1 and TRPC4 in endothelial SOC. Knockdown of either Stim1 or Orai1 in HUVECs was achieved using 2 different shRNA and 2 different siRNA sequences (supplementary table) used individually. SiRNA sequences induced a marked decrease in their target mRNA levels (76.6%±2.09 for Stim1 #1 and 78.6%±3.63 for Orai1 #1; n=3; Figure 4A). SiRNA against either Stim1 or Orai1 lead to 74.2%±6.6 and 58.0%±5.7 decrease in Stim1 and Orai1 proteins levels, respectively, as assessed by western blotting (figure 4B). This is likely an underestimation of the knockdown at the single cell level since transfection efficiency of siRNA in HUVEC is unlikely 100%. We assessed the off targets effect of Stim1 and Orai1 siRNA sequences on the mRNA of TRPC1, TRPC4, Stim2, Orai2 and Orai3. As expected, siRNA targeting either Stim1 or Orai1 induced a decrease in their respective mRNA with no statistically significant effect on other genes (Supplementary Figure 4B, C).
Figure 4. SOCE in HUVECs is mediated by Stim1 and Orai1.
A, quantitative PCR data showing decreased expression of Orai1 and Stim1 mRNA in silenced cells compared to control cells (scrambled siRNA), 72 hrs post-transfection (n=3; one way ANOVA, *p<0.05). B, Western blots and densitometry showing significant down-regulation of Stim1 (left) and Orai1 (right) proteins 72 hrs after siRNA transfection. C, Stim1 and Orai1 knockdown inhibits SOCE in response to thapsigargin. D, SOCE in Stim1- and Orai1-silenced cells can be rescued by overexpression of eYFP-Stim1 and CFP-Orai1, respectively. All traces shown represent average data from 7-25 cells from at least 3 independent experiments.
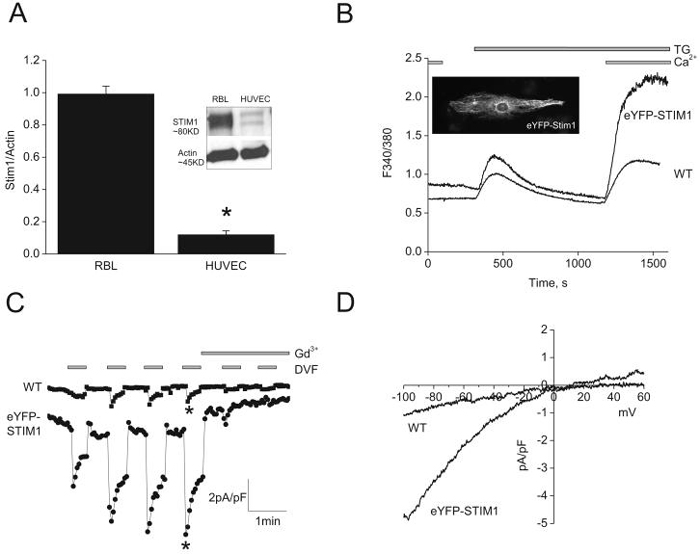
Interestingly, down-regulation of either Stim1 or Orai1 using siRNA significantly suppressed both thapsigargin- (Figure 4C) and thrombin- (not shown, but see figure 4B) induced SOCE in HUVECs. SOCE was greatly reduced when transfecting cells with siRNA against either Stim1 or Orai1 (data shown for siStim1#1 and siOrai1#1; representative of two independent siRNA sequences) by comparison to cells transfected with a scrambled control siRNA (Figure 4C). Similar results were obtained using two shRNA sequences used independently (Supplementary Figure 5A, B). Similar results were obtained when knockdown of either Stim1 or Orai1 was achieved in HPAEC (Supplementary Figure 5C). Furthermore, the effect of Stim1 or Orai1 down-regulation on SOCE was successfully rescued by ectopic expression of either eYFP-Stim1 or CFP-Orai1, respectively (Figure 4D). Surprisingly, during this rescue experiment, expression of eYFP-Stim1 yielded a much greater SOCE compared to CFP-Orai1. This result implies that in HUVECs the level of Stim1 proteins is limiting; this in fact turned out to be the case as described later.
We determined the effect of Stim1 and Orai1 siRNA on membrane currents activated by store depletion using whole cell patch clamp. As expected in scrambled control siRNA-transfected cells, store depletion activated ICRAC in DVF conditions that were sensitive to 10μM Gd3+ (Figure 5A). Either Stim1 or Orai1 silencing by siRNA led to a dramatic reduction of ICRAC densities, although Orai1 was somewhat more efficient (scrambled siRNA, 1.57±0.34pA/pF; siStim1, 0.26±0.03pA/pF; siOrai1, 0.11±0.1pA/pF at -100mV; n=3; Figure 5A, C). Figure 5B shows typical I/V relationship of ICRAC recorded in DVF bath solutions from control cells and from cells transfected with either siStim1 or siOrai1.
Figure 5. Stim1 and Orai1 mediate ICRAC in HUVECs.
A, siRNA against either Stim1 or Orai1 in HUVECs greatly reduced ICRAC recorded under DVF conditions compared to control scrambled siRNA-transfected cells. B, representative ramps taken at time points indicated by asterisks in A. C, Summary of the whole-cell data recorded from control-, Stim1- and Orai1-siRNA transfected HUVECs. D, mRNA expression of Stim and Orai isoforms in HUVECs. E, Ca2+ imaging showing thapsigargin-activated SOCE, its potentiation with 5μmol/L 2-APB and subsequent inhibition by 50μmol/L 2-APB; trace is average of 22 cells and representative of 4 independent experiments. (one way ANOVA, *p<0.05).
HUVECs also express mRNA encoding Orai2 and Orai3 (figure 5D) and it is therefore possible that these 2 proteins contribute subunits to a heteromultimeric SOC channel in HUVECs. We found that thapsigargin-activated SOCE in HUVECs resembles that in HEK293 and RBL cells: it is potentiated by low concentrations of 2-APB (5μmol/L) and inhibited by high concentrations (50μmol/L); Only Orai1 possess this peculiar characteristic34, arguing against an involvement of Orai2 and Orai3.
Small SOCE and ICRAC in HUVECs due to limiting Stim1 levels
Figure 4D suggested that the very small densities of ICRAC in HUVECs could be due to limiting levels of Stim1. Western blots analysis showed that Stim1 protein levels in HUVECs are approximately 8-fold less than those of RBL cells (Figure 6A), providing a possible explanation for the smaller ICRAC in HUVECs. Indeed, eYFP-Stim1 overexpression in HUVECs was verified by fluorescence microscopy showing typical fibrillar staining (Inset in Figure 6B) and by western blotting (Supplementary Figure 6) and shown to induce a large increase in SOCE and ~5.7-fold increase in ICRAC densities at -100mV (6.89±0.5pA/pF, n=3 versus 1.2±0.3pA/pF for control, n=5; Figure 6C, D). These data strongly suggest that Stim1 is the limiting factor for SOCE and ICRAC in ECs.
Figure 6. Small ICRAC in HUVECs are due to low expression levels of Stim1.
A, western blots showing low Stim1 protein levels in HUVECs compared with RBL cells. Ectopic expression of 1μg of eYFP-Stim1 cDNA plasmid (B; see inset) in HUVECs dramatically increased SOCE (B) and ICRAC (C). D, Representative ramps of ICRAC in wild type (WT) and eYFP-Stim1-expressing HUVECs were taken from C, where indicated by asterisks.
TRPC1 and TRPC4 are not involved in SOCE and ICRAC in ECs
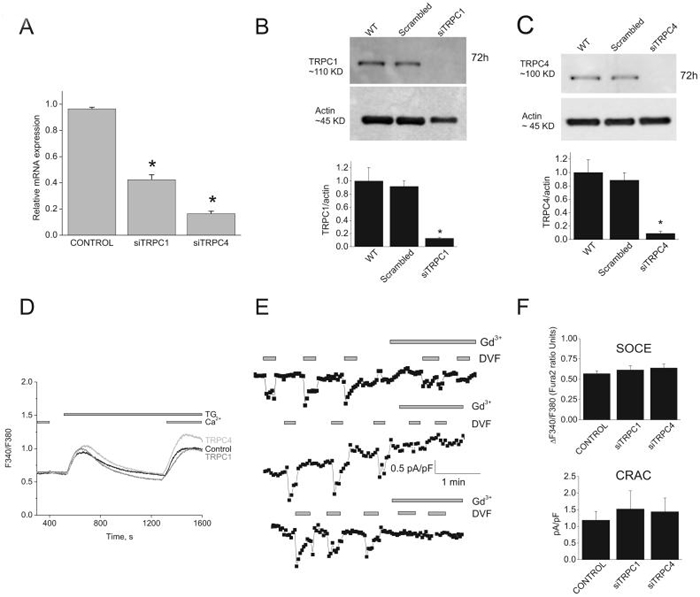
Previous data suggested that SOC channels in ECs are encoded by either TRPC1 or TRPC421, 25. Two siRNA sequences against either TRPC1 or TRPC4 used separately induced substantial decrease in their respective mRNA levels (56%±3.9 for siTRPC1 #1 and 83%±1.8 for siTRPC4#1; n=3; Figure 7A) and a drastic knockdown of protein levels (88%±1.7 for siTRPC1 and 91±3.2 for siTRPC4; n=3; Figure 7B, C). However, knockdown of either TRPC1 or TRPC4 failed to affect SOCE (Figure 7D) and ICRAC (Figure 7E). Figure 7F summarizes data of the amplitude of Ca2+ entry using Fura2 imaging (control, 0.57±0.03 ratio units; siTRPC1, 0.61±0.05; siTRPC4, 0.63±0.04; based on 91, 62 and 77 total cells from control, siTRPC1 and siTRPC4 respectively; 12 independent recordings each) and ICRAC at -100mV (control, 1.2±0.3 pA/pF; siTRPC1, 1.5±0.5pA/pF; siTRPC4, 1.4±0.4pA/pF; n= 5) showing no statistical difference between control, siTRPC1 and siTRPC4.
Figure. 7. TRPC1 and TRPC4 knockdown has no effect on SOCE and ICRAC in HUVECs.
A, quantitative PCR showing decreased expression of TRPC1 and TRPC4 mRNA in silenced cells compared to control cells (scrambled siRNA), 72 hrs after transfection. B and C, western blots and statistical analysis of densitometry on TRPC1 and TRPC4 protein knockdown. D, TRPC1 and TRPC4 silencing has no effect on SOCE in response to thapsigargin in HUVECs. Data are representative of 12 independent experiments. E, ICRAC recorded in DVF conditions from control-, TRPC1- and TRPC4-siRNA transfected HUVECs. F, statistical analysis of Ca2+ entry measured by Fura2 (top) and ICRAC (bottom) from control-, TRPC1- and TRPC4-siRNA transfected HUVECs. (One way ANOVA, *p<0.05).
Stim1 and Orai1 are involved in EC proliferation
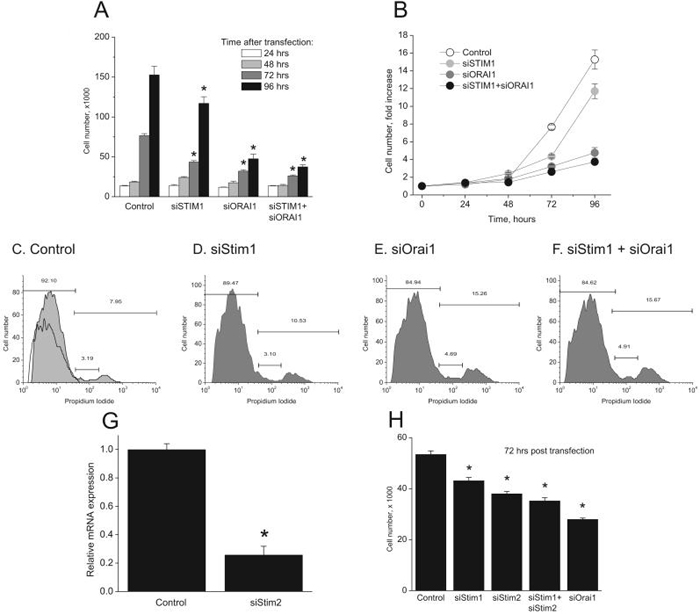
In human lymphocytes, SOCE is believed to be the sole Ca2+ entry involved in response to antigen receptor stimulation and is vital for lymphocyte proliferation5. Therefore, we evaluated the involvement of Stim1 and Orai1 in EC proliferation. Protein knockdown of Stim1, Orai1 or both was achieved using siRNA and EC proliferation in complete media was evaluated by counting cells different days post transfection following trypan blue exclusion. Figure 8A and B show that at 96 hours post knockdown, Stim1 inhibited cell proliferation by 23.3%±5.39 while Orai1 had a much greater effect (68.8%±3.8); knockdown of both proteins caused a comparable inhibitory effect to that of Orai1 knockdown alone (75.5%±1.7). Propidium Iodide (PI) staining on day 3 post silencing revealed that Orai1 knockdown increased the proportion of cells at the S and G2/M of the cell cycle (15.25% compared to 7.95% for control; figure 8C, E). Stim1 knockdown had a much smaller effect than Orai1 knockdown (10.53%; figure 8D). Knockdown of both Stim1 and Orai1 produced a similar effect to that seen with Orai1 knockdown alone (15.67%; figure 8F).
Figure. 8. Stim1, Stim2 and Orai1 knockdown inhibit proliferation in HUVECs.
A, Four groups of cells were transfected with the following siRNA: control, Stim1, Orai1, Stim1 + Orai1. At time 0, approximately 10,000 cells were seeded per well (9.6 cm2) in triplicate. At times indicated, cells were detached and total number of cells per well counted after trypan blue exclusion. B, Data in “A” are represented as fold-increase of cell number compared to time 0. Cell cycle analysis was performed 3 days post-transfection with siRNA using Propidium Iodide (PI) staining with flow cytometry in control- (C), Stim1- (D), Orai1- (E), and Stim1 + Orai1- (F) siRNA transfected HUVECs. Non PI stained control in shown in panel C. G, quantitative PCR showing Stim2 mRNA knockdown, 72 hours after transfection with specific siRNA. H, EC proliferation at 72hours post-transfection with indicated siRNA using the same protocol described in A. Data are representative of four independent experiments (one way ANOVA, *p<0.05).
Given the relatively smaller effect of Stim1 knockdown on EC proliferation compared to Orai1, we tested whether Stim2 might mediate some of Orai1 actions on EC proliferation. We used 2 siRNA sequences independently against Stim2 (see supplementary table) that substantially decreased Stim2 mRNA levels as measured by quantitative PCR (74.3%±6.0 inhibition for Stim2 siRNA#1; figure 8G). Figure 8H shows that Stim2 knockdown induced a significant inhibition of EC proliferation 72 hours post transfection (28.8%±1.7 for Stim2 compared to 19.4% ± 2.4 for Stim1). However, knockdown of both Stim proteins produced a smaller inhibition compared to that of Orai1 knockdown (34.1%±2.3 for Stim1 + Stim2 compared to 47.7%±1.02 for Orai1) suggesting that part of Orai1 role on EC proliferation is Stim-independent.
DISCUSSION
While SOCE using Ca2+ dyes was reported for several EC types, SOC currents on the other hand are not extensively characterized because of technical difficulties in detecting extremely low current densities in these cells17. Here we report that ICRAC is functionally present in ECs and has similar kinetics, reminiscent of ICRAC in RBL cells. Although ICRAC in EC has a very small density (~ 6-fold smaller than RBL cells), it could be amplified in DVF solutions, as previously shown in other cell types4, 27, 28. Rapid time-dependent inactivation of inward Na+ currents (termed depotentiation) upon removal of extracellular divalents, strong inward rectification and inhibition by low concentrations of lanthanides and 2-APB are typical properties of ICRAC4. We propose that ICRAC is mediating SOCE in HUVECs.
We showed that Stim1 and Orai1 are required for ICRAC and SOCE in ECs. Endothelial ICRAC and SOCE were drastically inhibited by silencing of Orai1 and Stim1. SOCE was rescued by exogenous expression of Stim1 and Orai1. Stim1 rescue led to the development of an unusually bigger SOCE compared to Orai1 rescue. Similarly, over-expression of eYFP-Stim1 in HUVECs generated a bigger SOCE and markedly increased ICRAC. Furthermore, Stim1 protein levels were found much lower in HUVECs compared to RBL cells, strongly suggesting that Stim1 is limiting in the activation of ICRAC and SOCE in HUVECs.
In this study, we failed to observe an involvement of TRPC1 or TRPC4 in SOCE despite knockdown of their protein expression. Prior studies on endothelial SOC suggested that TRPC channels can participate in endothelial SOCE 18-25. Non-selective TRPC1 and TRPC4 were reported to play some role in an endothelial conductance that displayed unusually large currents (over 5pA/pF at -80mV) 18, 19, 25. In these and other studies, currents were activated by inclusion of either IP320, 21, 35, thapsigargin 19, 25, 36, EGTA 19, 25, 36, low concentrations of the chelator BAPTA (1mmol/L)22 in the patch pipette or a combination of the above. While ICRAC is strongly inhibited by intracellular Ca2+, TRPC channels are activated downstream of PLC and are positively regulated by IP3 and IP3 receptor37. While our data suggest that endothelial SOC currents are ICRAC-like and are not mediated by TRPC, we can speculate that under certain patch clamp recording conditions, TRPC1, TRPC4 or both might mediate currents that are activated secondarily as a result of PLC activation in response to cytoplasmic Ca2+ rise or by IP3 included in the patch pipette in the absence of a strong buffer, as suggested by Zarayskiy et al for IP3-mediated activation of TRPC1 38. Most of the evidence suggesting a role of TRPC in SOCE is either correlative or based on experiments with blocking peptides or anti-TRPC antibodies19, 21, 22, 25, 35, 36. Two recent studies on TRPC1 knockout mice have questioned the specificity of anti-TRPC1 antibodies and the role of TRPC1 as a component of SOC channels in smooth muscle39 and platelets40. One study however, showed that ECs from mice display a store-depletion-activated current similar to ICRAC and that TRPC4 knockout mice lack this CRAC current in ECs23. The reason for the discrepancy between these data and ours is unknown. It is worthwhile to draw an analogy between the results on TRPC4-/- mice and the data by the Mori group obtained with DT40 B lymphocytes where the TRPC1 gene was genetically disrupted41. In these cells, SOCE and ICRAC were lost in the majority of cells (~80%). This result suggests that perhaps in the long term TRPC channels might play an important role in maintaining the components of ICRAC. Alternatively, the discrepancy could be explained by differences in the protocols or the type of cells used. The study on TRPC4-/- mice was carried out in ECs from a different vascular bed in a different species where primary cultures of mouse aortic endothelial cells (MAEC) were established using an explant method with ECs growing out from small pieces of mouse aorta placed on growth factors-enriched Matrigel42.
Our results do not conflict with the conclusions of previous studies reporting a role of TRPC1 and/or TRPC4 in endothelial permeability18, 19, 22, 25, 43. Instead, we show that the Stim1/Orai1 pathway is important for cell proliferation. Orai1 knockdown inhibits cell proliferation reflecting growth arrest at S and G2/M phases. Stim1 and Stim2 knockdown yielded a smaller effect as compared to Orai1 knockdown. This is likely a reflection of a Stim-independent role of Orai1 in controlling EC proliferation. Clearly, further studies are needed to understand the role of Stim and Orai proteins in EC function. In summary, we provided evidence for the involvement of Stim1 and Orai1 in endothelial SOC and the role of this pathway in EC proliferation. Reagents aimed towards targeted reduction or inhibition of Orai1 in the endothelium could be very useful for anti-angiogenesis strategies in cancer therapy.
Supplementary Material
Online Supplem
ACKNOWLEDGMENTS
Research in the authors' laboratory is supported by an NIH early career grant (K22ES014729) to Mohamed Trebak. We gratefully acknowledge Meryem Zannagui for performing the calcium imaging experiments depicted in supplementary figure 2.
Footnotes
Publisher's Disclaimer: DISCLOSURE: This is an un-copyedited author manuscript accepted for publication in Circulation Research, copyright The American Heart Association. This may not be duplicated or reproduced, other than for personal use or within the “Fair Use of Copyrighted Materials” (section 107, title 17, U.S. Code) without prior permission of the copyright owner, The American Heart Association. The final copyedited article, which is the version of record, can be found at http://circres.ahajournals.org/. The American Heart Association disclaims any responsibility or liability for errors or omissions in this version of the manuscript or in any version derived from it by the National Institutes of Health or other parties.
REFERENCES
- 1.Putney JW., Jr. A model for receptor-regulated calcium entry. Cell Calcium. 1986 Feb;7(1):1–12. doi: 10.1016/0143-4160(86)90026-6. [DOI] [PubMed] [Google Scholar]
- 2.Smyth JT, Dehaven WI, Jones BF, Mercer JC, Trebak M, Vazquez G, Putney JW., Jr. Emerging perspectives in store-operated Ca(2+) entry: Roles of Orai, Stim and TRP. Biochim Biophys Acta. 2006 Sep 5; doi: 10.1016/j.bbamcr.2006.08.050. [DOI] [PubMed] [Google Scholar]
- 3.Hoth M, Penner R. Depletion of intracellular calcium stores activates a calcium current in mast cells. Nature. 1992 Jan 23;355(6358):353–356. doi: 10.1038/355353a0. [DOI] [PubMed] [Google Scholar]
- 4.Parekh AB, Putney JW., Jr. Store-operated calcium channels. Physiol Rev. 2005 Apr;85(2):757–810. doi: 10.1152/physrev.00057.2003. [DOI] [PubMed] [Google Scholar]
- 5.Feske S, Gwack Y, Prakriya M, Srikanth S, Puppel SH, Tanasa B, Hogan PG, Lewis RS, Daly M, Rao A. A mutation in Orai1 causes immune deficiency by abrogating CRAC channel function. Nature. 2006 May 11;441(7090):179–185. doi: 10.1038/nature04702. [DOI] [PubMed] [Google Scholar]
- 6.Liou J, Kim ML, Heo WD, Jones JT, Myers JW, Ferrell JE, Jr., Meyer T. STIM is a Ca2+ sensor essential for Ca2+-store-depletion-triggered Ca2+ influx. Curr Biol. 2005 Jul 12;15(13):1235–1241. doi: 10.1016/j.cub.2005.05.055. [DOI] [PMC free article] [PubMed] [Google Scholar]
- 7.Roos J, DiGregorio PJ, Yeromin AV, Ohlsen K, Lioudyno M, Zhang S, Safrina O, Kozak JA, Wagner SL, Cahalan MD, Velicelebi G, Stauderman KA. STIM1, an essential and conserved component of store-operated Ca2+ channel function. J Cell Biol. 2005 May 9;169(3):435–445. doi: 10.1083/jcb.200502019. [DOI] [PMC free article] [PubMed] [Google Scholar]
- 8.Vig M, Peinelt C, Beck A, Koomoa DL, Rabah D, Koblan-Huberson M, Kraft S, Turner H, Fleig A, Penner R, Kinet JP. CRACM1 is a plasma membrane protein essential for store-operated Ca2+ entry. Science. 2006 May 26;312(5777):1220–1223. doi: 10.1126/science.1127883. [DOI] [PMC free article] [PubMed] [Google Scholar]
- 9.Cahalan MD, Zhang SL, Yeromin AV, Ohlsen K, Roos J, Stauderman KA. Molecular basis of the CRAC channel. Cell Calcium. 2007 Aug;42(2):133–144. doi: 10.1016/j.ceca.2007.03.002. [DOI] [PMC free article] [PubMed] [Google Scholar]
- 10.Putney JW., Jr. Recent breakthroughs in the molecular mechanism of capacitative calcium entry (with thoughts on how we got here) Cell Calcium. 2007 Aug;42(2):103–110. doi: 10.1016/j.ceca.2007.01.011. [DOI] [PMC free article] [PubMed] [Google Scholar]
- 11.Wu MM, Luik RM, Lewis RS. Some assembly required: constructing the elementary units of store-operated Ca2+ entry. Cell Calcium. 2007 Aug;42(2):163–172. doi: 10.1016/j.ceca.2007.03.003. [DOI] [PMC free article] [PubMed] [Google Scholar]
- 12.Potier M, Trebak M. New developments in the signaling mechanisms of the store-operated calcium entry pathway. Pflugers Arch. 2008 Jun 7; doi: 10.1007/s00424-008-0533-2. [DOI] [PMC free article] [PubMed] [Google Scholar]
- 13.Oike M, Gericke M, Droogmans G, Nilius B. Calcium entry activated by store depletion in human umbilical vein endothelial cells. Cell Calcium. 1994 Nov;16(5):367–376. doi: 10.1016/0143-4160(94)90030-2. [DOI] [PubMed] [Google Scholar]
- 14.Vaca L, Kunze DL. Depletion of intracellular Ca2+ stores activates a Ca(2+)-selective channel in vascular endothelium. Am J Physiol. 1994 Oct;267(4 Pt 1):C920–925. doi: 10.1152/ajpcell.1994.267.4.C920. [DOI] [PubMed] [Google Scholar]
- 15.Sasajima H, Wang X, van Breemen C. Fractional Ca2+ release from the endoplasmic reticulum activates Ca2+ entry in freshly isolated rabbit aortic endothelial cells. Biochem Biophys Res Commun. 1997 Dec 18;241(2):471–475. doi: 10.1006/bbrc.1997.7844. [DOI] [PubMed] [Google Scholar]
- 16.Pasyk E, Inazu M, Daniel EE. CPA enhances Ca2+ entry in cultured bovine pulmonary arterial endothelial cells in an IP3-independent manner. Am J Physiol. 1995 Jan;268(1 Pt 2):H138–146. doi: 10.1152/ajpheart.1995.268.1.H138. [DOI] [PubMed] [Google Scholar]
- 17.Fasolato C, Nilius B. Store depletion triggers the calcium release-activated calcium current (ICRAC) in macrovascular endothelial cells: a comparison with Jurkat and embryonic kidney cell lines. Pflugers Arch. 1998 Jun;436(1):69–74. doi: 10.1007/s004240050605. [DOI] [PubMed] [Google Scholar]
- 18.Brough GH, Wu S, Cioffi D, Moore TM, Li M, Dean N, Stevens T. Contribution of endogenously expressed Trp1 to a Ca2+-selective, store-operated Ca2+ entry pathway. Faseb J. 2001 Aug;15(10):1727–1738. [PubMed] [Google Scholar]
- 19.Moore TM, Brough GH, Babal P, Kelly JJ, Li M, Stevens T. Store-operated calcium entry promotes shape change in pulmonary endothelial cells expressing Trp1. Am J Physiol. 1998 Sep;275(3 Pt 1):L574–582. doi: 10.1152/ajplung.1998.275.3.L574. [DOI] [PubMed] [Google Scholar]
- 20.Mehta D, Ahmmed GU, Paria BC, Holinstat M, Voyno-Yasenetskaya T, Tiruppathi C, Minshall RD, Malik AB. RhoA interaction with inositol 1,4,5-trisphosphate receptor and transient receptor potential channel-1 regulates Ca2+ entry. Role in signaling increased endothelial permeability. J Biol Chem. 2003 Aug 29;278(35):33492–33500. doi: 10.1074/jbc.M302401200. [DOI] [PubMed] [Google Scholar]
- 21.Ahmmed GU, Mehta D, Vogel S, Holinstat M, Paria BC, Tiruppathi C, Malik AB. Protein kinase Calpha phosphorylates the TRPC1 channel and regulates store-operated Ca2+ entry in endothelial cells. J Biol Chem. 2004 May 14;279(20):20941–20949. doi: 10.1074/jbc.M313975200. [DOI] [PubMed] [Google Scholar]
- 22.Paria BC, Vogel SM, Ahmmed GU, Alamgir S, Shroff J, Malik AB, Tiruppathi C. Tumor necrosis factor-alpha-induced TRPC1 expression amplifies store-operated Ca2+ influx and endothelial permeability. Am J Physiol Lung Cell Mol Physiol. 2004 Dec;287(6):L1303–1313. doi: 10.1152/ajplung.00240.2004. [DOI] [PubMed] [Google Scholar]
- 23.Freichel M, Suh SH, Pfeifer A, Schweig U, Trost C, Weissgerber P, Biel M, Philipp S, Freise D, Droogmans G, Hofmann F, Flockerzi V, Nilius B. Lack of an endothelial store-operated Ca2+ current impairs agonist-dependent vasorelaxation in TRP4-/- mice. Nat Cell Biol. 2001 Feb;3(2):121–127. doi: 10.1038/35055019. [DOI] [PubMed] [Google Scholar]
- 24.Tiruppathi C, Freichel M, Vogel SM, Paria BC, Mehta D, Flockerzi V, Malik AB. Impairment of store-operated Ca2+ entry in TRPC4(-/-) mice interferes with increase in lung microvascular permeability. Circ Res. 2002 Jul 12;91(1):70–76. doi: 10.1161/01.res.0000023391.40106.a8. [DOI] [PubMed] [Google Scholar]
- 25.Cioffi DL, Wu S, Alexeyev M, Goodman SR, Zhu MX, Stevens T. Activation of the endothelial store-operated ISOC Ca2+ channel requires interaction of protein 4.1 with TRPC4. Circ Res. 2005 Nov 25;97(11):1164–1172. doi: 10.1161/01.RES.0000193597.65217.00. [DOI] [PubMed] [Google Scholar]
- 26.Trebak M, Bird GS, McKay RR, Putney JW., Jr. Comparison of human TRPC3 channels in receptor-activated and store-operated modes. Differential sensitivity to channel blockers suggests fundamental differences in channel composition. J Biol Chem. 2002 Jun 14;277(24):21617–21623. doi: 10.1074/jbc.M202549200. [DOI] [PubMed] [Google Scholar]
- 27.Zweifach A, Lewis RS. Rapid inactivation of depletion-activated calcium current (ICRAC) due to local calcium feedback. J Gen Physiol. 1995 Feb;105(2):209–226. doi: 10.1085/jgp.105.2.209. [DOI] [PMC free article] [PubMed] [Google Scholar]
- 28.Bakowski D, Parekh AB. Permeation through store-operated CRAC channels in divalent-free solution: potential problems and implications for putative CRAC channel genes. Cell Calcium. 2002 Nov-Dec;32(56):379–391. doi: 10.1016/s0143416002001914. [DOI] [PubMed] [Google Scholar]
- 29.Hoth M, Penner R. Calcium release-activated calcium current in rat mast cells. J Physiol. 1993 Jun;465:359–386. doi: 10.1113/jphysiol.1993.sp019681. [DOI] [PMC free article] [PubMed] [Google Scholar]
- 30.DeHaven WI, Smyth JT, Boyles RR, Putney JW., Jr. Calcium inhibition and calcium potentiation of Orai1, Orai2, and Orai3 calcium release-activated calcium channels. J Biol Chem. 2007 Jun 15;282(24):17548–17556. doi: 10.1074/jbc.M611374200. [DOI] [PubMed] [Google Scholar]
- 31.Prakriya M, Lewis RS. Separation and characterization of currents through store-operated CRAC channels and Mg2+-inhibited cation (MIC) channels. J Gen Physiol. 2002 May;119(5):487–507. doi: 10.1085/jgp.20028551. [DOI] [PMC free article] [PubMed] [Google Scholar]
- 32.Zhang SL, Yeromin AV, Zhang XH, Yu Y, Safrina O, Penna A, Roos J, Stauderman KA, Cahalan MD. Genome-wide RNAi screen of Ca(2+) influx identifies genes that regulate Ca(2+) release-activated Ca(2+) channel activity. Proc Natl Acad Sci U S A. 2006 Jun 13;103(24):9357–9362. doi: 10.1073/pnas.0603161103. [DOI] [PMC free article] [PubMed] [Google Scholar]
- 33.Vig M, DeHaven WI, Bird GS, Billingsley JM, Wang H, Rao PE, Hutchings AB, Jouvin MH, Putney JW, Kinet JP. Defective mast cell effector functions in mice lacking the CRACM1 pore subunit of store-operated calcium release-activated calcium channels. Nat Immunol. 2008 Jan;9(1):89–96. doi: 10.1038/ni1550. [DOI] [PMC free article] [PubMed] [Google Scholar]
- 34.Peinelt C, Lis A, Beck A, Fleig A, Penner R. 2-APB directly facilitates and indirectly inhibits STIM1-dependent gating of CRAC channels. J Physiol. 2008 Apr 10; doi: 10.1113/jphysiol.2008.151365. [DOI] [PMC free article] [PubMed] [Google Scholar]
- 35.Jho D, Mehta D, Ahmmed G, Gao XP, Tiruppathi C, Broman M, Malik AB. Angiopoietin-1 opposes VEGF-induced increase in endothelial permeability by inhibiting TRPC1-dependent Ca2 influx. Circ Res. 2005 Jun 24;96(12):1282–1290. doi: 10.1161/01.RES.0000171894.03801.03. [DOI] [PubMed] [Google Scholar]
- 36.Wu S, Cioffi EA, Alvarez D, Sayner SL, Chen H, Cioffi DL, King J, Creighton JR, Townsley M, Goodman SR, Stevens T. Essential role of a Ca2+-selective, store-operated current (ISOC) in endothelial cell permeability: determinants of the vascular leak site. Circ Res. 2005 Apr 29;96(8):856–863. doi: 10.1161/01.RES.0000163632.67282.1f. [DOI] [PubMed] [Google Scholar]
- 37.Boulay G, Brown DM, Qin N, Jiang M, Dietrich A, Zhu MX, Chen Z, Birnbaumer M, Mikoshiba K, Birnbaumer L. Modulation of Ca(2+) entry by polypeptides of the inositol 1,4, 5-trisphosphate receptor (IP3R) that bind transient receptor potential (TRP): evidence for roles of TRP and IP3R in store depletion-activated Ca(2+) entry. Proc Natl Acad Sci U S A. 1999 Dec 21;96(26):14955–14960. doi: 10.1073/pnas.96.26.14955. [DOI] [PMC free article] [PubMed] [Google Scholar]
- 38.Zarayskiy V, Monje F, Peter K, Csutora P, Khodorov B, Bolotina V. Store-operated Orai1 and IP3 receptor-operated TRPC1: separation of Siamese twins. Channels. 2007;1(4):e1–e7. doi: 10.4161/chan.4835. [DOI] [PubMed] [Google Scholar]
- 39.Dietrich A, Kalwa H, Storch U, Mederos y, Schnitzler M, Salanova B, Pinkenburg O, Dubrovska G, Essin K, Gollasch M, Birnbaumer L, Gudermann T. Pressure-induced and store-operated cation influx in vascular smooth muscle cells is independent of TRPC1. Pflugers Arch. 2007 Dec;455(3):465–477. doi: 10.1007/s00424-007-0314-3. [DOI] [PubMed] [Google Scholar]
- 40.Varga-Szabo D, Authi KS, Braun A, Bender M, Ambily A, Hassock SR, Gudermann T, Dietrich A, Nieswandt B. Store-operated Ca(2+) entry in platelets occurs independently of transient receptor potential (TRP) C1. Pflugers Arch. 2008 Jun 11; doi: 10.1007/s00424-008-0531-4. [DOI] [PubMed] [Google Scholar]
- 41.Mori Y, Wakamori M, Miyakawa T, Hermosura M, Hara Y, Nishida M, Hirose K, Mizushima A, Kurosaki M, Mori E, Gotoh K, Okada T, Fleig A, Penner R, Iino M, Kurosaki T. Transient receptor potential 1 regulates capacitative Ca(2+) entry and Ca(2+) release from endoplasmic reticulum in B lymphocytes. J Exp Med. 2002 Mar 18;195(6):673–681. doi: 10.1084/jem.20011758. [DOI] [PMC free article] [PubMed] [Google Scholar]
- 42.Suh SH, Vennekens R, Manolopoulos VG, Freichel M, Schweig U, Prenen J, Flockerzi V, Droogmans G, Nilius B. Characterisation of explanted endothelial cells from mouse aorta: electrophysiology and Ca2+ signalling. Pflugers Arch. 1999 Oct;438(5):612–620. doi: 10.1007/s004249900085. [DOI] [PubMed] [Google Scholar]
- 43.Mehta D, Rahman A, Malik AB. Protein kinase C-alpha signals rho-guanine nucleotide dissociation inhibitor phosphorylation and rho activation and regulates the endothelial cell barrier function. J Biol Chem. 2001 Jun 22;276(25):22614–22620. doi: 10.1074/jbc.M101927200. [DOI] [PubMed] [Google Scholar]
Associated Data
This section collects any data citations, data availability statements, or supplementary materials included in this article.
Supplementary Materials
Online Supplem
