CALCIFICATION OF HUMAN ARTICULAR KNEE CARTILAGE IS PRIMARILY AN EFFECT OF AGING RATHER THAN OSTEOARTHRITIS (original) (raw)
. Author manuscript; available in PMC: 2009 Jul 8.
Published in final edited form as: Osteoarthritis Cartilage. 2007 Feb 2;15(5):559–565. doi: 10.1016/j.joca.2006.10.017
INTRODUCTION
There are approximately 46 million patient visits for osteoarthritis (OA) each year in the U.S., with arthritis of the knee accounting for a large percentage of these visits1. Advanced stages of this debilitating disease are frequently associated with elevated calcification levels. The predominant forms of calcification, calcium pyrophosphate dihydrate (CPPD) and basic calcium phosphate (BCP) crystals, have been studied in synovial fluid2, knee tendons3, meniscal fibrocartilage4, as well as in hyaline articular cartilage matrix5. More than 95% of the cartilage calcification involving hyaline cartilage in the knee is related to CPPD and BCP crystals6. These calcium crystal depositions can cause acute attacks of inflammatory arthritis, such as pseudogout, erosive arthritis, or periarthritis, and are associated with an exaggerated form of OA7.
Calcification of soft tissues is commonly identified on plain radiographs due to its high density. This technique has been used to identify linear deposits of CPPD crystals in meniscal fibrocartilage and to a lesser extent articular cartilage in patients with early, mild OA as well as in people who are asymptomatic8,9. This, unfortunately, has led to a paradox. OA has been thought to drive pathologic cartilage calcification and cartilage calcification has been thought to drive the progression of OA10.
Mitrovic et al reported on the prevalence of pathological calcification of knee articular cartilage by macroscopic and radiologic criteria in 130 consecutive autopsies. They demonstrated that cartilage calcification correlates positively with aging and OA severity. However, the mean age of the subjects was 72±13 years with only 8 subjects less than 50 years old11. To provide a clearer picture of the natural history of cartilage calcification, this study harvested knees from individuals with a broad range of age without regard to clinical history. By narrowing the specimen thickness to a cut slab and imaging with a high resolution Faxitron system onto mammography film it was possible to study, in a highly specific manner, focal areas of cartilaginous calcification with reference to both age and degenerative changes.
METHODS
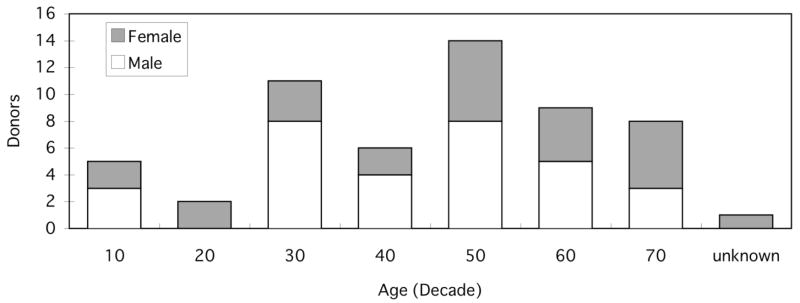
A total of 106 knee blocks were obtained from 56 individual donors (25 female and 31 male) with an average age of 50.3±17.4 years (range 12 to 74 with 1 unknown age). Harvested knee blocks included both left and right joints from all but six donors. Joints were provided by tissue banks as dissected knee blocks or were obtained after autopsy at local hospitals. None of the knee blocks had evidence of surgical intervention or previous injuries. Demographic and medical information of the donors (e.g. age, gender, race, height, weight, cause of death and history of joint diseases) were obtained from the donor tissue banks or hospital records. The distribution of donors’ age and gender by decade is shown in Figure 1.
Figure 1.
Study population histogram by decade. n=56.
After excising the capsule and exposing the articular surfaces of both the femur and tibia, the cartilage of each condyle was assessed visually for fibrillation and/or erosion using a 4-point grading scale. Cartilage fibrillation has been equated to represent early stages of osteoarthritis12. Grade 1 had a normal hyaline appearance, grade 2 presented minimal fibrillation, grade 3 demonstrated overt fibrillation and grade 4 showed cartilage erosion to bone. This surface grading has been described previously13.
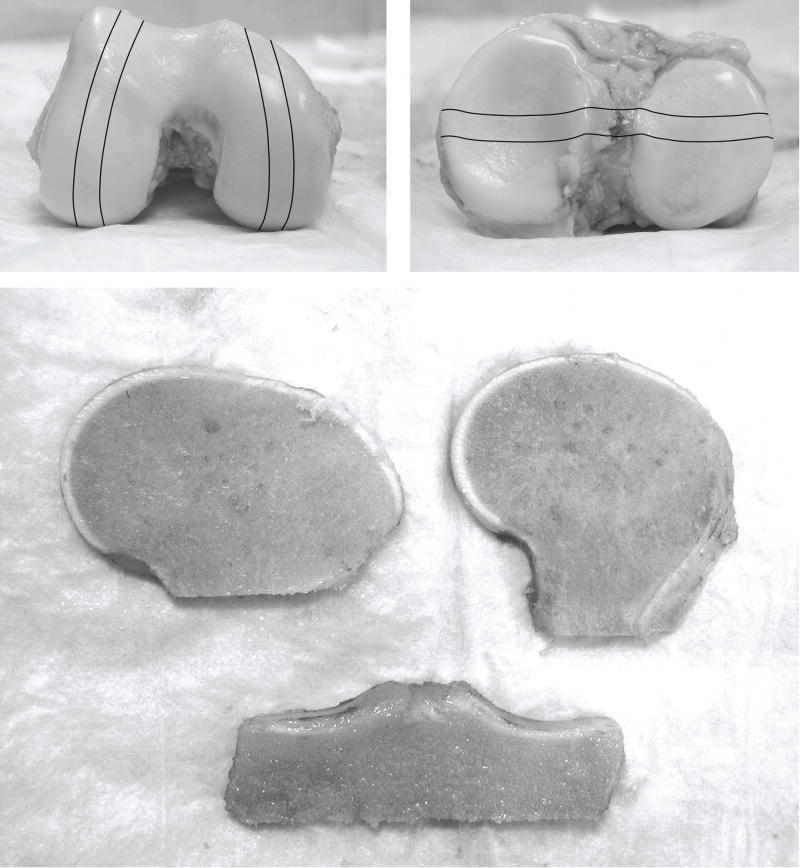
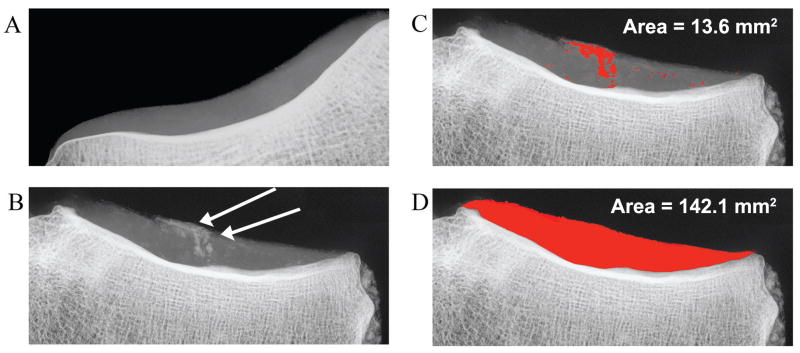
The femur and tibia were cut using a handheld saw resulting in slab specimens of bone and cartilage each about 7 to 10mm in thickness. The lateral and medial femoral condyles were cut along a sagittal plane and the tibia along a coronal plane so that the slab specimens included load-bearing regions of cartilage (Figure 2). All specimens were fixed and stored in 10% formalin. Prior to imaging, each edge of the cartilage was trimmed with a clean blade, removing any contamination of bone debris from the sawing procedure on the cartilage surfaces. Radiographs were taken using a Faxitron X-ray device producing a clear image of calcium deposition within the cartilage. The calcification could be viewed as regions within the cartilage matrix appearing much brighter than the surrounding cartilage density. The interpretation of calcium in the radiographs was confirmed histochemically using an Alizarin Red stain. The radiographs were scanned into a computer and assessed with image analysis software (ImageJ 1.32). Quantitative measurements of the areas of total cartilage and calcium deposition were performed by thresholding and manual measurement described in detail below. An aluminum step wedge was used as a density calibration control between films (Figure 3).
Figure 2.
Gross femoral and tibial condyles indicating areas of condylar strips and the resulting slabs used for analysis. The cartilage of the slabs was trimmed to remove any bone fragments introduced during harvest.
Figure 3.
Radiographic images of (A) a non-calcified lateral tibial cartilage and (B) a highly calcified region of a medial tibial plateau indicated by arrows. Analysis of these calcified areas is illustrated in (C), measurements (in red) of the calcium deposition area by thresholding and manual methods, and (D), the total measured cartilage area. The % calcification is derived from these two areas (9.6%).
The thresholding technique involved highlighting a given range of gray levels on the radiograph to identify areas for measurement. There were 256 distinct gray levels ranging from white (0) to black (255). By adjusting a upper and lower bounds on a threshold utility in the image analysis software, one could highlight an area in red corresponding to gray levels between those bounds. Two area measurements were made in order to calculate the percent calcification. The first measurement calculated the total cartilage area. This was accomplished by setting the lower bound to omit all gray values at or above background levels. The upper bound was lowered to omit all subchondral and trabecular bone levels. With the entire area of cartilage highlighted, an area measurement tool was used to encircle the region of interest and a measurement of the calibrated area was made. The second measurement was made of the calcified regions. Again, the upper and lower bounds were set to highlight as completely as possible the perceived calcium deposits within the cartilage matrix. In some cases, there was a gradient within the cartilage due to varying thickness of the cut slab. This gradient prevented the entire height of the cartilage from being measured simultaneously as some areas would become saturated to include others. In these cases, a manual method of painting over the calcified areas was used. Using a paintbrush tool, a gray level outside the range of the matrix was used to identify areas of calcification. Again, a measurement tool was used to determine the total area of regions painted in this way. Whether the calcification area was measured by thresholding or by manual methods, the percent of calcification was determined by dividing these two values giving a relative concentration of calcium for that cross section of cartilage.
Statistical analyses
The correlation between aging and the cartilaginous calcification was analyzed by Spearman’s correlation coefficient by rank test for each of the four condyles independently. For purposes of studying the effect of age, subjects were categorized into three age groups, young (40 years old and under), middle (41–60) and aged (over 60). The Kruskal-Wallis test was used to determine significant differences in the relationship between cartilaginous calcification and the three age groups as well as the cartilage surface grades (Grade 1 – 4). Group comparisons were performed by Scheffe’s F post-hoc test. The Student’s t-test was used to determine significance in dependent pair-wise comparison. All results were expressed as mean±1S.D. A p value less than 0.05 was considered significant. An intraobserver and interobserver analysis were performed to assess variability in measurement reproducibility.
RESULTS
Data from one hundred three lateral tibiae, 101 medial tibiae, 104 lateral femurs and 105 medial femurs were obtained. The demographic information of the donors and the results of the gross assessments of the knee joints are listed in Table I
Table I.
Demographic characteristics of donors and summary of cartilage surface grading
| Variable | Value |
|---|---|
| Age, years | 50.31±17.4 |
| Gender, % (N=56) | |
| Male | 55.4 |
| Female | 44.6 |
| Height, cm (mean±S.D.) | 171.7±13.0 |
| Body weight, kg (mean±S.D.) | 75.3±27.0 |
| BMI, kg/m2 (mean±S.D.) | 25.7±9.6 |
| OA history, % (N=106) | |
| Yes | 12.3 |
| No | 87.7 |
| Tibia grade, % (N=105) | |
| Grade 1 | 20.0 |
| Grade 2 | 20.0 |
| Grade 3 | 34.3 |
| Grade 4 | 25.7 |
| Femur grade, % (N=105) | |
| Grade 1 | 23.8 |
| Grade 2 | 34.3 |
| Grade 3 | 16.2 |
| Grade 4 | 25.7 |
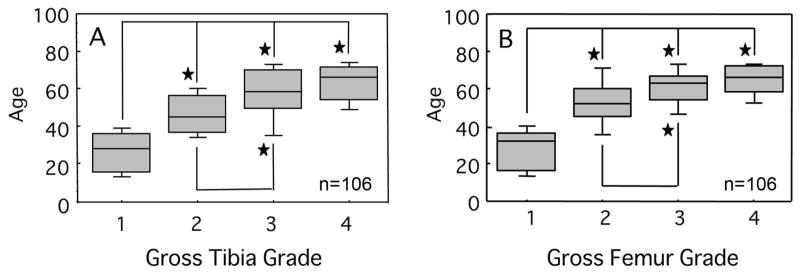
A previous report on this population demonstrated a statistically significant positive correlation between cartilage surface fibrillation and age both on the femoral condyles and the tibial plateaus12. Similar findings were evident in this data set. Group comparisons revealed that Grades 1 and 2 groups were associated with significantly younger ages than Grades 3 and 4 groups for both femurs and tibias. (P<0.001, Scheffe’s post-hoc test) (Figure 4)
Figure 4.
Cartilage surface grade versus age in years. Significant positive correlations were observed for both the (A) tibial and (B) femoral surfaces with increasing age. A tied P value by the Kruskal-Wallis test was less than 0.001 for both groups. Median values are shown. Shaded bars represent 25% and 75% and error bars represent 5% and 95% confidence intervals. *p<0.01 by the Scheffe’s post hoc test.
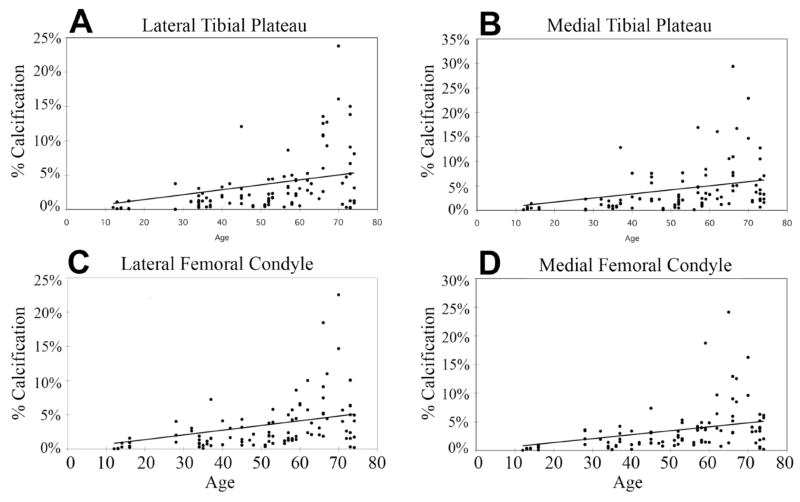
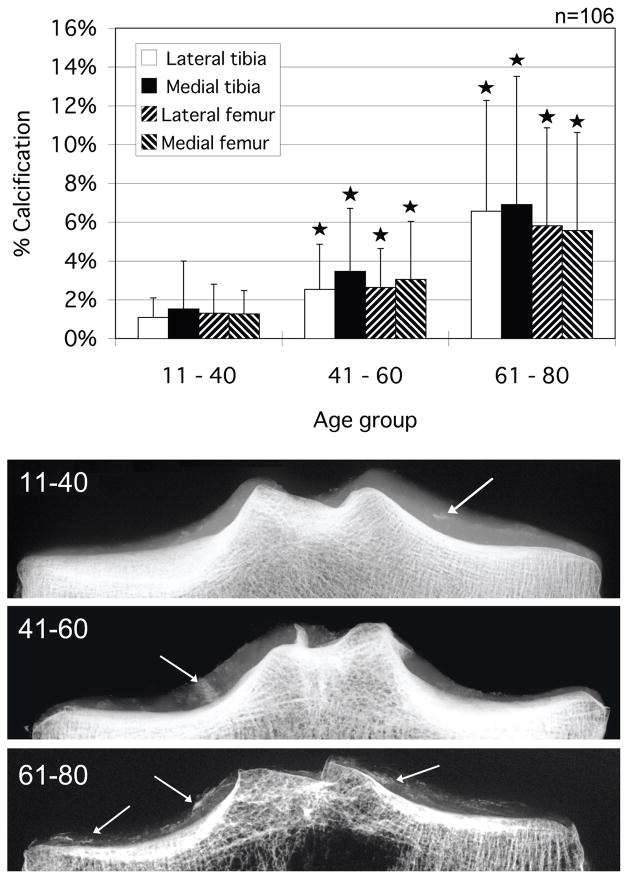
Scatter plots showing the relationship between age and percent calcification of each condyle are seen in Figures 5a through 5d. A positive correlation was recognized for all condyles (P<0.001, Spearman’s correlation coefficient by rank test). Calcification measurements were tabulated and assessed by age group (young 11 – 40, middle 41 – 60 and aged 61 – 80 years). The results are graphed in Figure 6 along with representative images of each group. A significant increase in the percentage of calcium deposition was observed between the young and middle age groups for all condylar sections. A significant increase was also seen between middle and aged groups for all condylar sections. The intra-observer reproducibility for a subset of 50 knees demonstrated a correlation of r2>0.99 across all condylar groups (femur, tibia, lateral, medial). An inter-observer assessment of the same subset demonstrated a correlation of r2>0.91 across all condyles.
Figure 5.
Scatter-grams of tibial and femoral specimens related with age and percentage with cartilage calcification. Significant positive correlations were observed for all sections. The following values were observed for the tied P value by Spearman’s correlation coefficient by rank test: (A) Lateral tibial plateau, P<0.001 with _r_s =0.346, (B) Medial tibial plateau, P<0.001 with _r_s=0.338, (C) Lateral femoral condyle, P<0.001 with _r_s =0.615, and (D) Medial femoral condyle, P<0.001 with _r_s=0.627.
Figure 6.
Percentage of cartilage calcification area for all condyles grouped by age and representative radiographic images illustrating the calcification. Asterisks indicate a significantly greater calcified percentage compared to the younger age group. Arrows indicate calcified regions. *p < 0.05 by the Scheffe’s F post-hoc test.
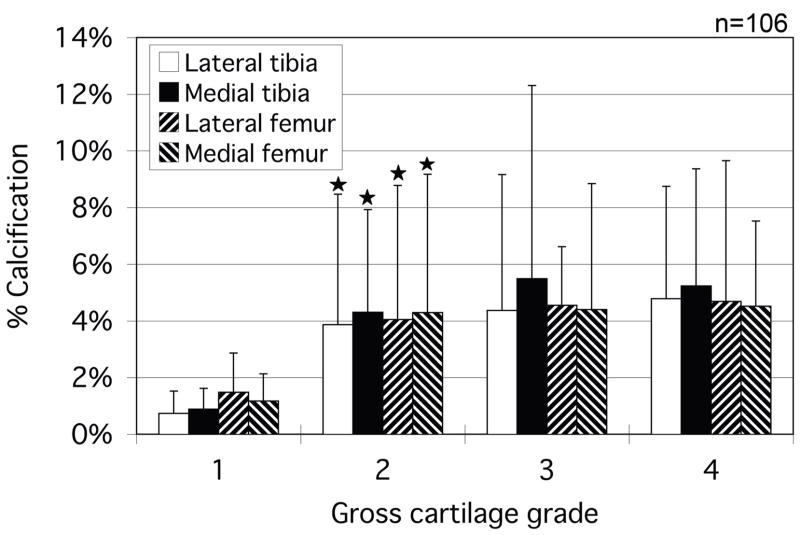
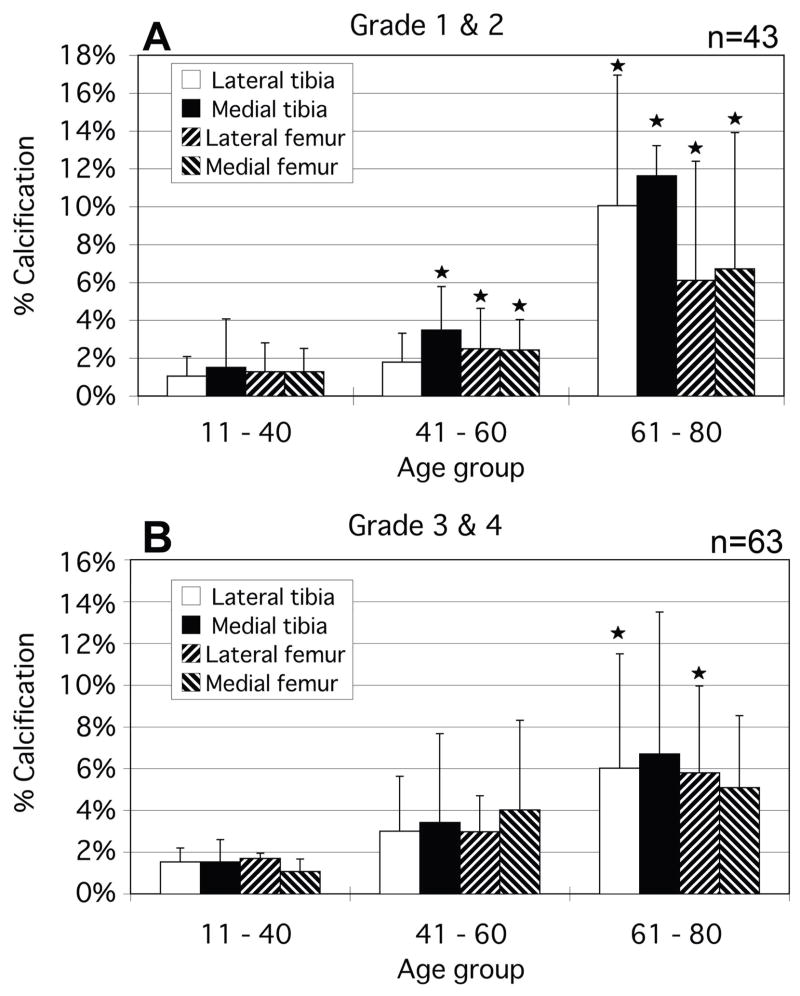
While there were no calcium-free knees in this population, several individual condyles were observed to have no measurable calcium deposits compared with their adjacent condylar groups. Femoral condyles were seen to have significantly higher calcium levels on average than the tibial plateaus. An assessment of calcification versus gross OA grade was made and the results are presented in Figure 7. Significant changes in calcification were seen primarily between grade 1 and grade 2 condyles. Again, femoral calcification was more prevalent. To examine the causal relationship between OA and calcification, plots similar to figure 6 were made which omitted all osteoarthritic (grade 3 and 4) specimens (Figure 8). As with the total population, the osteoarthritic condyles demonstrated an increasing calcification level with increasing age.
Figure 7.
Percentage of cartilage calcification area for all condyles grouped by cartilage grade. Asterisks indicate a significantly greater calcified percentage compared to the lower grade group. *p < 0.05
Figure 8.
The comparison between percentage of cartilage calcification area and age for non-osteoarthritic grades 1 & 2. (A) In minimally fibrillated condyles (grades 1 and 2), calcification is seen to increase as a function of age. (B) This pattern is also seen in the presence of more sever fibrillation (grades 3 and 4). *p<0.05.
There were no statistically significant differences observed in the comparison between BMI and calcification or between gender and calcification of condyles.
DISCUSSION
This study approached quantification of cartilage calcification in a unique way, not because it used radiographs, but because of the manner in which radiographs were used. The positive correlation between cartilage calcification and aging has been more accurately established. The correlation between cartilage calcification and gross condylar degeneration has been shown to be limited to Grade 2 changes only. A recent clinical study has paralleled these results demonstrating that calcification does not necessarily lead to worse OA progression14. The lack of correlation seen between calcium deposition levels and radiographic OA reinforces the primary importance of aging as the cause for calcifications in articular cartilage. This new perspective suggests that condylar calcification may be a precursor to increased fibrillation and OA rather than a result of these degenerative conditions.
It has been suggested that articular cartilage calcification may be a secondary effect of certain changes of aging. For example, age-related changes in cartilage water and proteoglycan content may play a significant role in cartilage calcification15. One of the most important molecules in the extracellular matrix of cartilage is water. When there is a loss of hydration, as occurs with age, there is a supersaturation of a variety of crystalline materials. The proteoglycans are the most abundant components of the hyaline cartilage matrix and have the function of maintaining hydration, a property dependent on their polyanionicity. It is not surprising to find crystals in the dehydrated articular cartilage matrices from which water-retaining proteoglycans have been lost.
Another age-related calcification perspective comes from studies of transforming growth factor beta (TGF-β) on chondrocyte differentiation. TGF-βhas been shown to decrease with age in equine articular cartilage16. TGF-βcan provoke an increase in CPPD by stimulating the production of inorganic pyrophosphate (PPi), thought to be one of the key components of CPPD17. This effect rises in association with aging18. In healthy articular cartilage, chondrocytes do not reach the terminal state of hypertrophic differentiation because TGF-β restrains such a transition19. However, loss of TGF-β expression or dysfunctional TGF-β receptor signaling promotes loss of this physiologic suppressive effect on chondrocyte differentiation and terminally differentiated chondrocytes could produce more PPi along with a matrix that supports calcification20. Indeed, terminally differentiated chondrocytes are seen next to calcific deposits in OA hyaline cartilages21. This study was limited to evaluation of condylar strips and did not evaluate the entire cartilage surface of the knee. It is interesting that the cartilage calcification on the femoral side was significantly greater than that on the tibial side. However, no difference in the severity of degeneration was observed between these articulating condyles. The menisci may confer some protection from the causes of calcification to those portions of the tibial surface they cover.
Limitations of this study include a lack of characterization of the calcium form identified by X-ray in the cartilage. This will require more sophisticated analyses, which are planned for the future. Also, it is now thought by the authors that an analysis of the pattern of deposition (by location and density) might reveal information on how this process occurs, especially if correlated with calcium type. It is also unknown whether the observations seen in the knee in this study case also present in other joints. This information, unfortunately, is not obtainable for this study population.
Calcification appears to be an early phenomenon that occurs before evidence of cartilage breakdown. Both gender and BMI had no influence on the observed calcification levels. Condylar calcification was observed to increase with advancing age and between normal (grade 1) and mildly fibrillated (grade 2) cartilage. However, as OA progressed beyond this grade, no observable differences in the calcification levels were seen. This would suggest that calcification is principally an effect of aging and may contribute to the progression of OA.
Acknowledgments
This work was supported by NIH Grant AG07996 and the Veterans Administration Research Service
Footnotes
Publisher's Disclaimer: This is a PDF file of an unedited manuscript that has been accepted for publication. As a service to our customers we are providing this early version of the manuscript. The manuscript will undergo copyediting, typesetting, and review of the resulting proof before it is published in its final citable form. Please note that during the production process errors may be discovered which could affect the content, and all legal disclaimers that apply to the journal pertain.
References
- 1.Abyad A, Boyer JT. Arthritis and aging. Curr Opin Rheumatol. 1992;4(2):153–9. doi: 10.1097/00002281-199204000-00004. [DOI] [PubMed] [Google Scholar]
- 2.Derfus BA, Kurian JB, Butler JJ, Daft LJ, Carrera GF, Ryan LM, et al. The high prevalence of pathologic calcium crystals in pre-operative knees. J Rheumatol. 2002;29(3):570–4. [PubMed] [Google Scholar]
- 3.Yang BY, Sartoris DJ, Resnick D, Clopton P. Calcium pyrophosphate dihydrate crystal deposition disease: frequency of tendon calcification about the knee. J Rheumatol. 1996;23(5):883–8. [PubMed] [Google Scholar]
- 4.Canhao H, Fonseca JE, Leandro MJ, Romeu JC, Pimentao JB, Costa JT, Queiroz MV. Cross-sectional study of 50 patients with calcium pyrophosphate dihydrate crystal arthropathy. Clin Rheumatol. 2001;20(2):119–22. doi: 10.1007/s100670170081. [DOI] [PubMed] [Google Scholar]
- 5.Abreu M, Johnson K, Chung CB, De Lima JE, Jr, Trudell D, Terkeltaub R, et al. Calcification in calcium pyrophosphate dihydrate (CPPD) crystalline deposits in the knee: anatomic, radiographic, MR imaging, and histologic study in cadavers. Skeletal Radiol. 2004;33(7):392–8. doi: 10.1007/s00256-004-0767-9. [DOI] [PubMed] [Google Scholar]
- 6.Steinbach LS, Resnick D. Calcium pyrophosphate dihydrate crystal deposition disease: imaging perspectives. Curr Probl Diagn Radiol. 2000;29(6):209–29. doi: 10.1016/s0363-0188(00)90014-8. [DOI] [PubMed] [Google Scholar]
- 7.Ryan LM, Cheung HS. The role of crystals in osteoarthritis. Rheum Dis Clin North Am. 1999;25(2):257–67. doi: 10.1016/s0889-857x(05)70066-1. [DOI] [PubMed] [Google Scholar]
- 8.Sanmarti R, Kanterewicz E, Pladevall M, Panella D, Tarradellas JB, Gomez JM. Analysis of the association between chondrocalcinosis and osteoarthritis: a community based study. Ann Rheum Dis. 1996;55(1):30–3. doi: 10.1136/ard.55.1.30. [DOI] [PMC free article] [PubMed] [Google Scholar]
- 9.Sanmarti R, Panella D, Brancos MA, Canela J, Collado A, Brugues J. revalence of articular chondrocalcinosis in elderly subjects in a rural area of Catalonia. Ann Rheum Dis. 1993;52(6):418–22. doi: 10.1136/ard.52.6.418. [DOI] [PMC free article] [PubMed] [Google Scholar]
- 10.Olmez N, Schumacher HR., Jr Crystal deposition and osteoarthritis. Curr Rheumatol Rep. 1999;1(2):107–11. doi: 10.1007/s11926-999-0006-4. [DOI] [PubMed] [Google Scholar]
- 11.Mitrovic DR, Stankovic A, Iriarte-Borda O, Uzan M, Quintero M, Miravet L, et al. The prevalence of chondrocalcinosis in the human knee joint. An autopsy survey J Rheumatol. 1988;15(4):633–41. [PubMed] [Google Scholar]
- 12.Mankin HJ, Dorfman H, Lippiello L, Zarins A. Biochemical and metabolic abnormalities in articular cartilage from osteo-arthritic human hips. II. Correlation of morphology with biochemical and metabolic data. J Bone Joint Surg Am. 1971;53(3):523–37. [PubMed] [Google Scholar]
- 13.Yamada K, Healey R, Amiel D, Lotz M, Coutts R. Subchondral bone of the human knee joint in aging and osteoarthritis. Osteoarthritis Cartilage. 2002;10(5):360–9. doi: 10.1053/joca.2002.0525. [DOI] [PubMed] [Google Scholar]
- 14.Neogi T, Nevitt M, Niu J, LaValley MP, Hunter DJ, Terkeltaub R, et al. Lack of association between chondrocalcinosis and increased risk of cartilage loss in knees with osteoarthritis: results of two prospective longitudinal magnetic resonance imaging studies. Arthritis Rheum. 2006;54(6):1822–8. doi: 10.1002/art.21903. [DOI] [PubMed] [Google Scholar]
- 15.DeGroot J, Verzijl N, Bank RA, Lafeber FP, Bijlsma JW, TeKoppele JM. Age-related decrease in proteoglycan synthesis of human articular chondrocytes: the role of nonenzymatic glycation. Arthritis Rheum. 1999;42(5):1003–9. doi: 10.1002/1529-0131(199905)42:5<1003::AID-ANR20>3.0.CO;2-K. [DOI] [PubMed] [Google Scholar]
- 16.Iqbal J, Dudhia J, Bird JL, Bayliss MT. Age-related effects of TGF-beta on proteoglycan synthesis in equine articular cartilage. Biochem Biophys Res Commun. 2000;274(2):467–71. doi: 10.1006/bbrc.2000.3167. [DOI] [PubMed] [Google Scholar]
- 17.Rosenthal AK, Cheung HS, Ryan LM. Transforming growth factor beta 1 stimulates inorganic pyrophosphate elaboration by porcine cartilage. Arthritis Rheum. 1991;34(7):904–11. doi: 10.1002/art.1780340717. [DOI] [PubMed] [Google Scholar]
- 18.Rosen F, McCabe G, Quach J, Solan J, Terkeltaub R, Seegmiller JE, et al. Differential effects of aging on human chondrocyte responses to transforming growth factor beta: increased pyrophosphate production and decreased cell proliferation. Arthritis Rheum. 1997;40(7):1275–81. doi: 10.1002/1529-0131(199707)40:7<1275::AID-ART12>3.0.CO;2-H. [DOI] [PubMed] [Google Scholar]
- 19.Yang X, Chen L, Xu X, Li C, Huang C, Deng CX. TGF-beta/Smad3 signals repress chondrocyte hypertrophic differentiation and are required for maintaining articular cartilage. J Cell Biol. 2001;153(1):35–46. doi: 10.1083/jcb.153.1.35. [DOI] [PMC free article] [PubMed] [Google Scholar]
- 20.Boskey AL. Pathogenesis of cartilage calcification: mechanisms of crystal deposition in cartilage. Curr Rheumatol Rep. 2002;4(3):245–51. doi: 10.1007/s11926-002-0072-3. [DOI] [PubMed] [Google Scholar]
- 21.Kirsch T, Swoboda B, Nah H. Activation of annexin II and V expression, terminal differentiation, mineralization and apoptosis in human osteoarthritic cartilage. Osteoarthritis Cartilage. 2000;8(4):294–302. doi: 10.1053/joca.1999.0304. [DOI] [PubMed] [Google Scholar]
