Vascular Smooth Muscle Cell Durotaxis Depends on Substrate Stiffness Gradient Strength (original) (raw)
Abstract
Mechanical compliance is emerging as an important environmental cue that can influence certain cell behaviors, such as morphology and motility. Recent in vitro studies have shown that cells preferentially migrate from less stiff to more stiff substrates; however, much of this phenomenon, termed durotaxis, remains ill-defined. To address this problem, we studied the morphology and motility of vascular smooth muscle cells on well-defined stiffness gradients. Baselines for cell spreading, polarization, and random motility on uniform gels with moduli ranging from 5 to 80 kPa were found to increase with increasing stiffness. Subsequent analysis of the behavior of vascular smooth muscle cells on gradient substrata (0–4 kPa/100 _μ_m, with absolute moduli of 1–80 kPa) demonstrated that the morphology on gradient gels correlated with the absolute modulus. In contrast, durotaxis (evaluated quantitatively as the tactic index for a biased persistent random walk) and cell orientation with respect to the gradient both increased with increasing magnitude of gradient, but were independent of the absolute modulus. These observations provide a foundation for establishing quantitative relationships between gradients in substrate stiffness and cell response. Moreover, these results reveal common features of phenomenological cell response to chemotactic and durotactic gradients, motivating further mechanistic studies of how cells integrate and respond to multiple complex signals.
Introduction
Cell migration underlies a number of fundamental biological processes, including development, wound healing, and angiogenesis. These processes can be directed by various chemical and physical cues from the surrounding environment. Furthermore, the form in which these signals are presented to the cell is crucial for determining its response. The phenomena of cell response to gradients in soluble chemical signals (chemotaxis) or adhesive ligand density (haptotaxis) have been studied extensively in the literature; in contrast, cell response to gradients in substrate mechanical stiffness (durotaxis or mechanotaxis) has not been as well characterized. There have been limited studies of in vivo gradients (1); however, recent in vitro studies have highlighted the importance of substrate stiffness in governing a range of cell behaviors, including morphology (2–4), motility (5–8), and receptor regulation (9). In addition, gradients in stiffness have been shown to elicit directional cell migration in vitro. This was first reported for fibroblasts by Lo et al. (10) and further confirmed by several other groups using different cell types (5,8,11,12). However, a detailed, quantitative understanding of durotaxis is lacking. To understand the fundamental relationships between cell behavior and the magnitude of gradients in compliance or absolute compliance, systematic studies of durotaxis are needed.
The paucity of quantitative relationships between stiffness gradients and durotaxis is primarily due to the difficulty of generating substrata with continuous gradients in stiffness and verifying these gradients, and the lack of quantitative methods to analyze durotaxis. The most straightforward means of creating substrata with variations in substrate modulus is to vary the cross-link density of polymer hydrogels by tuning the spatial concentrations of the cross-linker and monomer. Gradients in cross-linker concentration over length scales of centimeters or millimeters can be easily generated with gradient makers that are used for polyacrylamide gel (PAAm) electrophoresis (13), but gradients in modulus over length scales comparable to a single cell (10–100 _μ_m) require novel enabling technologies. Recently, microfluidic networks (14,15) have been used to generate soluble gradients of cytokines (16) and substrate-bound gradients of extracellular-matrix proteins (17). We previously reported microfluidic photopolymerization of hydrogels with gradients in compliance (18).
In this study, we present a detailed investigation of how the magnitude of a gradient in substrate stiffness affects the behavior of vascular smooth muscle cells (VSMCs) on collagen-incorporated PAAm gels. These substrates are polymerized in microfluidic devices via photoinitiation, producing gradients in modulus that span a range from 1 to 4 kPa/100 _μ_m (1–80 kPa absolute modulus). We chose this as our model system to mimic the local variations in tissue mechanical properties found at sites of atherosclerosis in vivo, which have been shown to range from ∼1 to 100 kPa (19). The length scale (per 100 _μ_m) was chosen to represent the approximate magnitude of the gradient over the length of a typical polarized VSMC (∼100 _μ_m). These gels were characterized mechanically using atomic force microscopy (AFM), and fluorescently labeled collagen was used to determine the spatial profiles of the collagen surface concentration. The behavior of VSMCs on these gels was then compared with cell behavior on uniform gels with a similar range of absolute modulus. Durotactic behavior was assessed morphologically by quantifying cell morphology, polarization, and orientation with respect to gradient direction. Motile response was evaluated qualitatively using windrose plots, and quantitatively by applying to durotaxis the concept of a tactic index (TI), which was originally proposed by McCutcheon (20) and developed further by Othmer et al. (21) to describe chemotaxis. To our knowledge, the “McCutcheon-Othmer” TI has only been used to characterize chemotaxis (e.g., of macrophages (22)). We believe the study presented here is the first to characterize durotaxis quantitatively using this method. Our study demonstrates that both the gradient and absolute compliance of a substrate affect the behavior of VSMCs. These results may offer insights into the behavior of VSMCs in vascular disease and may also benefit other biomedical technologies, such as tissue engineering, where it is desirable to control cellular organization.
Materials and Methods
Gradient fabrication
Polyacrylamide hydrogels with either uniform or gradient compliance were prepared with the use of microfluidic devices as previously described (18) (see Fig. S1 in the Supporting Material). Briefly, a micropatterned polydimethylsiloxane (PDMS) mold in a gradient generator configuration was fabricated by means of rapid prototyping and soft lithography (15). The PDMS mold then was attached to glass coverslips activated with (3-aminopropyl)trimethoxysilane (Sigma, St. Louis, MO) and glutaraldehyde to form a network of microchannels. Solutions containing acrylamide (AAm) monomer (Bio-Rad, Hercules, CA), bis-acrylamide (bis) cross-linker (Bio-Rad, Hercules, CA), and photoinitiator (2,2′-azobis(2-methylpropionamide))dihydrochloride (Sigma-Aldrich, St. Louis, MO) were pumped into the device via a set of three inlet ports that fed into a system of tortuous mixing channels. In these channels the streams were repeatedly split and recombined with neighboring streams before they ultimately converged as laminar flow in a relatively wide and long outlet channel. After a stable gradient was established at a flow rate of 15 _μ_L/min (= 3 inlets × 5 _μ_L/min), the device was exposed to a 350 nm light at 1.8 mW/cm2 for 2.5 min. After exposure to ultraviolet light, the PDMS mold was removed and the gel, still adherent to the glass slide, was immersed in phosphate-buffered saline overnight. The resulting gels were 3 cm in length and 2.8 mm in width. Gradient gels were made by varying the concentration of bis among the inlets such that two adjacent inlets had identical compositions, resulting in gels with both gradient and uniform regions (Table S1). Uniform gels without gradients were made with all three inlets receiving identical solutions.
Mechanical characterization
Hydrogels were characterized by means of both traditional uniaxial tensile testing (6,8) and AFM (MFP-3D; Asylum Research, Santa Barbara, CA). AFM with a 0.06 N/m silicon nitride cantilever and 10-_μ_m-diameter borosilicate glass bead as a tip (Novascan, Ames, IA) enabled microscale characterization of gradients that was not possible with bulk tensile testing. Uniform gels were evaluated using both tensile testing and AFM; gradient gels were evaluated only with AFM. Gradient gels were tested by performing indentations, spaced 400 _μ_m apart, across the width of the gel (parallel to gradient) at multiple points along the length of the gel. A minimum of three replicates were examined for each condition. Indentation data revealed that our gels did not behave in a purely elastic manner at the surface. Consequently, we were unable to use the commonly employed Hertzian contact theory (23–25), which assumes a purely elastic substrate, to describe the contact mechanics of our gels, and thus could not directly measure the substrate modulus from AFM indentation data. As a practical alternative, we defined an “AFM effective force constant” as the slope of the linear region of the force versus indentation curve obtained from AFM. Effective force constants were measured for uniform gels made with the microfluidic device (all inlets at same concentration) and correlated with Young's moduli determined from bulk tensile testing of gels created with corresponding AAm/bis concentrations. This correlation was used to map estimated Young's moduli to specific regions of the gradient gels based on their effective force constants obtained from AFM measurements.
Substrate functionalization
Hydrogels were modified covalently with type I collagen as previously described (26). Briefly, gels were functionalized with the photoactivatable heterobifunctional linker sulfosuccinimidyl-6-(4-azido-2-nitrophenyl-amino)hexanoate (sulfo-SANPAH; Pierce Biotechnology, Rockford, IL), followed by incubation with 0.2 mg/mL type I collagen overnight at 4°C. The uniformity of this functionalization was evaluated using covalently immobilized type I collagen-fluorescein (Elastin Products, Owensville, MO) on a minimum of three independent replicates for each uniform and gradient gel. Sets of 860 _μ_m × 680 _μ_m fluorescence images for gels with and without fluorescein-collagen were acquired using a Zeiss Axiovert S100 microscope, and then montaged and background-subtracted using mosaics for unlabeled collagen. The fluorescence intensity of 100-_μ_m-wide line scans parallel to the direction of the gradient was measured using Metamorph software (Universal Imaging, Downingtown, PA). Data for intensity were binned in 200-_μ_m-wide bins and averaged among four randomly selected scans for each gel. A minimum of three replicates were examined for each condition.
Cell culture and morphology
Bovine aortic VSMCs (Coriell Cell Repositories, Camden, NJ) were cultured at 37°C in 5% CO2 in Dulbecco's modified Eagle's medium (DMEM; Invitrogen, Grand Island, NY) supplemented with penicillin, streptomycin, L-glutamine, and 10% bovine calf serum (Hyclone, Logan, UT). Cells were plated onto gels at a density of 103 cells/cm2 to reduce cell-cell contacts. To allow the cells to attach and spread stably, gels were incubated at 37°C in 5% CO2 for a minimum of 18 h before further observation. A minimum of three gels per experimental condition were examined in a series of independent experiments. The cell-behavior data presented here are based on pooling among replicates.
Cell polarization and orientation were identified by morphological inspection. After 18 h of incubation, phase-contrast images of ∼20 randomly chosen fields of view per condition per experiment were taken using a Zeiss Axiovert S100 microscope equipped with a motorized stage (Ludl, Hawthorne, NY), cooled CCD camera (Princeton Instruments, Trenton, NJ), and Metamorph software. The presence of pseudopodia was determined qualitatively by observation of a projection of cellular mass visually distinct from the main body of the cell. Cells lacking defined lamellipodia and filipodia were defined as “unpolarized”, and data for orientation were not recorded. These unpolarized cells were primarily round in shape. Cells that were extended but had no definable front and back also were designated as “unpolarized”; although these cells clearly were extended, the directionality of the cell could not be established. Long axes for cells were identified by morphological inspection. For gradient gels, the angle between the gradient direction and the cell's long axis was measured using NIH ImageJ v1.33. For uniform gels, this procedure was implemented by assigning a fixed arbitrary reference direction. Cell orientations of 0° or 180° indicate that the cell was oriented perfectly in or opposite to the direction of the gradient, respectively. An average cell orientation of 90° corresponds to cells that were randomly oriented.
Cell motility
Time-lapse microscopy was performed as previously described (27) using a custom-made incubator system to maintain the temperature and atmosphere at 37°C and 5% CO2, respectively. Fields on gels were chosen at random, and phase-contrast images of single cells were captured at 15-min intervals over a 20-h period. Movement of individual cells was assessed by identifying the positions of cell centroids at each time point. Cells that came into contact with each other were excluded from the analysis. Windrose plots illustrating the qualitative motile behavior of 25 typical cells on a uniform or gradient gel were produced by linking positions of centroids at 15-min intervals, superimposed on a common starting position. Cells selected for windrose plots for gradient gels were located only on the gradient section of those gels.
On uniform gels, individual cells were classified as either motile or immotile according to the criterion described by DiMilla et al. (27). For these gels, the speed (S) and persistence time (P) of each motile cell were determined by fitting a two-dimensional random walk model (Eq. 1) (27–29) to the mean-squared displacement of the cells (〈_d_2〉) as a function of time (t) using the Levenberg-Marquardt method for nonlinear least-squares regression:
| 〈d2〉=2S2[Pt−P2(1−e−t/P)]. | (1) |
|---|
On uniform and gradient stiffness gels, we defined a durotactic index based on a TI originally proposed by McCutcheon (20) to describe chemotaxis. Othmer et al. (21) developed Eq. 2 to relate the TI to mean displacement in the gradient direction (X), total path length (L), persistence time, and time period over which the cell was observed:
| TI=XL[1−Pt(1−e−t/P)]−1. | (2) |
|---|
Because we tracked cells over a time period significantly greater than the persistence time (i.e., t ≫ P), we determined the durotactic index based on approximating Eq. 2 (20,22,30) as:
Values of S, P, and TI for cells tracked less than 6 h were excluded from further analysis. Note that the parameters S and TI describe behavior only on uniform and gradient gels, respectively, and therefore no conclusions regarding cell speed can be drawn based solely on gradient gels.
Statistical analysis
Quantitative data for cell behavior are presented as the mean ± SE, histograms, or scatter plots. The mean ± SE for the percentage of polarized cells was determined based on assuming a binomial distribution described the observation of polarization. To test for differences between means, one-way analyses of variance (ANOVAs) were performed using the SPSS v11 software package (SPSS, Chicago, IL). Post hoc analysis, if necessary, was performed using a least-significant difference _t_-test. Statistical analysis for histograms was performed using a chi-square test (31). Tests for correlation of orientation angle and TI with modulus were performed by first calculating the linear correlation coefficient (r) and then calculating the probability that the observed value for r differed from r = 0 (i.e., no correlation) (31). A significance value of α = 0.05 was used for all tests.
Results
Mechanical characterization
For our uniform gels, we observed that the bulk tensile modulus varied linearly with bis concentration over the range used in the gradient generator (Fig. 1 A). Similarly, the effective force constant from the slope of the linear region of the AFM indentation curve correlated linearly with bis concentration (Fig. 1 B). The linearity of both macro- and micromechanical measurements allowed us to evaluate gradients in stiffness by mapping measured effective force constants to a corresponding bulk tensile modulus (Fig. 2).
Figure 1.
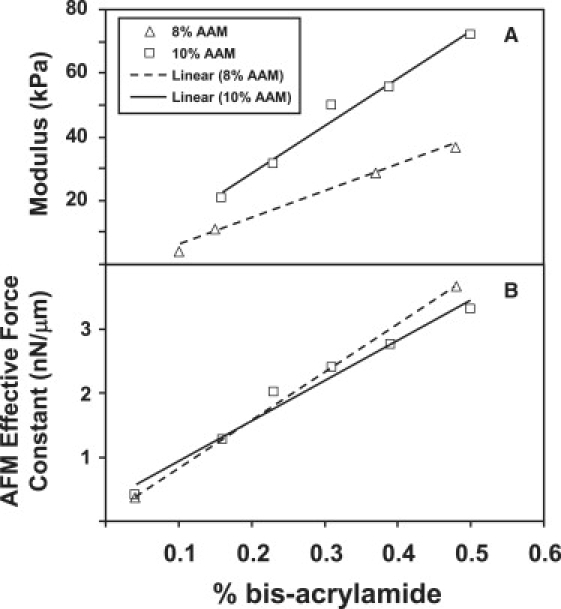
Macro- and micromechanical properties of PAAm hydrogels fabricated with uniform bis concentration. (A) Bulk tensile modulus as a function of bis concentration from traditional uniaxial tensile testing. (B) Effective force constant, defined as the slope of the linear region of the indentation curve, as a function of bis concentration from AFM.
Figure 2.

Mosaic phase-contrast images of VSMCs on PAAm gels with corresponding plots of modulus as a function of position for gels with (A) 1 kPa/100 _μ_m, (B) 2 kPa/100 _μ_m, and (C) 4 kPa/100 _μ_m gradients in stiffness. Image dimensions map directly to the x axis of the corresponding modulus-position plot. Solid symbols: experimental values based on mapping AFM effective force constant to bulk tensile modulus; open symbols: theoretical predictions based on combining a mixing model (14) with relationships between bis concentration and bulk modulus. Solid lines: linear fits of modulus as a function of position to gradient regions of gels; dotted lines: regions of uniform modulus. Solid symbols (circles, diamonds, and triangles): experimental values; open symbols: from theoretical model.
Three cases of gradient gels were examined (Table S1), corresponding to gels with bulk moduli ranging from 29.6 to 51.6 kPa, 0.93 to 41.7 kPa, and 4.64 to 80.1 kPa. We determined the strengths of the gradient in stiffness for these three gradients as nominally 1, 2, and 4 kPa/100 _μ_m by fitting a linear model to the mapped modulus as a function of position. Experimental estimates for the modulus as a function of position were compared against those calculated from the theoretical predictions of bis concentration as a function of position using the mixing model described in detail by Dertinger et al. (14) for microfluidic mixing devices such as the one used in this study. Briefly, the model assumes that any two streams that are combined at the entrance of a given mixing section of the device are completely mixed by the time the combined streams exit that section. If these calculations are carried out for each mixing section, the result is a theoretical prediction of the spatial distribution of the bis concentration in the outlet channel. Using these bis concentrations and the results in Fig. 2 A, we were able to map the predicted bis concentrations to modulus values as a function of gel position. As can be seen in Fig. 2, these predictions of modulus were identical to the experimental estimates determined by AFM and those measured via bulk tensile testing. Thus, although we recognize that more comprehensive models for viscoelastic behavior are desirable to assess the surface mechanics of our gels (32), our analysis provided a reasonable approximation of gradient strength, and, most importantly, described internally consistent changes in stiffness among gradient and uniform substrates.
Substrate functionalization
To eliminate the possibility that the density of immobilized collagen varied spatially for gels with stiffness gradients, we examined the fluorescent intensity of gels covalently modified with fluorescein-labeled type I collagen. The amount of fluorescence associated with incorporated collagen did not change as the gradient in stiffness was varied from 0 (i.e., a uniform gel) to 4 kPa/100 _μ_m (Fig. 3) or the stiffness of uniform gels was increased from 1 to 140 kPa (data not shown). Application of an ANOVA showed that there were no statistically significant variations in collagen density among these uniform and gradient gels. Moreover, there was no statistically significant spatial variation in the amount of fluorescence associated with incorporated collagen for either uniform or gradient gels, as determined by conducting separate ANOVAs for each gel.
Figure 3.

Fluorescence intensity of gels with immobilized type I collagen-fluorescein as a function of position. (A) Mosaic fluorescence image of a 4 kPa/100 _μ_m gel. Image dimensions map directly to the x axis of the corresponding intensity-position plot. (B) Fluorescence intensity for gradient gels compared with a uniform gel (labeled “0 kPa/100 _μ_m”). The uniform gel was fabricated with 10% AAm and 0.31% bis; this composition was chosen because its bulk tensile modulus (50.1 ± 2.4 kPa) was in the middle of the range of moduli for the gradient gels. Bars represent standard deviations from triplicate measurements.
Cell morphology
For both uniform and gradient gels, cell morphology varied with absolute modulus: the extent of cell spreading increased with increasing modulus (compare the lower-modulus left side of the gels with stiffness gradient of 2 kPa/100 _μ_m (Fig. 2 B) and 4 kPa/100 _μ_m (Fig. 2 C) with other regions on the gradient gels). However, a gradient in modulus had no effect on the extent of spreading. In contrast, although the percentage of cells that were polarized increased with increasing modulus on uniform gels (Fig. 4 A), most cells were polarized on gradient gels (Fig. 4 B), independently of gradient strength. Fig. S2 provides a higher-resolution image of polarized and unpolarized cells on a gradient.
Figure 4.
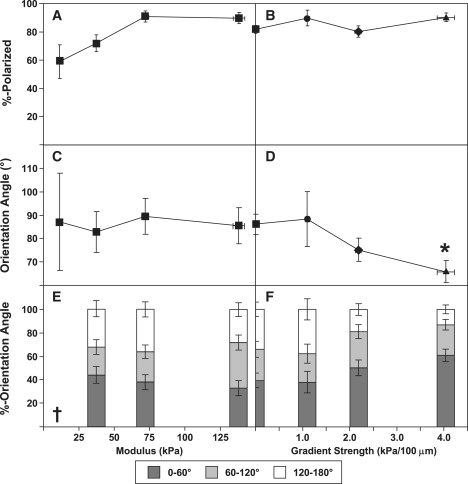
Polarization and orientation for cells on uniform (A, C, and E) and gradient (B, D, and F) gels. (A and B) Percentage of cells with recognizable lamellipodia. (C and D) Average cell orientation with respect to an arbitrary reference direction for uniform gels (C) and gradient direction for gradient gels (D). A cell orientation of 0° indicates perfect alignment in the direction of the gradient; an orientation of 180° indicates perfect alignment in the direction opposite the gradient. Data labeled with ∗ correspond to p < 0.05 compared with uniform gels. (_E_ and _F_) Histograms of orientation angle. Data for 0 kPa/100 _μ_m were based on pooling data for all uniform gels. Histograms were not statistically distinguishable. The † symbol indicates that only 10 cells were available for this condition, in contrast to >30 cells for all other conditions.
We observed that the average orientation of cells on uniform gels was not a function of modulus (Fig. 4 C). However, cells on gradient gels aligned on average in the direction of the gradient. This alignment strengthened as the gradient strength increased (Fig. 4 D). This result also can be seen in pooled data plotted as histograms (Fig. 4, E and F): cells on uniform gels were distributed approximately equally among possible directions, but as the gradient strength increased, the fraction of cells oriented against the gradient (orientation angles of 120–180°) decreased and the fraction oriented in the direction of the gradient (orientation angles of 0–60°) increased. Unfortunately, we would need to examine a substantially larger number of cells to analyze these histograms for statistical significance. However, cell orientation depended only on gradient strength, not on absolute stiffness: scatter plots of orientation angle versus absolute modulus for gradient gels (Fig. 5) were uncorrelated for the three gradient conditions examined (r = −0.22, p = 0.26 for 1 kPa/100 _μ_m; r = − 0.07, p = 0.61 for 2 kPa/100 _μ_m; and r = 0.07, p = 0.51 for 4 kPa/100 _μ_m).
Figure 5.

Scatter plots of cell orientation angle on gradient gels as a function of tensile modulus for different gradient strengths: (A) 1 kPa/100 _μ_m, (B) 2 kPa/100 _μ_m, and (C) 4 kPa/100 _μ_m. Vertical dotted lines delimit the range of moduli for individual gradients.
Cell motility
We qualitatively assessed cell motility on uniform and gradient gels from windrose plots of cell paths (Fig. 6). For uniform gels, we observed an increase in the length of cell tracks over a 20-h period as modulus was increased (Fig. 6 A), reflected by an increase in cell speed as gel stiffness increased (data not shown). For gradient gels, we found that more cells traveled toward the stiffer region of the gradient as the magnitude of the stiffness gradient increased (Fig. 6 B), indicating that the cells preferentially migrated toward the stiffer side of the substrate. In contrast, cells on uniform gels did not exhibit any directional bias in their migration.
Figure 6.

Windrose displays of typical paths of VSMCs over 20-h periods on uniform gels (A, top row) and gradient gels (B, bottom row). Arrows indicate direction of gradient from softer to stiffer region.
Because the persistence time of the cells used in this study was found to be in the range of ∼1–2 h (data not shown) and cells were tracked for 20 h, the TI for each cell was calculated using the simplified expression in Eq. 3. As expected, cells on uniform gels did not exhibit on average biased migration regardless of absolute modulus (Fig. 7 A). In contrast, cells on gradient gels exhibited biased migration in the direction of increasing stiffness, with average TI increasing as the magnitude of the stiffness gradient increased (Fig. 7 B). In particular, the average TI of cells on gradients of 2 and 4 kPa/100 _μ_m was significantly larger than on uniform substrates (p < 0.05), with a maximum average value of ∼0.25 observed on the steepest gradient. This result is consistent with qualitative results from windrose displays (Fig. 6 B) showing that cells preferentially migrated toward regions of higher substrate stiffness.
Figure 7.

Directional motility, evaluated as the TI, for cells on uniform gels (A and C) and gradient gels (B and D). (A and B) Average TI as a function of absolute stiffness for uniform gels (A) and as a function of stiffness gradient for gradient gels (B). Data labeled with ∗ correspond to p < 0.05 compared with uniform gels. (C and D) Histograms of TI for uniform gels (C) and gradient gels (D). Histograms were not statistically distinguishable. Data for 0 kPa/100 _μ_m were based on pooled data for all uniform gels.
Further analysis of the pooled TI data showed that the distributions of TIs were independent of modulus for uniform gels (Fig. 7 C). In contrast, the fraction of cells with positive values for the TI—indicating migration in the direction of increasing stiffness—increased as gradient strength increased (Fig. 7 D); however, analysis for statistical significance would require a substantially larger number of cells to be examined. As was observed for cell orientation, TI depended only on gradient strength, not on absolute stiffness: scatter plots of TI versus absolute modulus for gradient gels (Fig. 8) were uncorrelated for the three gradient conditions examined (1 kPa/100 _μ_m: r = 0.00, p = 0.98; 2 kPa/100 _μ_m: r = +0.11, p = 0.95; and 4 kPa/100 _μ_m: r = −0.07, p = 0.50).
Figure 8.

Scatter plots of TI on gradient gels as a function of tensile modulus for different gradient strengths: (A) 1 kPa/100 _μ_m, (B) 2 kPa/100 _μ_m, and (C) 4 kPa/100 _μ_m. The tensile modulus for each cell corresponds to the modulus for the cell's starting position upon tracking. Vertical dotted lines delimit the range of moduli for individual gradients.
Discussion
To our knowledge, this study is the first to describe and evaluate durotaxis using the well-characterized methods developed for the study of chemotaxis. Our study also represents a significant advance from our earlier work (8) in that previous methods for generating gradients in stiffness produced substrates with both much narrower ranges and shallower gradients in stiffness (2–12 kPa and 0.1 kPa/100 _μ_m, respectively). Although we focused here on the response of VSMCs, the methodologies developed in this work can be applied readily to other types of cells.
The steepness of gradients in compliance for this study was restricted due to practical limitations in width (gels <2800 _μ_m wide were easily damaged during disassembly of the microfluidic device) and by a maximum allowable bis concentration of 0.6% (above which the relationship between concentration and stiffness became nonlinear (33)). As a consequence, achieving gradients with sufficient strength required a three-input system with an asymmetrical distribution of bis, which produced gels with a relatively uniform region and a region with an essentially linear gradient. It is also important to note that the gradients generated with microfluidics devices are actually step gradients because discrete lanes of differing bis concentrations are generated by the mixing tree and maintained throughout the length of the outlet channel by laminar flow. Given the size of the steps in our system (7 × 400 _μ_m wide lanes), there is a potential concern that cells toward the middle of any given lane would not experience a gradient in compliance. However, mechanical coupling between adjacent lanes can produce a higher apparent stiffness in a softer region that is adjacent to a stiffer region, and a lower apparent stiffness in a stiffer region adjacent to a softer region (34), resulting in gels with “smoother” changes in apparent stiffness across their widths than predicted based on discrete steps in cross-linker concentration. The AFM measurements in this study were obtained with insufficient spatial resolution to discern the extent of mechanical coupling. However, Kidoaki and Matsuda (11) recently showed that mechanical coupling extended ∼200 _μ_m to either side of a discrete step in cross-link density. Thus, because the width of lanes in our devices was 400 _μ_m, we expect that the mechanical coupling was sufficient for any cell on a gradient gel to experience an apparent gradient in stiffness.
Both random and directed cell migrations require a cell to adopt a distinct polarity (35). Our observation that ∼90% of the cells on a gradient were polarized, independently of gradient strength, could not be predicted by observing cells on uniform substrata, where the percentage of polarized cells depended on the absolute modulus and was significantly lower on substrata with moduli < 50 kPa. The high degree of polarization on gradient gels is even more striking if one considers that moduli on both 1 kPa/100 _μ_m and 2 kPa/100 _μ_m gels did not exceed 50 kPa, and that only a small fraction (∼10–15%) of 4 kPa/100 _μ_m gradient gels had moduli > 50 kPa. These observations imply that the mere presence of a gradient in stiffness is sufficient to trigger polarization. Although others have established the effects of gradients in soluble (36,37) and substrate-bound (38) chemical cues on cell polarization, we are unaware of any previous reports linking gradients in stiffness to polarization. Further, our novel observation that increasing the magnitude of the stiffness gradient resulted in increased cell orientation in the gradient direction compares favorably with previous studies that reported increased orientation bias in response to an increasingly strong gradient of soluble (37,39) or substrate-bound (40) chemoattractant or substrate-bound extracellular matrix protein (17).
We applied a TI, a quantitative metric established in studies of chemotaxis, to describe the strength of biased cell migration due to durotaxis, with larger values indicating more biased movement in the direction of increased stiffness. In similarity to observations for chemotaxis, increasing the magnitude of a gradient in stiffness increased the average value for TI, with our observed maximum average TI of ∼0.25 matching the maximum observed for macrophages responding to the chemoattractant C5a (22). Individual VSMCs, however, exhibited a range of directional migration over a 20-h period of observation: not all VSMCs migrated in the direction of increasing stiffness, regardless of the strength of the gradient (values for TI ranging from approximately −0.75 to +0.75 were observed), and the fraction of cells that “mis-sensed” the gradient (i.e., with negative values for TI) decreased sharply as the gradient strength increased. Qualitatively similar behavior has been observed for the chemotaxis of neutrophils and predicted by a stochastic model based on statistical imperfection in cell sensing arising from fluctuations in receptor dynamics (36).
Although the biophysics of durotaxis is not identical to that of chemotaxis, a parallel can be drawn by considering micron- or submicron-scale variations in substrate stiffness as mechanical “noise”: cells on shallow gradients of stiffness with magnitudes of gradient stiffness on the order of the level of mechanical fluctuations would appear to exhibit random behavior, whereas cells on steeper gradients, which provide a higher signal/noise ratio, would be influenced primarily by the imposed gradient itself, rather than by mechanical fluctuations. This hypothesis, which requires that cells probe substrate mechanics on a micron or submicron scale, and that a sufficient amplitude of fluctuations exists, is reasonable given the evidence that cells probe their environment through lamellipodial extensions (6,41) and are capable of responding to gradients with nanometer-scale variations in ligand spacing (42). For example, Giannone et al. (43) observed that polarized mouse embryonic fibroblasts migrating on elastic substrates of uniform stiffness generated periodic lamellipodial protrusions on the order of 1 _μ_m, followed by contractions on the order of 0.2 _μ_m, and concluded that these periodic oscillations may be linked to mechanical probing of the substrate rigidity.
Two other potential influences on cellular sensing of mechanical gradients during durotaxis arise from interactions between neighboring cells and from feedback between cellular and substrate mechanics. Although we sought to minimize effects of cell-cell interactions by plating cells at relatively low densities and by disregarding cells contacting other cells, there is ample evidence that cell-generated traction forces can deform nonrigid substrata. Such mechanical perturbations may create “noise” or false local effective gradients in stiffness (34,44) that could interfere with the ability of the cell to sense the imposed macroscopic stiffness gradient. Several investigators have reported that durotaxis is suppressed at high cell densities (10,45), and postulated that cell traction on the substrate modulates the behavior of neighboring cells. The consequences of feedback between cell and substrate mechanics are based on observations that substrate stiffness modulates cell stiffness (46). The cell biology of this phenomenon is complex, but can now be addressed with the use of techniques such as optical tweezers (47).
Although this study demonstrates that there are significant parallels between the phenomenological responses of durotaxis and chemotaxis, and hints at broader connections between these phenomena and how cells respond to gradients in general, considerable work needs to be done to elucidate the mechanisms underlying the phenomenon of durotaxis. For example, although we did not detect an upper limit to the degree of stiffness (both absolute and gradient) that a cell is capable of sensing, such limits likely exist (as observed for chemotaxis). In the cases of chemotaxis and haptotaxis, both deterministic and stochastic models of how soluble and substrate-bound factors control cell migration have provided significant insights into the mechanisms by which cells respond to chemical cues through accurate predictions of experimental data. Similar models for durotaxis (48–50), on the other hand, have been hampered by a lack of experimental data with which these models can be assessed and refined. The data presented here will provide crucial information for the further development of accurate predictive models for durotaxis. Further work is also warranted to extend this study to other types of cells and substrates, and to more completely evaluate the mechanics of hydrogels, including the interplay between local heterogeneity and cell-generated forces and its effect on cell response. Ultimately, investigations into how cells probe their local environment and integrate a range of signals (substrate mechanics, growth factors, adhesion molecules, etc.), and to what extent there exists cross talk and convergence between various signaling pathways, may offer insights into how cells such as VSMCs respond to multiple complex stimuli in vivo.
Supporting Material
A table and two figures are available at http://www.biophysj.org/biophysj/supplemental/S0006-3495(09)01154-0.
Supporting Material
Document S1. A table and two figures
Acknowledgments
We thank J. Mach for assistance with the experiments, and C. M. Klapperich and J. J. Jacot for input on the AFM measurements. We also thank the staff of the clean room in the Boston University Photonics Center for use of the microfabrication facilities, and O. V. Sazonova, R. D. Whitaker, and M. L. Smith for helpful discussions and a critical reading of the manuscript.
This work was supported by the National Institutes of Health (R01 HL72900) and a National Science Foundation CAREER Award (BES-9985338) to J.Y.W.
Footnotes
Brett C. Isenberg and Paul A. DiMilla contributed equally to this work.
Sooyoung Kim's present address is Harvard School of Dental Medicine, Boston, Massachusetts.
Contributor Information
Paul A. DiMilla, Email: p.dimilla@neu.edu.
Joyce Y. Wong, Email: jywong@bu.edu.
References
- 1.Berry M.F., Engler A.J., Woo Y.J., Pirolli T.J., Bish L.T. Mesenchymal stem cell injection after myocardial infarction improves myocardial compliance. Am. J. Physiol. Heart Circ. Physiol. 2006;290:H2196–H2203. doi: 10.1152/ajpheart.01017.2005. [DOI] [PubMed] [Google Scholar]
- 2.Brown X.Q., Ookawa K., Wong J.Y. Evaluation of polydimethylsiloxane scaffolds with physiologically-relevant elastic moduli: interplay of substrate mechanics and surface chemistry effects on vascular smooth muscle cell response. Biomaterials. 2005;26:3123–3129. doi: 10.1016/j.biomaterials.2004.08.009. [DOI] [PubMed] [Google Scholar]
- 3.Engler A., Bacakova L., Newman C., Hategan A., Griffin M. Substrate compliance versus ligand density in cell on gel responses. Biophys. J. 2004;86:617–628. doi: 10.1016/S0006-3495(04)74140-5. [DOI] [PMC free article] [PubMed] [Google Scholar]
- 4.Thomas T.W., DiMilla P.A. Spreading and motility of human glioblastoma cells on sheets of silicone rubber depend on substratum compliance. Med. Biol. Eng. Comput. 2000;38:360–370. doi: 10.1007/BF02347059. [DOI] [PubMed] [Google Scholar]
- 5.Gray D.S., Tien J., Chen C.S. Repositioning of cells by mechanotaxis on surfaces with micropatterned Young's modulus. J. Biomed. Mater. Res. 2003;66A:605–614. doi: 10.1002/jbm.a.10585. [DOI] [PubMed] [Google Scholar]
- 6.Pelham R.J., Wang Y.L. Cell locomotion and focal adhesions are regulated by substrate flexibility. Proc. Natl. Acad. Sci. USA. 1997;94:13661–13665. doi: 10.1073/pnas.94.25.13661. [DOI] [PMC free article] [PubMed] [Google Scholar]
- 7.Peyton S.R., Putnam A.J. Extracellular matrix rigidity governs smooth muscle cell motility in a biphasic fashion. J. Cell. Physiol. 2005;204:198–209. doi: 10.1002/jcp.20274. [DOI] [PubMed] [Google Scholar]
- 8.Wong J.Y., Velasco A., Rajagopalan P., Pham Q. Directed movement of vascular smooth muscle cells on gradient compliant hydrogels. Langmuir. 2003;19:1908–1913. [Google Scholar]
- 9.Mammoto A., Connor K.M., Mammoto T., Yung C.W., Huh D. A mechanosensitive transcriptional mechanism that controls angiogenesis. Nature. 2009;457:1103–1108. doi: 10.1038/nature07765. [DOI] [PMC free article] [PubMed] [Google Scholar]
- 10.Lo C.M., Wang H.B., Dembo M., Wang Y.L. Cell movement is guided by the rigidity of the substrate. Biophys. J. 2000;79:144–152. doi: 10.1016/S0006-3495(00)76279-5. [DOI] [PMC free article] [PubMed] [Google Scholar]
- 11.Kidoaki S., Matsuda T. Microelastic gradient gelatinous gels to induce cellular mechanotaxis. J. Biotechnol. 2008;133:225–230. doi: 10.1016/j.jbiotec.2007.08.015. [DOI] [PubMed] [Google Scholar]
- 12.Wang H.B., Dembo M., Hanks S.K., Wang Y. Focal adhesion kinase is involved in mechanosensing during fibroblast migration. Proc. Natl. Acad. Sci. USA. 2001;98:11295–11300. doi: 10.1073/pnas.201201198. [DOI] [PMC free article] [PubMed] [Google Scholar]
- 13.Domingo A. Exponential gradient maker using a disposable syringe. Anal. Biochem. 1990;189:88–90. doi: 10.1016/0003-2697(90)90049-f. [DOI] [PubMed] [Google Scholar]
- 14.Dertinger S.K.W., Chiu D.T., Jeon N.L., Whitesides G.M. Generation of gradients having complex shapes using microfluidic networks. Anal. Chem. 2001;73:1240–1246. [Google Scholar]
- 15.Jeon N.L., Dertinger S.K.W., Chiu D.T., Choi I.S., Stroock A.D. Generation of solution and surface gradients using microfluidic systems. Langmuir. 2000;16:8311–8316. [Google Scholar]
- 16.Jeon N.L., Baskaran H., Dertinger S.K., Whitesides G.M., Van de Water L. Neutrophil chemotaxis in linear and complex gradients of interleukin-8 formed in a microfabricated device. Nat. Biotechnol. 2002;20:826–830. doi: 10.1038/nbt712. [DOI] [PubMed] [Google Scholar]
- 17.Dertinger S.K., Jiang X., Li Z., Murthy V.N., Whitesides G.M. Gradients of substrate-bound laminin orient axonal specification of neurons. Proc. Natl. Acad. Sci. USA. 2002;99:12542–12547. doi: 10.1073/pnas.192457199. [DOI] [PMC free article] [PubMed] [Google Scholar]
- 18.Zaari N., Rajagopalan P., Kim S.K., Engler A.J., Wong J.Y. Photopolymerization in microfluidic gradient generators: Microscale control of substrate compliance to manipulate cell response. Adv. Mater. 2004;16:2133–2137. [Google Scholar]
- 19.Matsumoto T., Abe H., Ohashi T., Kato Y., Sato M. Local elastic modulus of atherosclerotic lesions of rabbit thoracic aortas measured by pipette aspiration method. Physiol. Meas. 2002;23:635–648. doi: 10.1088/0967-3334/23/4/304. [DOI] [PubMed] [Google Scholar]
- 20.McClutcheon M. Chemotaxis in leukocytes. Physiol. Rev. 1946;26:319–336. doi: 10.1152/physrev.1946.26.3.319. [DOI] [PubMed] [Google Scholar]
- 21.Othmer H.G., Dunbar S.R., Alt W. Models of dispersal in biological systems. J. Math. Biol. 1988;26:263–298. doi: 10.1007/BF00277392. [DOI] [PubMed] [Google Scholar]
- 22.Farrell B.E., Daniele R.P., Lauffenburger D.A. Quantitative relationships between single-cell and cell-population model parameters for chemosensory migration responses of alveolar macrophages to C5a. Cell Motil. Cytoskeleton. 1990;16:279–293. doi: 10.1002/cm.970160407. [DOI] [PubMed] [Google Scholar]
- 23.Tsukruk V.V., Huang Z., Chizhik S.A., Gorbunov V.V. Probing of micromechanical properties of compliant polymeric materials. J. Mater. Sci. 1998;33:4905–4909. [Google Scholar]
- 24.Domke J., Radmacher M. Measuring the elastic properties of thin polymer films with the atomic force microscope. Langmuir. 1998;14:3320–3325. [Google Scholar]
- 25.Engler A.J., Richert L., Wong J.Y., Picart C., Discher D.E. Surface probe measurements of the elasticity of sectioned tissue, thin gels and polyelectrolyte multilayer films: correlations between substrate stiffness and cell adhesion. Surf. Sci. 2004;570:142–154. [Google Scholar]
- 26.Gaudet C., Marganski W.A., Kim S., Brown C.T., Gunderia V. Influence of type I collagen surface density on fibroblast spreading, motility, and contractility. Biophys. J. 2003;85:3329–3335. doi: 10.1016/S0006-3495(03)74752-3. [DOI] [PMC free article] [PubMed] [Google Scholar]
- 27.DiMilla P.A., Quinn J.A., Albelda S.M., Lauffenburger D.A. Measurement of individual cell-migration parameters for human tissue-cells. AIChE. J. 1992;38:1092–1104. [Google Scholar]
- 28.Dunn G.A. Characterising a kinesis response: time averaged measures of cell speed and directional persistence. Agents Actions Suppl. 1983;12:14–33. doi: 10.1007/978-3-0348-9352-7_1. [DOI] [PubMed] [Google Scholar]
- 29.Gail H.M., Boone C.W. The locomotion of mouse fibroblasts in tissue culture. Biophys. J. 1970;10:980–993. doi: 10.1016/S0006-3495(70)86347-0. [DOI] [PMC free article] [PubMed] [Google Scholar]
- 30.Lauffenburger D.A., Linderman J.J. Oxford University Press; New York: 1993. Receptors: Models for Binding, Trafficking, and Signalling. [Google Scholar]
- 31.Press W.H., Flannery B.P., Teukolsky S.A., Vetterling W.T. 2nd ed. Cambridge University Press; New York: 1992. Numerical Recipes in C: The Art of Scientific Computing. [Google Scholar]
- 32.Kaufman J.D., Miller G., Morgan E.F., Klapperich C.M. Time-dependent mechanical characterization of poly(2-hydroxyethyl methacrylate) hydrogels using nanoindentation and unconfined compression. J. Mater. Res. 2008;23:1472–1481. doi: 10.1557/JMR.2008.0185. [DOI] [PMC free article] [PubMed] [Google Scholar]
- 33.Benguigui L. Comparison between the elasticity of polyacrylamide and polyacrylic gels. J. Phys. II France. 1995;5:437–443. [Google Scholar]
- 34.Schwarz U.S., Erdmann T., Bischofs I.B. Focal adhesions as mechanosensors: the two-spring model. Biosystems. 2006;83:225–232. doi: 10.1016/j.biosystems.2005.05.019. [DOI] [PubMed] [Google Scholar]
- 35.Bray D. Garland Publishing; New York: 2001. Cell Movements: From Molecules to Motility. [Google Scholar]
- 36.Tranquillo R.T., Lauffenburger D.A., Zigmond S.H. A stochastic model for leukocyte random motility and chemotaxis based on receptor binding fluctuations. J. Cell Biol. 1988;106:303–309. doi: 10.1083/jcb.106.2.303. [DOI] [PMC free article] [PubMed] [Google Scholar]
- 37.Zigmond S.H. Ability of polymorphonuclear leukocytes to orient in gradients of chemotactic factors. J. Cell Biol. 1977;75:606–616. doi: 10.1083/jcb.75.2.606. [DOI] [PMC free article] [PubMed] [Google Scholar]
- 38.Smith J.T., Elkin J.T., Reichert W.M. Directed cell migration on fibronectin gradients: effect of gradient slope. Exp. Cell Res. 2006;312:2424–2432. doi: 10.1016/j.yexcr.2006.04.005. [DOI] [PubMed] [Google Scholar]
- 39.Rivero M., Tranquillo R., Buettner H., Lauffenburger D. Transport models for chemotactic cell populations based on individual cell behavior. Chem. Eng. Sci. 1989;44:2881–2897. [Google Scholar]
- 40.DeLong S.A., Moon J.J., West J.L. Covalently immobilized gradients of bFGF on hydrogel scaffolds for directed cell migration. Biomaterials. 2005;26:3227–3234. doi: 10.1016/j.biomaterials.2004.09.021. [DOI] [PubMed] [Google Scholar]
- 41.Galbraith C.G., Yamada K.M., Galbraith J.A. Polymerizing actin fibers position integrins primed to probe for adhesion sites. Science. 2007;315:992–995. doi: 10.1126/science.1137904. [DOI] [PubMed] [Google Scholar]
- 42.Arnold M., Hirschfeld-Warneken V.C., Lohmuller T., Heil P., Blummel J. Induction of cell polarization and migration by a gradient of nanoscale variations in adhesive ligand spacing. Nano Lett. 2008;8:2063–2069. doi: 10.1021/nl801483w. [DOI] [PMC free article] [PubMed] [Google Scholar]
- 43.Giannone G., Dubin-Thaler B.J., Dobereiner H.G., Kieffer N., Bresnick A.R. Periodic lamellipodial contractions correlate with rearward actin waves. Cell. 2004;116:431–443. doi: 10.1016/s0092-8674(04)00058-3. [DOI] [PubMed] [Google Scholar]
- 44.Sen S., Engler A., Discher D. Matrix strains induced by cells: computing how far cells can feel. Cell. Mol. Bioeng. 2009;2:39–48. doi: 10.1007/s12195-009-0052-z. [DOI] [PMC free article] [PubMed] [Google Scholar]
- 45.Reinhart-King C.A., Dembo M., Hammer D.A. Cell-cell mechanical communication through compliant substrates. Biophys. J. 2008;95:6044–6051. doi: 10.1529/biophysj.107.127662. [DOI] [PMC free article] [PubMed] [Google Scholar]
- 46.Solon J., Levental I., Sengupta K., Georges P.C., Janmey P.A. Fibroblast adaptation and stiffness matching to soft elastic substrates. Biophys. J. 2007;93:4453–4461. doi: 10.1529/biophysj.106.101386. [DOI] [PMC free article] [PubMed] [Google Scholar]
- 47.Allioux-Guerin M., Icard-Arcizet D., Durieux C., Henon S., Gallet F. Spatio-temporal analysis of cell response to a rigidity gradient: a quantitative study by multiple optical tweezers. Biophys. J. 2008;96:238–247. doi: 10.1529/biophysj.108.134627. [DOI] [PMC free article] [PubMed] [Google Scholar]
- 48.Lazopoulos K.A., Stamenovic D. Durotaxis as an elastic stability phenomenon. J. Biomech. 2008;41:1289–1294. doi: 10.1016/j.jbiomech.2008.01.008. [DOI] [PubMed] [Google Scholar]
- 49.Moreo P., Garcia-Aznar J.M., Doblare M. Modeling mechanosensing and its effect on the migration and proliferation of adherent cells. Acta Biomater. 2008;4:613–621. doi: 10.1016/j.actbio.2007.10.014. [DOI] [PubMed] [Google Scholar]
- 50.Ni Y., Chiang M.Y.M. Cell morphology and migration linked to substrate rigidity. Soft Matter. 2007;3:1285–1292. doi: 10.1039/b703376a. [DOI] [PubMed] [Google Scholar]
Associated Data
This section collects any data citations, data availability statements, or supplementary materials included in this article.
Supplementary Materials
Document S1. A table and two figures