Widespread transcription at neuronal activity-regulated enhancers (original) (raw)
. Author manuscript; available in PMC: 2011 Jan 12.
Published in final edited form as: Nature. 2010 Apr 14;465(7295):182–187. doi: 10.1038/nature09033
Abstract
We used genome-wide sequencing methods to study stimulus-dependent enhancer function in neurons. We identified ∼12,000 neuronal activity-regulated enhancers that are bound by the general transcriptional co-activator CBP in an activity-dependent manner. A function of CBP at enhancers may be to recruit RNA polymerase II (RNAPII), as we also observed activity-regulated RNAPII binding to thousands of enhancers. Remarkably, RNAPII at enhancers transcribes bi-directionally a novel class of enhancer RNAs (eRNAs) within enhancer domains defined by the presence of histone H3 that is mono-methylated at lysine 4 (H3K4me1). The level of eRNA expression at neuronal enhancers positively correlates with the level of mRNA synthesis at nearby genes, suggesting that eRNA synthesis occurs specifically at enhancers that are actively engaged in promoting mRNA synthesis. These findings reveal that a widespread mechanism of enhancer activation involves RNAPII binding and eRNA synthesis.
During development and in mature organisms, cells respond to changes in their environment in part through changes in gene expression. Extracellular factors including growth factors, hormones, and neurotransmitters activate programs of new gene expression in a manner that is temporally and spatially controlled by the coordinated action of trans-acting transcription factors (TFs) that bind to _cis_-acting DNA regulatory elements including enhancers, insulators, and promoters. Most studies of the mechanisms by which gene expression is induced in response to extracellular stimuli have focused on promoters, which lie adjacent to the site at which mRNA synthesis is initiated. In contrast, the mechanisms by which enhancers1, which lie far away from the start site of mRNA synthesis, contribute to stimulus-dependent gene expression are not well characterized. In the nervous system, hundreds of genes are induced in response to sensory experience-dependent neuronal activation2. Exposure of primary neuronal cultures to an elevated level of potassium chloride (KCl) can lead to membrane depolarization and an influx of calcium through L-type voltage-sensitive calcium channels2. The resulting increase in intracellular calcium level then triggers several calcium-dependent signaling pathways that ultimately lead to changes in nuclear gene expression. We used this in vitro neuronal culture system to characterize neuronal activity-regulated enhancers.
Defining activity-regulated enhancers
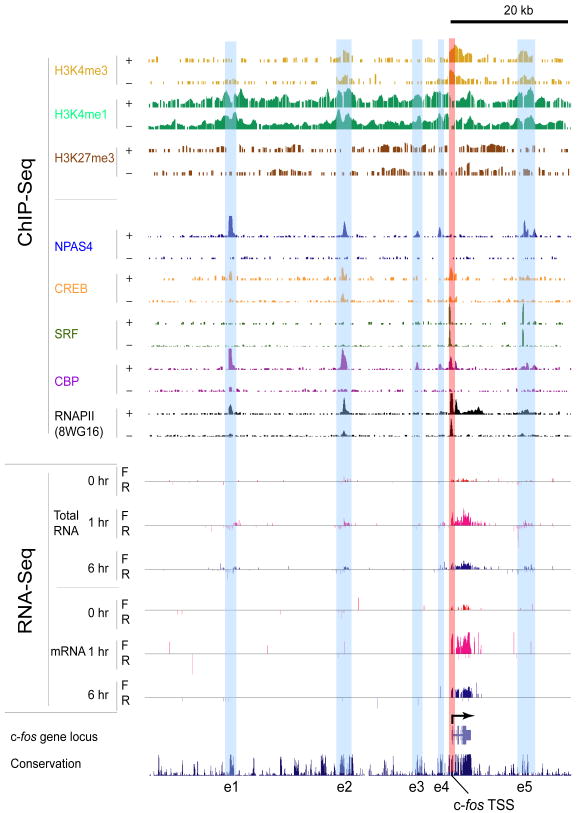
Recent genome-wide studies have established that enhancers can be defined as DNA sequences that bind the transcriptional co-activator p300/CBP, that bind H3K4me1, and that are located distally from known transcription start sites (TSSs)3-5. We applied these criteria to define neuronal activity-regulated enhancers. Using ChIP-Seq6, we first identified CBP binding sites throughout the mouse genome using two different antibodies against CBP and selected only those CBP-bound genomic loci detected by both antibodies (Methods). We found that CBP binding genome-wide is dramatically increased upon membrane depolarization (Figs. 1, 2 middle, and Supplementary Figs. 1e, 2, 3). Prior to stimulation, we detected fewer than 1,000 CBP binding sites, whereas upon membrane depolarization we detected ∼28,000 CBP binding sites (Methods). Of the CBP sites detected upon membrane depolarization, ∼25,000 were at least 1 kb distal to known TSSs, suggesting that most activity-dependent CBP binding does not occur at promoters. To specifically identify CBP binding sites at enhancers, we asked which of the distal CBP sites are also bound by H3K4me1-modified histones, which mark active chromatin regions including enhancers3,7,8. About 13,000 distal CBP sites are located within 2 kb of H3K4me1-modified regions (Figs. 1, 2b, and Supplementary Figs. 1c, 3). We removed from this enhancer list a subset (7%) of enhancers that in addition to binding H3K4me1 also bind the transcription initiation site-associated histone mark H3K4me37,8 and therefore may represent uncharacterized promoters (Figs. 1, 2 top, and Supplementary Figs 1c, 3, 8a). We defined the remaining ∼12,000 genomic loci where distal CBP sites are flanked by H3K4me1 as neuronal enhancers (see Methods for detailed description of enhancer isolation). Approximately half of the neuronal enhancers have evolutionarily conserved sequences in the region of CBP binding, suggesting that these enhancers are functionally important (Fig. 1 and Supplementary Fig. 1a, b).
Figure 1. Enhancers near the c-fos gene with increased CBP/RNAPII/NPAS4 binding and eRNA production upon membrane depolarization.
ChIP-Seq: for each histone modification or transcription factor (TF), two horizontal rows display the numbers of input-normalized ChIP-Seq reads across the locus, with “+” and “−” denoting the membrane-depolarized (2 hours KCl) and unstimulated conditions, respectively. RNA-Seq: for each of 0, 1, or 6 hours of membrane-depolarization, the numbers of reads aligning to forward (F) and reverse (R) genomic strands are separately displayed. Enhancers identified in this study are highlighted by light-blue vertical bars (e1–e5), and the promoter region of c-fos gene is shown by a vertical light-red bar.
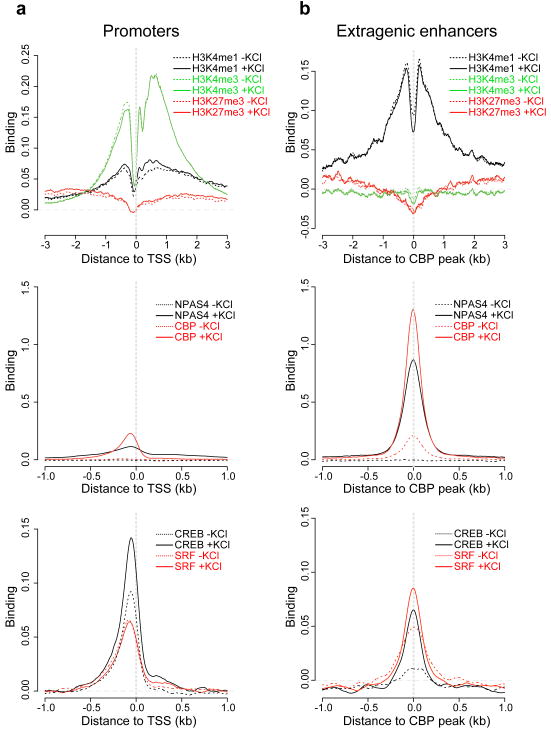
Figure 2. Comparison of binding profiles between promoters and neuronal activity-regulated enhancers.
Binding profiles of methylated histones and TFs at the promoter transcription start sites (TSSs) of 25,562 annotated genes (a) versus 5,117 extragenic enhancers (b). In each panel, binding profiles of methylated histones (top), CBP and NPAS4 (middle), and CREB and SRF (bottom) from unstimulated and membrane-depolarized (2 hours KCl) neurons are shown. The _y_-axes denote the degree of binding averaged across all promoters or enhancers, expressed as the mean number of input-normalized ChIP-Seq reads. Promoters are aligned at their annotated TSSs, and enhancers are aligned at their CBP binding sites, with the _x_-axes indicating the distance (kb) to either the TSS or the CBP site.
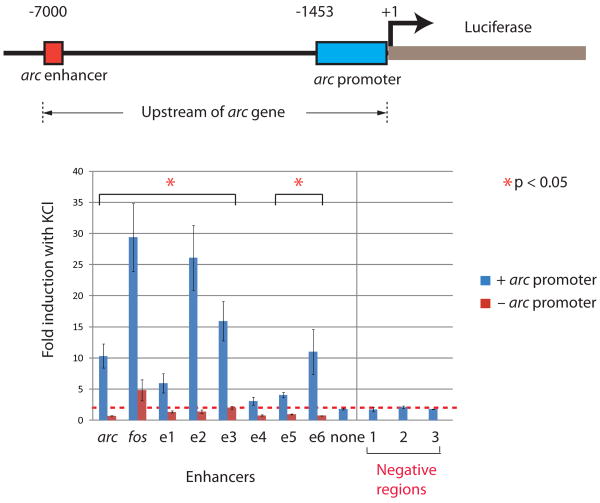
The strong inducibility of CBP binding at thousands of neuronal enhancers and their presence near activity-regulated genes (e.g., c-fos, rgs, and nr4a2) (Fig. 1 and Supplementary table 2) suggests that these enhancers may contribute to the induction of activity-regulated gene expression. One activity-regulated neuronal enhancer was independently identified as an enhancer that drives the activity-regulated transcription of arc/arg3.1, a gene that regulates synaptic function9-12. This arc enhancer, which is located 7 kb upstream of the arc TSS, is necessary to drive activity-regulated arc transcription13,14. To determine if the activity-regulated enhancers we identified have the ability to induce transcription at a promoter in an activity-dependent manner, we tested seven of the enhancers in a luciferase reporter assay (Fig. 3). We found that six out of seven enhancers were able to induce expression of luciferase in an activity-dependent manner. Consistent with the known properties of enhancers, the induction of luciferase expression required the presence of an intact promoter.
Figure 3. Activty-induced luciferase expression mediated by neuronal enhancers.
The arc enhancer was replaced by various neuronal enhancers in the context of the ∼7 kb region upstream of the arc gene. The resulting fragments were placed upstream of a luciferase reporter gene, and activity-dependent expression of luciferase was measured in the presence or absence of the arc proximal promoter after six hours KCl treatment. In additional control experiments, the arc enhancer was removed, or three randomly chosen extragenic loci that do not show enhancer features were inserted. The red dotted line indicates the mean induction value of the three negative regions tested. Error bars, s.e.m (n=3 biological replicates); _p_-value from _t_-test.
Characterization of enhancers
We next asked what properties of the enhancers in addition to CBP binding change dynamically when neurons are exposed to a stimulus that triggers activity-regulated gene transcription. H3K4me1 exhibits a bi-modal pattern of binding that spans a 2–4 kb region with CBP binding at its center. We defined these H3K4me1-binding regions surrounding CBP binding sites as enhancer domains (Fig. 2b, top, and Supplementary Figs.1c, 2). The enhancer domains have very low levels of H3K4me3 and are devoid of H3K27me3, a histone marker that has been shown to be associated with either repressed or inactive genes. Furthermore the levels of these histone marks are not significantly changed with membrane depolarization, suggesting that enhancer domains are maintained in an open chromatin conformation that is accessible for transcription factor binding, even in the absence of gene induction.
We asked whether TFs that are known to mediate activity-regulated gene expression bind to enhancers constitutively or in an activity-regulated manner. CREB, SRF, and NPAS4 are known activity-regulated TFs that play an important role in various aspects of brain development including neuronal survival, synapse development and synaptic plasticity15,16. We find in neurons that CREB, SRF, and NPAS4 bind to neuronal enhancers as well as promoters (Supplementary Table 3). Although both CREB and SRF bind enhancers before membrane depolarization, their binding at enhancers in some cases appears to be increased upon membrane depolarization (Figs. 1, 2 bottom, and Supplementary Figs. 1d, 2, 4a). In contrast, the binding of NPAS4, which is not present in neurons at significant levels prior to membrane depolarization16, was not detected prior to stimulation but was found at ∼28,000 sites in membrane-depolarized neurons (Figs. 1, 2 middle, and Supplementary Figs. 1e, 2, 3). NPAS4 binding was strongly biased towards enhancers relative to promoters, suggesting that NPAS4 may play a specific role in enhancer function (Supplementary Fig. 4a). Although we have shown that enhancer domains can be as long as 4kb, our analysis of CREB, SRF, NPAS4, and CBP binding to enhancers indicates that these factors are predominantly located within 100 bp of the highly conserved center of the enhancer domain (Supplementary Fig. 4b). This tight co-localization of individual TFs with CBP at a subset of enhancers (Supplementary Table 4) suggests that TFs may work together to regulate enhancer function, possibly by recruiting CBP.
Transcription at enhancers
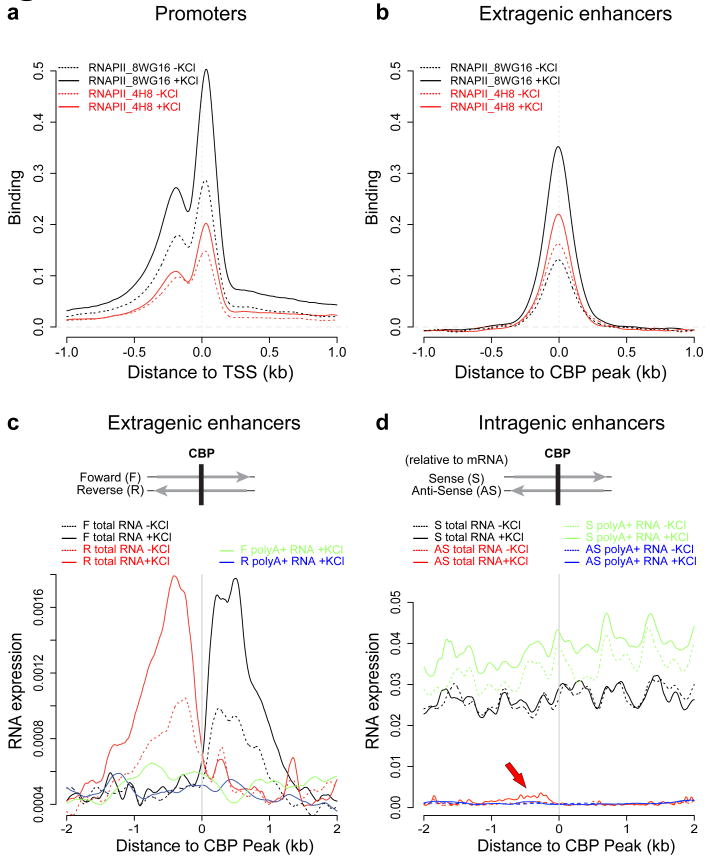
At promoters, CBP recruits components of the basal transcription machinery, including RNAPII, thereby facilitating the assembly of functional transcription complexes that initiate mRNA synthesis17. Since CBP binds to enhancers in an activity-dependent manner, we asked if CBP also recruits RNAPII to these enhancers. To address this issue, we used ChIP-Seq to identify RNAPII binding sites across the genome using two different RNAPII antibodies. Consistent with previous studies18,19, a large number of RNAPII sites were found to be located near annotated TSSs (Figs. 1, 4a and Supplementary Fig. 4a). Surprisingly RNAPII also bound to ∼3,000 activity-regulated enhancers (25%) (Figs. 1, 4b, and Supplementary Figs. 1f, 3, 4a), and the level of RNAPII binding was increased about 2-fold upon membrane depolarization (Supplementary Fig. 2). While RNAPII has previously been reported to be present at several enhancers, including the β-globin and MHC class II gene enhancers20,21, it has not been thought to play a widespread role in enhancer function. Given that CBP was previously known to recruit RNAPII to promoters and that increases in CBP and RNAPII binding coincide at thousands of enhancers in membrane depolarized neurons, it is likely that CBP plays a role in the activity-regulated increase in RNAPII binding at enhancers. However, the observation that RNAPII is present at only a subset of CBP-bound enhancers suggests that additional activation steps beyond CBP binding may be required for RNAPII recruitment to enhancers.
Figure 4. Enhancers bind RNA Polymerase II (RNAPII) and produce eRNAs.
a, Binding profile of RNAPII at 25,562 TSSs of annotated genes using two different anti-RNAPII antibodies (8WG16 or 4H8). b, Binding profile of RNAPII at 5,117 extragenic enhancers. c-d, Profile of RNA expression at extragenic enhancers (c) and at 6,718 intragenic enhancers (d) based on RNA sequencing of the total RNA and polyA+ RNA fractions. The _y_-axes report RNA expression as the normalized number of RNA-Seq reads per bp (Methods). In (c), F and R denote forward (+) and reverse (-) genomic strands. In (d), enhancers are aligned oriented relative to the gene in which they reside to allow for sense and anti-sense RNA-Seq reads to be shown separately. While sense eRNAs cannot be detected due to overlapping mRNA transcription, the red arrow indicates a local increase in anti-sense RNA expression attributable to eRNAs (statistics in Methods). Note different scales on the _y_-axis in (c) and (d).
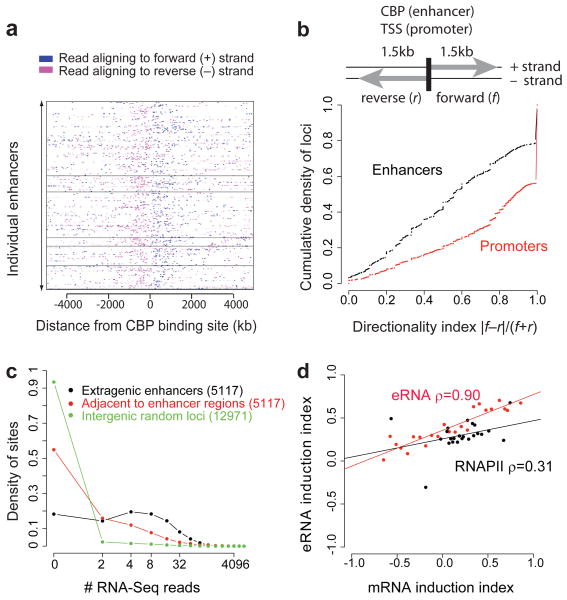
The presence of RNAPII at enhancers raises the possibility that RNA transcription may occur at enhancers. Alternatively, the detection of RNAPII at enhancers might be an indirect consequence of the interaction of enhancers with active promoters, such that promoter-bound RNAPII gets cross-linked to enhancer DNA during the preparation of cells for ChIP-Seq experiments. To distinguish between these two possibilities, we used high-throughput RNA sequencing (RNA-Seq) to determine whether enhancer-bound RNAPII drives RNA synthesis at enhancers. Since it was not clear whether enhancer-derived transcripts would be polyadenylated, we sequenced total RNA, obtained from unstimulated or membrane-depolarized neurons after ribosomal RNA was depleted. To distinguish possible enhancer-derived transcripts from mRNA transcripts, we sought evidence of RNA transcription specifically at those ∼5,000 activity-regulated enhancers located outside of annotated genes (extragenic enhancers). Surprisingly, we detected short (< 2kb) RNAs at ∼2,000 extragenic enhancers (Figs. 1, 4c, 5a and c). We observed dynamic changes in the levels of these enhancer RNAs (eRNAs) upon membrane depolarization, with a mean increase of ∼2-fold (Fig. 4c). Synthesis of eRNAs appears to initiate near enhancer centers where CBP and RNAPII are bound and to proceed bi-directionally, extending to the ends of the H3K4me1-modified enhancer domain (Figs. 1, 4c, 5a and b). Interestingly, we also detected eRNAs at ∼1,000 of ∼7,000 intragenic enhancers (Methods). Although high levels of mRNA transcription across intragenic enhancers prevented accurate quantification of eRNAs in the sense orientation, antisense eRNAs at intragenic enhancers were detectable and were similar in level to eRNAs at extragenic enhancers (Fig. 4c and d; Methods). These observations suggest that enhancers are not only sites where transcription factors bind and recruit RNAPII that might subsequently be delivered to promoters, but that enhancers are also sites where RNA synthesis occurs.
Figure 5. eRNAs are transcribed bidirectionally, and their activity-dependent induction correlates with induction of nearby genes.
a, RNA expression at 315 extragenic enhancers. The enhancers are grouped into six categories using _k_-means clustering based on eRNA, RNAPII, CBP, NPAS4, CREB, SRF, and H3K4me1 levels with categories separated by horizontal black lines. b, Directional bias of transcription initiated from enhancers and promoters, where f and r represent the numbers of reads aligning to the regions indicated (see Methods). c, The distribution of the number of RNA-Seq reads found within 1.5 kb of the extragenic enhancer loci, adjacent regions, and random regions (see Methods). d, Changes in RNAPII binding and eRNA levels at extragenic enhancers versus changes in mRNA expression levels of nearby genes upon membrane depolarization. Each dot represents a set of genes that have similar mRNA induction indices and a corresponding set of enhancers nearby those genes (see Methods). The lines are the best linear fits to the points, and ρ is the Spearman correlation coefficient.
The strand-specific synthesis of eRNAs (Figure 5a) and the dynamic changes in the level of eRNAs in response to neuronal activity suggest that the detection of eRNAs is not due to the sequencing of residual genomic DNA that is present in our purified RNA samples. Nevertheless, to confirm the existence of activity-regulated eRNAs at enhancers, we employed an alternative method (DNase I treatment followed by RT-qPCR) to detect these RNA transcripts (Supplementary Fig. 6). By RT-qPCR, we detected eRNAs at each of 18 enhancer loci tested. This result provides independent confirmation that the thousands of distinct eRNAs detected by RNA-Seq are bona fide RNA transcripts that are induced in an activity-dependent manner from neuronal enhancers.
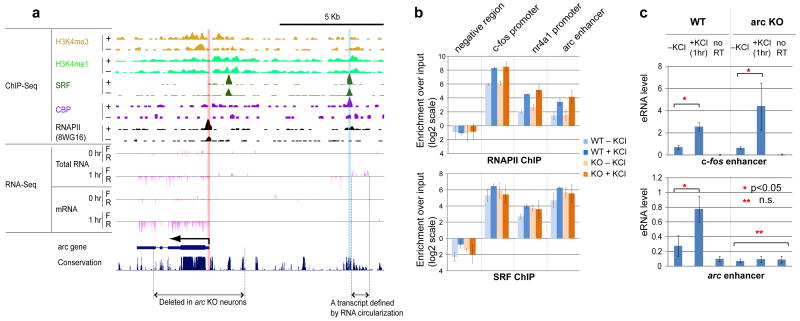
We did not detect eRNAs in RNA-Seq from polyA+ RNA fractions, suggesting that a large number of eRNAs may not be polyadenylated. While it is possible that some polyadenylated eRNAs are present but not detectable at our current sequencing depth, two independent lines of evidence suggest that a large number of eRNAs may not be polyadenylated. First, using RT-qPCR, we observed that eRNAs were detected at higher levels in randomly primed reactions compared to oligo-dT-primed RT reactions (data not shown). Second, conventional sequencing of a circularized eRNA from the arc enhancer confirmed that this transcript is not polyadenylated (Figure 6). These experiments suggest that polyadenylation may not be a common feature of eRNA synthesis.
Figure 6. eRNA synthesis but not RNAPII binding at the arc enhancer requires the presence of the arc promoter.
a, The mouse arc genomic locus with ChIP-Seq and RNA-Seq data as in Fig. 1. Also shown are the region deleted in the arc knock-out (arc KO) mouse and a non-polyadenylated eRNA transcript defined by the RNA circularization method (Methods). b, Binding profiles of RNAPII and SRF at various loci determined by ChIP-qPCR from both WT and arc KO neurons. Error bars, s.e.m. (n=2 biological replicates) c. RT-qPCR detection of the presence of eRNAs from WT and arc KO neurons. No RT represents the qPCR signal from cDNA samples generated from reactions in which reverse transcriptase was omitted. Error bars are s.e.m. (n=3 bioloigical replicates); _p_-values are from the _t_-test.
The detection of RNAPII binding and RNA synthesis at many enhancers could in principle result from mis-categorization of un-annotated promoters as enhancers. However, several lines of evidence suggest that both the extragenic and intragenic enhancers we have identified are indeed enhancers and are not un-annotated promoters. First, histone modification profiles at enhancers and annotated promoters are clearly distinguishable (Fig. 2 top and Supplementary Figs. 1c, 8a). Activity-regulated enhancers have high H3K4me1 and low H3K4me3 levels, while promoters have lower H3K4me1 and high H3K4me3 levels. Second, the observation that eRNAs do not extend beyond the ∼4kb enhancer domain suggests that the eRNAs are much shorter (<2kb for each strand) than transcripts initiated at most gene promoters (Figs. 4c, 5a). Third, unlike promoters, enhancers do not produce detectable levels of polyadenylated RNA (Fig. 4c and d). Fourth, a promoter prediction algorithm (ProSOM)22 revealed that fewer than 100 of ∼12,000 enhancer regions are predicted to be promoters compared to 8,494 out of 27,857 annotated TSSs. Fifth, while sense transcription is more prevalent than antisense transcription at most promoters, transcription at enhancers appears to be less biased toward one particular strand (Fig. 5b). Finally, a few enhancers, including the well-characterized β-globin enhancer, have previously been shown to recruit RNAPII and drive transcription23,24. These findings argue against the possibility that RNAPII-bound enhancers that produce eRNAs are actually un-annotated promoters.
Mechanism of eRNA synthesis
Our observation that only a subset of the ∼12,000 enhancers that inducibly bind CBP also bind RNAPII and drive eRNA transcription led us to hypothesize that RNAPII and/or eRNA synthesis might occur at a subset of enhancers that are actively engaged in promoting mRNA synthesis. To test this hypothesis, we investigated whether activity-regulated changes in RNAPII or eRNA levels at enhancers correlate with changes in mRNA levels at nearby genes (Fig. 5d). The assumption in this analysis is that an enhancer is most likely to promote mRNA synthesis of the nearest gene3,25. We found that changes in eRNA expression levels that occur at enhancers upon membrane depolarization are strongly correlated with changes in mRNA expression levels at nearby genes. Changes in RNAPII levels at enhancers are also, to a lesser degree, correlated with changes in mRNA expression levels at nearby genes (Fig. 5d). Given that only a fraction of enhancers exhibit inducible RNAPII binding or inducible eRNA synthesis, the binding of CBP to enhancers may not be sufficient for enhancer activation. Instead, enhancers exhibiting RNAPII binding and eRNA synthesis may represent a subset of CBP-bound enhancers that are actively engaged in promoting mRNA transcription.
The correlation between eRNA and mRNA induction suggests that eRNA synthesis may only occur when an enhancer interacts with the promoter of its target gene. In this scenario, eRNAs should not be generated from an enhancer when its target promoter is absent. We tested this hypothesis in the specific case of the arc enhancer using arc knock-out neurons in which most of the arc gene, including the arc promoter is deleted but the arc enhancer remains intact10. To characterize the arc enhancer in arc knock-out neurons, we first performed ChIP experiments testing for the binding of SRF and RNAPII, two factors that we found by ChIP-Seq to be bound to the arc enhancer (Fig. 6a and b). In arc knock-out neurons, both SRF and RNAPII remained bound at the arc enhancer at levels equivalent to those observed in wild-type neurons, indicating that the binding of SRF and RNAPII to the arc enhancer is independent of the arc promoter. However, in the absence of the arc promoter, we were not able to detect eRNA synthesis at the arc enhancer (Fig. 6c). This absence of eRNA was specific to the arc enhancer, since we observed robust induction of eRNA at a c-fos enhancer in the arc knock-out neurons. These results demonstrate that the recruitment of RNAPII to the arc enhancer is not sufficient to drive eRNA synthesis and suggest that like mRNA synthesis, eRNA synthesis may require an interaction of the enhancer with a promoter.
Discussion
We provide genome-wide evidence that thousands of neuronal activity-regulated enhancers that are defined by activity-independent H3K4me1 marks and activity-dependent CBP binding also recruit RNAPII and produce eRNAs. The observation of widespread RNAPII binding at enhancers suggests that a general mechanism of activity-dependent enhancer function in neurons may involve recruitment of RNAPII to enhancer loci, followed by subsequent transfer of RNAPII to promoters. Previous studies of a few individual enhancer loci have proposed several models for delivery of RNAPII from an enhancer to a promoter, including tracking of RNAPII along DNA and direct transfer of RNAPII via DNA looping20. Our observation that eRNAs are produced only within 2 kb enhancer domains and not along the entire distance between enhancers and promoters suggests that transcription-dependent RNAPII tracking is not likely to be a widespread mechanism of RNAPII delivery.
Our findings that large numbers of neuronal activity-regulated enhancers recruit RNAPII imply that enhancers may be more similar to promoters than previously appreciated. However, our analysis of the arc enhancer in neurons lacking the arc promoter demonstrates that the transcriptional machinery assembled at the arc enhancer is not able to drive transcriptional initiation without the arc promoter. This finding may explain why the level of eRNA synthesis is correlated with the level of transcription at the nearest promoter, and it suggests that eRNA synthesis at many enhancers may require a dynamic interaction between an enhancer and a promoter.
A remaining question is whether eRNAs have a specific biological function. In one model, the RNAPII-dependent transcriptional process at enhancers itself, rather than the eRNA transcripts it produces, may be important for enhancer function. For example, RNAPII has previously been shown to recruit chromatin-modifying enzymes such histone methyltransferases26. In this regard, it is noteworthy that eRNAs are observed only within the H3K4me1-modified enhancer domain, and the level of the H3K4me1 modification and the level of eRNA synthesis are tightly correlated (compare Figs. 1b top and 4c). Thus, the process of eRNA synthesis could be required to establish and maintain a chromatin landscape at enhancers that is required for enhancer function. However, it is also possible that the eRNA transcripts themselves are functionally important. The ability of enhancers to be transcribed in a regulated manner may provide an evolutionary mechanism by which new, functionally important genes or non-coding RNAs are generated.
Methods Summary
Directionality index at promoters and enhancers (Fig. 5b)
A directionality index was defined as |f - r|/(f + r), where f is the number of divergent reads on the forward strand and r is the number of divergent reads on the reverse strand within 1.5 kb of the CBP peak or TSS.
Calculating the number of extragenic enhancers that produce eRNAs (Fig. 5c)
The level of eRNA for each enhancer locus is calculated by counting all RNA-Seq reads found within a 1.5 kb region on both sides of the CBP peak. As a control, we consider the number of reads found in the adjacent regions (-3.5 kb to -2 kb) and (+2 kb to +3.5 kb) relative to the CBP peak, and in random regions. If one requires >7 reads for detection, 2,267 or 44% of the enhancers have eRNAs, compared to 16% of the flanking regions and 2% of the random regions.
Changes in eRNA levels and RNAPII binding at enhancers (Fig. 5d)
For changes in RNAPII binding at enhancers, we counted the number of ChIP-Seq reads within 300 bp of the enhancer center at each time point. For eRNAs, we used the same procedure, including all reads within 1.5 kb of the enhancer. We defined the normalized induction index as (s − u)/(s + u), where s and u are the number of normalized reads from the stimulated and unstimulated conditions, respectively.
Correlations between enhancer features and mRNA expression levels at nearby genes (Fig. 5d)
We paired each enhancer with the nearest TSS, provided that the distance was <1 Mb. The induction index for RefSeq genes was calculated as before for RNAPII, but based on the average read density throughout the coding region for mRNA. Genes were grouped by induction ratio quantiles into 25 bins prior to plotting.
Supplementary Material
supplement 1
supp figs
Supp TAble 1
Supplementary Table S1 shows the number of CBP sites that were removed at each step of filtering in order to produce a list of high-confidence enhancers.
Supp Table 2
Supplementary Table S2 shows ChIP-Seq, RNA-Seq, and other data associated with each CBP peak, with ~41,000 CBP peaks as rows and nearly 200 columns of information about each peak.
Supp Table 3A
Supplementary Tables S3a and S3b show lists of TF peaks found in the 2hour KCl stimulated and unstimulated conditions, with positive values for any given factor indicating the presence of a peak.
Supp Table 3B
Supp Table 4
Supplementary Table S4 shows the number of extragenic enhancers that have TFs, RNAPII, or eRNAs detected, as well as the number of enhancers with any two of these features detected.
Supp Table 5
Supplementary Table S5 shows the number of ChIP-Seq/RNA-Seq reads for each experiment and the antibody used for each ChIP-Seq experiment.
Supp Table 6
Supplementary Table S6 contains text that can be pasted into the UCSC Genome Browser to display the raw ChIP-Seq/RNA-Seq sequencing data using the mm9 mouse genome.
Supp Table 7
Supplementary Table S7 shows DAVID analysis of the genes whose promoters bind CREB.
Supp Table 8
Supplementary Table S8 shows a list of genes with expression changes that were significant following 6 hours KCl stimulation, based on RNA-Seq biological replicate 1.
Supp Table 9A
Supplementary Tables S9a and 9b show DAVID analysis of strongly up-and down-regulated genes.
Supp Table 9B
Supp Table 10
Supplementary Table S10 shows primers used for RT-qPCR validation.
Acknowledgments
We thank members of the Greenberg lab for helpful discussions and for critical reading of the manuscript. We thank Sara Vasquez for preparing dissociated mouse cortical neurons. We thank Linda Hu for generating antibodies. We thank the Molecular Genetics Core Facility at Children's Hospital Boston, including Hal Schneider and Stephanie Burgess, for operation of their SOLiD 3.0 sequencer (I.D.D.R.C). We thank the support and R&D teams at Life Technologies including Swati Ranade, Robert David, Jingwei Ni, Catalin Barbacioru, Melissa Barker, Gina Costa, and Kevin McKernan. M.E.G. acknowledges the generous support of the Nancy Lurie Marks Family Foundation. We thank Marlin Dehoff for technical support in the arc knock-out experiments. This work was supported by the National Institutes of Health grants NS028829 (M.E.G.), R21EY019710 (G.K.) and DP2OD006461 (G.K.). This work was also supported by The Lefler postdoctoral fellowship (T-K.K.) and The Jane Coffin Childs Memorial Funds (T-K.K.), The Helen Hay Whitney postdoctoral fellowship (J.M.G.), The Children's Hospital Ophthalmology Foundation (G.K.), The Whitehall Foundation (G.K.), and The Klingenstein Fund (G.K.)
Footnotes
Author Contributions: T-K.K., J.M.G., and M.E.G. conceived and designed experiments. T-K.K., J.M.G., M.H., G.K. and M.E.G. wrote the manuscript. T-K.K. optimized the protocol for ChIP-Seq library preparation to be suitable for the SOLiD sequencer and made all ChIP-Seq libaries used in this study. S.K. invented the library construction methodology used for all RNA sequencing reported here. J.M.G., A.M.C., and E.M.P. made all RNA-Seq libraries. M.H., J.M.G., and D.A.H. performed bioinformatic analyses. K.B.-H. carried out the SOLiD bead preparation and sequencing. T-K.K., J.W., P.F.W, and A.M.C. performed the arc knock-out experiment. D.M.B. performed the luciferase experiments. M.L. performed the RNA circularization experiment. H.B. provided the pArc7000 plasmid. D.K. provided the arc knock-out mouse. All authors reviewed the manuscript.
Author Information: Sequencing data will be deposited in the NCBI Short Read Archive. The bigWig files for genome browser visualization are posted online (see Supplementary Table 6).
References
- 1.Banerji J, Rusconi S, Schaffner W. Expression of a beta-globin gene is enhanced by remote SV40 DNA sequences. Cell. 1981;27(2 Pt 1):299–308. doi: 10.1016/0092-8674(81)90413-x. [DOI] [PubMed] [Google Scholar]
- 2.Greer PL, Greenberg ME. From synapse to nucleus: calcium-dependent gene transcription in the control of synapse development and function. Neuron. 2008;59(6):846–860. doi: 10.1016/j.neuron.2008.09.002. [DOI] [PubMed] [Google Scholar]
- 3.Heintzman ND, et al. Distinct and predictive chromatin signatures of transcriptional promoters and enhancers in the human genome. Nat Genet. 2007;39(3):311–318. doi: 10.1038/ng1966. [DOI] [PubMed] [Google Scholar]
- 4.Visel A, et al. ChIP-seq accurately predicts tissue-specific activity of enhancers. Nature. 2009;457(7231):854–858. doi: 10.1038/nature07730. [DOI] [PMC free article] [PubMed] [Google Scholar]
- 5.Xi H, et al. Identification and characterization of cell type-specific and ubiquitous chromatin regulatory structures in the human genome. PLoS Genet. 2007;3(8):e136. doi: 10.1371/journal.pgen.0030136. [DOI] [PMC free article] [PubMed] [Google Scholar]
- 6.Park PJ. ChIP-seq: advantages and challenges of a maturing technology. Nat Rev Genet. 2009;10(10):669–680. doi: 10.1038/nrg2641. [DOI] [PMC free article] [PubMed] [Google Scholar]
- 7.Barski A, et al. High-resolution profiling of histone methylations in the human genome. Cell. 2007;129(4):823–837. doi: 10.1016/j.cell.2007.05.009. [DOI] [PubMed] [Google Scholar]
- 8.Robertson AG, et al. Genome-wide relationship between histone H3 lysine 4 mono- and tri-methylation and transcription factor binding. Genome Res. 2008;18(12):1906–1917. doi: 10.1101/gr.078519.108. [DOI] [PMC free article] [PubMed] [Google Scholar]
- 9.Chowdhury S, et al. Arc/Arg3.1 interacts with the endocytic machinery to regulate AMPA receptor trafficking. Neuron. 2006;52(3):445–459. doi: 10.1016/j.neuron.2006.08.033. [DOI] [PMC free article] [PubMed] [Google Scholar]
- 10.Plath N, et al. Arc/Arg3.1 is essential for the consolidation of synaptic plasticity and memories. Neuron. 2006;52(3):437–444. doi: 10.1016/j.neuron.2006.08.024. [DOI] [PubMed] [Google Scholar]
- 11.Shepherd JD, et al. Arc/Arg3.1 mediates homeostatic synaptic scaling of AMPA receptors. Neuron. 2006;52(3):475–484. doi: 10.1016/j.neuron.2006.08.034. [DOI] [PMC free article] [PubMed] [Google Scholar]
- 12.Waltereit R, et al. Arg3.1/Arc mRNA induction by Ca2+ and cAMP requires protein kinase A and mitogen-activated protein kinase/extracellular regulated kinase activation. J Neurosci. 2001;21(15):5484–5493. doi: 10.1523/JNEUROSCI.21-15-05484.2001. [DOI] [PMC free article] [PubMed] [Google Scholar]
- 13.Kawashima T, et al. Synaptic activity-responsive element in the Arc/Arg3.1 promoter essential for synapse-to-nucleus signaling in activated neurons. Proc Natl Acad Sci U S A. 2009;106(1):316–321. doi: 10.1073/pnas.0806518106. [DOI] [PMC free article] [PubMed] [Google Scholar]
- 14.Pintchovski SA, Peebles CL, Kim HJ, Verdin E, Finkbeiner S. The serum response factor and a putative novel transcription factor regulate expression of the immediate-early gene Arc/Arg3.1 in neurons. J Neurosci. 2009;29(5):1525–1537. doi: 10.1523/JNEUROSCI.5575-08.2009. [DOI] [PMC free article] [PubMed] [Google Scholar]
- 15.Flavell SW, Greenberg ME. Signaling mechanisms linking neuronal activity to gene expression and plasticity of the nervous system. Annu Rev Neurosci. 2008;31:563–590. doi: 10.1146/annurev.neuro.31.060407.125631. [DOI] [PMC free article] [PubMed] [Google Scholar]
- 16.Lin Y, et al. Activity-dependent regulation of inhibitory synapse development by Npas4. Nature. 2008;455(7217):1198–1204. doi: 10.1038/nature07319. [DOI] [PMC free article] [PubMed] [Google Scholar]
- 17.Kee BL, Arias J, Montminy MR. Adaptor-mediated recruitment of RNA polymerase II to a signal-dependent activator. J Biol Chem. 1996;271(5):2373–2375. doi: 10.1074/jbc.271.5.2373. [DOI] [PubMed] [Google Scholar]
- 18.Brodsky AS, et al. Genomic mapping of RNA polymerase II reveals sites of co-transcriptional regulation in human cells. Genome Biol. 2005;6(8):R64. doi: 10.1186/gb-2005-6-8-r64. [DOI] [PMC free article] [PubMed] [Google Scholar]
- 19.Kim TH, et al. A high-resolution map of active promoters in the human genome. Nature. 2005;436(7052):876–880. doi: 10.1038/nature03877. [DOI] [PMC free article] [PubMed] [Google Scholar]
- 20.Koch F, Jourquin F, Ferrier P, Andrau JC. Genome-wide RNA polymerase II: not genes only! Trends Biochem Sci. 2008;33(6):265–273. doi: 10.1016/j.tibs.2008.04.006. [DOI] [PubMed] [Google Scholar]
- 21.Szutorisz H, Dillon N, Tora L. The role of enhancers as centres for general transcription factor recruitment. Trends Biochem Sci. 2005;30(11):593–599. doi: 10.1016/j.tibs.2005.08.006. [DOI] [PubMed] [Google Scholar]
- 22.Abeel T, Saeys Y, Rouze P, Van de Peer Y. ProSOM: core promoter prediction based on unsupervised clustering of DNA physical profiles. Bioinformatics. 2008;24(13):i24–31. doi: 10.1093/bioinformatics/btn172. [DOI] [PMC free article] [PubMed] [Google Scholar]
- 23.Ling J, et al. HS2 enhancer function is blocked by a transcriptional terminator inserted between the enhancer and the promoter. J Biol Chem. 2004;279(49):51704–51713. doi: 10.1074/jbc.M404039200. [DOI] [PubMed] [Google Scholar]
- 24.Zhao H, Dean A. An insulator blocks spreading of histone acetylation and interferes with RNA polymerase II transfer between an enhancer and gene. Nucleic Acids Res. 2004;32(16):4903–4919. doi: 10.1093/nar/gkh832. [DOI] [PMC free article] [PubMed] [Google Scholar]
- 25.Heintzman ND, et al. Histone modifications at human enhancers reflect global cell-type-specific gene expression. Nature. 2009;459(7243):108–112. doi: 10.1038/nature07829. [DOI] [PMC free article] [PubMed] [Google Scholar]
- 26.Gerber M, Shilatifard A. Transcriptional elongation by RNA polymerase II and histone methylation. J Biol Chem. 2003;278(29):26303–26306. doi: 10.1074/jbc.R300014200. [DOI] [PubMed] [Google Scholar]
Associated Data
This section collects any data citations, data availability statements, or supplementary materials included in this article.
Supplementary Materials
supplement 1
supp figs
Supp TAble 1
Supplementary Table S1 shows the number of CBP sites that were removed at each step of filtering in order to produce a list of high-confidence enhancers.
Supp Table 2
Supplementary Table S2 shows ChIP-Seq, RNA-Seq, and other data associated with each CBP peak, with ~41,000 CBP peaks as rows and nearly 200 columns of information about each peak.
Supp Table 3A
Supplementary Tables S3a and S3b show lists of TF peaks found in the 2hour KCl stimulated and unstimulated conditions, with positive values for any given factor indicating the presence of a peak.
Supp Table 3B
Supp Table 4
Supplementary Table S4 shows the number of extragenic enhancers that have TFs, RNAPII, or eRNAs detected, as well as the number of enhancers with any two of these features detected.
Supp Table 5
Supplementary Table S5 shows the number of ChIP-Seq/RNA-Seq reads for each experiment and the antibody used for each ChIP-Seq experiment.
Supp Table 6
Supplementary Table S6 contains text that can be pasted into the UCSC Genome Browser to display the raw ChIP-Seq/RNA-Seq sequencing data using the mm9 mouse genome.
Supp Table 7
Supplementary Table S7 shows DAVID analysis of the genes whose promoters bind CREB.
Supp Table 8
Supplementary Table S8 shows a list of genes with expression changes that were significant following 6 hours KCl stimulation, based on RNA-Seq biological replicate 1.
Supp Table 9A
Supplementary Tables S9a and 9b show DAVID analysis of strongly up-and down-regulated genes.
Supp Table 9B
Supp Table 10
Supplementary Table S10 shows primers used for RT-qPCR validation.
