A Protein Microarray Signature of Autoantibody Biomarkers for the Early Detection of Breast Cancer (original) (raw)
. Author manuscript; available in PMC: 2011 Aug 18.
Published in final edited form as: J Proteome Res. 2010 Nov 23;10(1):85–96. doi: 10.1021/pr100686b
Abstract
Cancer patients spontaneously generate autoantibodies (AAb) to tumor-derived proteins.. To detect AAb, we have probed novel high-density custom protein microarrays (NAPPA) expressing 4,988 candidate tumor antigens with sera from patients with early stage breast cancer (IBC), and bound IgG was measured. We used a three-phase serial screening approach. First, a pre-screen was performed to eliminate uninformative antigens. Sera from stage I–III IBC (n=53) and healthy women (n=53) were screened for AAb to all 4,988 protein antigens. Antigens were selected if the 95th percentile of signal of cases and controls were significantly different (p<0.05) and if the number of cases with signals above the 95th percentile of controls was significant (p<0.05). These 761 antigens were screened using an independent set of IBC sera (n=51) and sera from women with benign breast disease (BBD) (n=39). From these, 119 antigens had a partial area under the ROC curve (p<0.05), with sensitivities ranging from 9–40% at >91% specificity. 28 of these antigens were confirmed using an independent serum cohort (n=51 cases/38 controls, p<0.05). Using all 28 AAb, a classifier was identified with a sensitivity of 80.8% and a specificity of 61.6% (AUC=0.756). These are potential biomarkers for the early detection of breast cancer.
Keywords: Breast Cancer, Autoantibodies, Biomarker, Proteomics, Protein Microarrays
INTRODUCTION
Despite recent advances in early detection and treatment, breast cancer remains a common and significant health problem in the United States 1 and worldwide2. Women diagnosed with stage II and III breast cancer have a high-risk of distant recurrence. Up to half of these women will develop metastatic disease, which remains incurable with current therapy 3. Current screening with mammography detects only 70% of breast cancers 4. Cancers associated with high breast density and highly proliferative cancers are frequently not detected by routine screening, with over 80% of the cancers in the multicenter NCI/I-SPY neoadjuvant clinical cohort not detected by screening mammography (5–7 and L. Esserman, personal communication). Breast MRIs, while more sensitive, are not cost-effective for routine screening. High- risk populations, such as women with benign breast disease, have an increased risk of developing cancer (relative risk 1.56 8), with false positive mammograms leading to unnecessary biopsies. In this setting, there is intense effort in the search for biomarkers that can detect early disease and distinguish benign breast disease from invasive cancers, more effectively to guide screening recommendations.
Autoantibodies (AAb) to tumor antigens, induced by changes in protein or glycan expression and structure9, have been detected in the sera of cancer patients. These AAb have advantages over other serum proteins as potential cancer biomarkers as they are stable, highly specific, easily purified from serum, and are readily detected with well-validated secondary reagents. Although they have high specificities to distinguish cancer from control sera, most tumor AAb in breast cancer demonstrate poor sensitivities to detect early stage disease, such as with NY-ESO-1 (4%10), SCP-1 (6% 11), and SSX2 (1% 12). In order to increase the predictive value of tumor-specific antibodies for use as immunodiagnostics, several groups have begun testing multiple antigens in parallel 13–19.
To screen for immune responses, protein microarrays are a promising emerging platform for antigen display 20, 21. In comparison to traditional ELISAs that use single purified recombinant proteins, protein microarrays are capable of presenting and assessing hundreds of tumor antigens simultaneously. The AAb responses are rapidly identified, because the address of each protein is known in advance, with all proteins represented equally. The proteins are arrayed on a single microscope slide requiring only a few microliters of serum per assay. Known tumor antigens as well as predicted tumor antigens can be included to generate a comprehensive protein tumor antigen array. High density recombinant protein and glycan arrays have been applied to profile cancer immune response, leading to the discovery of novel tumor antigens 22–24. Despite early demonstrations of feasibility, protein microarrays are not yet widely used, due to the labor and technical issues associated with production, purification, and quality control of proteins for spotting on the array, as well as difficulties with downstream validation assays of target AAb.
We have developed a novel protein microarray technology, termed Nucleic Acid Protein Programmable Array (NAPPA), which circumvents many of the limitations of traditional protein microarrays 25, 26. NAPPA arrays are generated by printing full-length cDNAs encoding the target proteins at each feature of the array. The proteins are then transcribed and translated by a cell-free system and immobilized in situ using epitope tags fused to the proteins. Sera are added, and bound IgG is detected by standard secondary reagents.
Here, we present the first demonstration of using custom NAPPA protein microarrays to detect novel tumor antigen-specific AAb in the sera of patients with cancer. We used age- and location-matched sera obtained from both screening and diagnostic mammography clinics, to control for women undergoing routine screeing mammography and women with benign breast disease. We used a three- phase sequential screening strategy to select AAb from 4,988 candidate tumor antigens to provide a more rapid, cost-effective strategy for antigen selection that limits the false discovery rate inherent to large-scale proteomic screening. In the first phase, we eliminated uninformative antigens by screening 53 cases and 53 controls (Cohort 1) on all 4,988 candidate tumor antigens, and selected 761 antigens for further testing. The second phase, using 51 cases and 39 controls (Cohort 2), identified 119 potential candidate AAb biomarkers. The final phase, using 51 cases and 38 controls (Cohort 3), validated the specificity of detection of 28 potential AAb biomarkers for the early detection of breast cancer. The sensitivity and specificity of each individual biomarker, as well as the panel of 28 biomarkers, is presented. Using a recombinant protein ELISA in an independent assay with independent sera (Cohort 4), we confirmed specific AAb detection of the top biomarker, ATP6AP1.
MATERIALS AND METHODS
Patient Sera
Sera used in these analyses were obtained from Fox Chase Cancer Center (FCCC), the Duke University Medical Center (DUMC), and the Dana-Farber Cancer Institute (DFCI) with support from the NCI Early Detection Research Network and the NCI Breast SPORE program. Sera were derived from early-stage breast cancer patients from FCCC (53 cases/53 controls, test set, Cohort 1); control sera were sex- -matched. All samples were obtained at the time of routine mammography, prior to the diagnosis of cancer, and were selected retrospectively. To control for benign breast disease, we obtained an independent set of sera of early-stage invasive breast cancer patients and age-matched (+/− 3 yrs) benign breast disease controls from DUMC (102 cases/102 controls), randomly divided into training (Cohort 2) and validation (Cohort 3) sets. An independent set of sera (Cohort 4, n=148) from DFCI, obtained prior to treatment from patients with stage I–III breast cancer with healthy controls (n=64), was used for ATP6AP1 antigen validation. These samples were collected using a standardized sample collection protocol and stored at −80°C until use. Cases and matched controls were processed simultaneously. Written consent was obtained from all subjects under institutional review board approval.
Plasmid repository and high-throughput DNA preparation
Sequence-verified, full-length cDNA expression plasmids in flexible donor vector systems were obtained from the Harvard Institute of Proteomics and are publicly available (http://dnasu.asu.edu/DNASU/). These were converted to the T7-based mammalian expression vector pANT7_GST using LR recombinase (Invitrogen, Carlsbad, CA). The high-throughput preparation of high-quality supercoiled DNA for cell-free protein expression was performed as described 27. Briefly, expression plasmids were transformed into E. coli DH5α and grown in 1.5 mL terrific broth and ampicillin (100 μg/mL). DNA was purified with the NucleoPrepII anion exchange resin (Macherey-Nagel Inc., Bethlehem, PA) using a Biomek FX (Beckman Coulter, Inc., Fullerton, CA) automated laboratory workstation. Automated addition of all solutions was accomplished using a Matrix WellMate (Thermo Scientific, Hudson, NH) rapid bulk liquid-dispensing instrument. Purified DNA was precipitated by addition of 0.6 volumes isopropanol, followed by centrifugation at 5000 rcf for 30 minutes. The DNA pellet was washed with 200 μL of 80% ethanol, centrifuged at 5000 rcf for 15 minutes, dried, and resuspended in dH2O. For bead array ELISAs, larger quantities of DNA were prepared using standard Nucleobond preparation methods (Macherey-Nagel Inc., Bethlehem, PA).
Detecting serum antibodies on NAPPA arrays
Plasmid DNA (1.5 μg/μL) was supplemented with capture antibody (50 μg/mL, anti-GST antibody, GE Healthcare Biosciences, Piscataway, NJ) or anti-FLAG antibody (Sigma-Aldrich, St. Louis, MO), protein crosslinker (2 mM, BS3, Pierce, Rockford, IL) and BSA (3 mg/mL, Sigma-Aldrich) to the DNA prior to printing onto the array surface. All samples were printed using a Genetix QArray2 with 300 μm solid tungsten pins on amine-treated glass slides. Arrays were stored in an air-tight container at room temperature, protected from light. The printed DNA was transcribed and translated in situ using previously published protocols 25, 28. Protein expression was detected using anti-GST MAb (Cell Signaling, Danvers, MA) diluted at 1:200. For detecting serum antibodies, the arrays were incubated with serum diluted 1:300–1:600 in 5% PBS milk with 0.2% Tween 20. All incubations were carried out at 4°C overnight with mixing (Corning hybridization chambers) unless indicated otherwise. Detection on the array was carried out using an anti-human IgG (Jackson ImmunoResearch Labs, West Grove, PA) conjugated with HRP. The slides were developed for fluorescent detection using the Tyramide Signal Amplification reagent (PerkinElmer, Waltham, MA) per manufacturer’s instructions. Slides were scanned with a Perkin Elmer ProScanArray HT and the images were quantitated using MicroVigene software (Vigene Tech version 2.9.9.2). The highly immunogenic EBV-derived antigen, EBNA-1, was included as N- and C-terminal fragments for positive control antigens. Negative controls included empty vectors and no DNA controls. Registration spots for array alignment were printed purified human IgG proteins.
Generation of recombinant ATP6AP1-GST and GST protein
Purification of recombinant fusion proteins ATP6AP1-GST and GST were prepared as described29. The pGEX-4T-1 plasmid (GE Healthcare Biosciences, Piscataway, NJ) encoding full-length glutathione S-transferase (GST) protein and GST fused to the full-length ATP6AP1 gene (ATP6AP1-GST, from Dr. F.S. Hodi30) were expressed in BL21 DE3 cells (Stratagene, La Jolla, CA) with 0.1M IPTG induction for 4 hours. Proteins were purified with glutathione CL-4B Sepharose columns (Pharmacia, Piscataway, NJ) and eluted in 50 mM Tris pH8.0 with 10 mM reduced glutathione. Protein purity was confirmed with SDS-PAGE and concentration determined at OD 280nM. Recombinant EBNA-1 protein was obtained from Advanced Biotechnologies, Inc. (Columbia, MD).
Immunoblotting for ATP6AP1
The breast cancer tumor cell lines ZR751, MCF-7, BT-483, BT-474, SKBR3, T47-D, MCF-10A, HS578T, BT-549, MDA-231, MDA-436, and BT-20 were kindly provided by Dr. H. Irie. Cells were washed in PBS, lysed, 35 micrograms were loaded/lane, and separated by SDS-PAGE. Proteins were transferred to PVDF membrane (Millipore), and the presence of ATP6AP1 protein was assessed using anti-ATP6AP1 mAb 85.1 (Santa Cruz Biotechnology, Inc, Santa Cruz, CA). The presence of actin was assessed using anti-actin mAb (Sigma-Aldrich, St. Louis, MO).
ATP6AP1 Antibody ELISA
An ELISA for the detection of ATP6AP1-specific IgG AAb in patient sera was developed as previously reported29. Recombinant GST or ATP6AP1-GST protein was applied at 5 μg/ml to Nunc C96 Maxisorp plates (Fisher, Pittsburgh, PA) in carbonate buffer (pH9.6) overnight at 4°C. Plates were washed in PBS-0.05% Tween (PBST) and blocked with PBST with 2% milk, overnight at 4°C. Serum was added in duplicate at 1:500 dilution in blocking buffer, overnight at 4°C. After washing, 1:1000 goat anti-human IgG-HRP secondary antibody was added (Invitrogen, Carlsbad, CA) for one hour at room temperature. After washing, TMB-Plus (Dako, Carpinteria, CA) was added and the reaction stopped with 1N H2SO4. Absorbance was read at 450 nM, and GST signal was subtracted from ATP6AP1-GST signal.
Statistical Analysis
For the pre-screen, 53 cases and 53 control sera from FCCC (test set, Cohort 1) were screened on 4,988 antigens displayed in NAPPA protein array format. Each array was normalized by first removing the background signal estimated by the first quartile of the non-spots and then log-transforming the median-scaled raw intensities to bring the data to the same scale and stabilize the variance across the range of signals. Candidate antigens from the initial 4,988 antigens were selected if they met two different criteria: 1) comparison of the 95th percentiles of the cases and controls using quantile regression 31 and 2) comparison of the proportion of cases with intensities above the 95th percentile of controls to the expected number seen by chance using binomial tests, with a p-value≤0.05 (n=217). Additional antigens (n=544) were ranked based on intensity and decreasing specificity (cases/controls). Independent arrays of these 761 candidate antigens were screened with a fully independent set of age-matched sera consisting of 76 controls with benign breast disease and 102 patient sera from DUMC, randomly divided into training and validation sets. We normalized these arrays as follows. First, we used sequential median normalization to adjust for plate, pin, and print order effects. Second, we removed any duplicate antigen pairs that differed by more than 3 times the median absolute deviation, resulting in removal of 0.5% of spots. Third, we re-normalized the raw intensities as above and averaged duplicate antigen pairs. Finally, we removed background signal by subtracting the first quartile of control spot (no DNA) intensity and divided the excess intensity by the median excess intensity to normalize across arrays.
We computed the sensitivity at an approximate 95% specificity for each antigen as follows. We determined a threshold by computing the 95% empirical percentile of the normalized intensity values of the controls. We then computed the sensitivity as the proportion of the cases that exceeded that threshold, and the actual specificity as the proportion of the controls that did not exceed the threshold.
We used the partial area under the receiver operating characteristic curve (pAUC) as the basis for comparing the normalized intensities of cases and controls for each antigen 32. Specifically, we used the pAUC where the false positive rate is at most 5%. For each antigen we tested the hypothesis that the pAUC was greater than 0.00125, which is the same partial area under the 45 degree line receiver operating characteristic curve that represents no difference between cases and controls. P-values for each test were computed using a normal approximation to the bootstrap sampling distribution and q-values were computed using the qvalue package in R33, 34. We used the training set to identify 119 potential antigen biomarkers with p-values less than 0.05 and confirmed 28 of these using the validation set (p < 0.05).
RESULTS
Strategy for Biomarker Selection
Our primary goal was to identify serum AAb biomarkers that would distinguish benign breast disease from invasive cancers, to help guide further imaging and biopsy decisions. The overall strategy for using protein microarrays for the detection of specific AAb biomarkers in the sera of breast cancer patients is shown in Figure 1. Protein microarrays are screened with sera, and patterns that distinguish cases from controls are identified. Here, we focused on identifying AAb present only in cases (red). In order to identify a biomarker panel of AAb in breast cancer from the 4,988 candidate antigens, sera were tested in sequential phases as described in Figure 2.
Figure 1. Schematic of the detection of autoantibodies with NAPPA protein microarrays.

- Replicate NAPPA protein microarrays expressing 4,988 candidate tumor antigens are probed with sera from patients with cancer and healthy controls (2). Detection of IgG autoantibodies in patient sera is compared with control sera (3) and patterns of immune responses are identified (4). Antigens that correspond to antibodies detected only in sera from cancer cases are then selected for further confirmation.
Figure 2. Schematic of Serum Screening Strategy.

Breast cancer sera were sequentially tested on custom microarrays as shown. Initial screening was performed using arrays expressing 4,988 unique full length cDNAs and case/control sera derived from a screening mammography clinic (Cohort 1). Secondary screening was performed using arrays expressing 761 unique full length cDNAs and case/control sera derived from a diagnostic mammography clinic, to control for benign breast disease (Cohort 2). From these, 119 potential biomarkers were selected. An independent blinded validation set of case/control sera (Cohort 3) were used to validate the top 28 biomarkers.
All training and validation case and control sera were sex- and age-matched, collected prior to therapy, in the same clinical settings, under standardized collection protocols. We used sera from two locations (Philadelphia, PA and Durham, NC) to control for site-specific variations in patient populations and collection techniques. Sera from women undergoing routine screening mammography at FCCC were seletected for a test set for the pre-screen (53/53). The test set cases from FCCC (n=53, Cohort 1) for the pre-screen were 38% stage I, 32% stage II, and 28% stage III (Table 1). The primary breast tumors from these patients were 75% ER+, 51% PR+, and 43% HER2+. For subsequent biomarker selection and validation, sera from women undergoing diagnostic biopsy from DUMC were randomly divided into a training set (n=51 cases, 39 controls, Cohort 2) and a blinded validation set (n=51 cases, 38 controls, Cohort 3) (Figure 2). Eighteen additional control sera (10 from the training set, 8 from the validation set) were later determined to carry the diagnosis of invasive breast cancer prior to sample collection, and these were eliminated from analysis. Cases from the training set were 53% stage I, 25% stage II, and 8% stage III, and were 69% ER+, 63% PR+, and 18% HER2+ (Table 1). The majority of these cases were from stage I/II, hormone-receptor positive tumors. This reflects the incidence of breast cancer in this screening population. The clinical characteristics of the sera from the validation set matches the training set.
Table 1.
Characteristics of cases and controls
| Cases: Test set: (N=53) + N (%) | Controls: Test set: (N=39) N (%) | Cases: Training (N=51) + N (%) | Controls: Training (N=39) N (%) | Cases: Validation (N=51) + N (%) | Controls: Validation (N=38) N (%) | p-value | |
|---|---|---|---|---|---|---|---|
| Age | 55.4 (25.0–80.0) | 41.5 (24.0–50.0) | 56.7 (35.9–77.1) | 58.4 (36.0–75.8) | 55.4 (31.8–81.2) | 54.2 (30.9– 83.5) | P=0.880* |
| Race | |||||||
| White | 47 (89) | 48 (91) | 41 (80) | 30 (77) | 40 (78) | 29 (76) | P=0.615† |
| Non-white | 6 (11) | 5 (9) | 5 (9.8) | 9 (23) | 9 (18) | 9 (24) | |
| Stage | |||||||
| I | 20 (38) | 27 (53) | 19 (37) | P=0.051∞ | |||
| II | 17 (32) | 13 (25) | 23 (45) | ||||
| III | 15 (28) | 4 (7.8) | 1 (2.0) | ||||
| Tumor size | |||||||
| ≤2 cm | 33 (62) | 33 (65) | 35 (69) | P=0.649∞ | |||
| >2 cm | 20 (38) | 11 (22) | 15 (29) | ||||
| Lymph node | |||||||
| N0 | 23 (43) | 33 (65) | 25 (49) | P=0.168∞ | |||
| N≥1 | 29 (55) | 11 (22) | 17 (33) | ||||
| IHC | |||||||
| ER Positive | 40 (75) | 35 (69) | 34 (67) | P=0.740∞ | |||
| PR Positive | 27 (51) | 32 (63) | 28 (55) | P=0.504∞ | |||
| Her2/neu Positive | 23 (43) | 9 (18) | 4 (7.8) | P=0.220∞ |
Generation of NAPPA Custom Protein Microarrays for Biomarker Detection
High-density NAPPA protein microarrays were generated for these studies for biomarker detection as described 25, 26. The 4,988 individual cDNAs used on these arrays were derived from the Harvard Institute of Proteomics. These cDNAs were all sequence-verified, full length, wild-type genes that are fused in frame with either a C-terminal GST tag or N-terminal FLAG tag in a pCITE-derived vector optimized for mammalian protein expression. The content of these arrays include the Breast Cancer 1000 gene set 35, selected for their association with breast cancer using bioinformatics and data mining tools,. Additional genes included over 300 G-coupled protein receptors (GPCRs), 500 kinases, and 700 transcription factors. The cDNA were coprinted on glass slides with anti-tag antibodies at a high density (up to 2300 antigens/slide; 3 slides/gene set). Proteins were expressed and captured in situ on the arrays using a coupled in vitro transcription-translation system derived from rabbit reticulocyte lysate. Protein expression was confirmed by probing the arrays with anti-tag antibodies (Figure 3). The protein yield of NAPPA arrays has been shown to average 9 fmol per feature, with 92% of displayed protein yields within twofold of the mean26. Intra-slide and inter-slide coefficients of variation have been measured at 6–7%26.
Figure 3. Detection of autoantibodies with NAPPA protein microarrays.
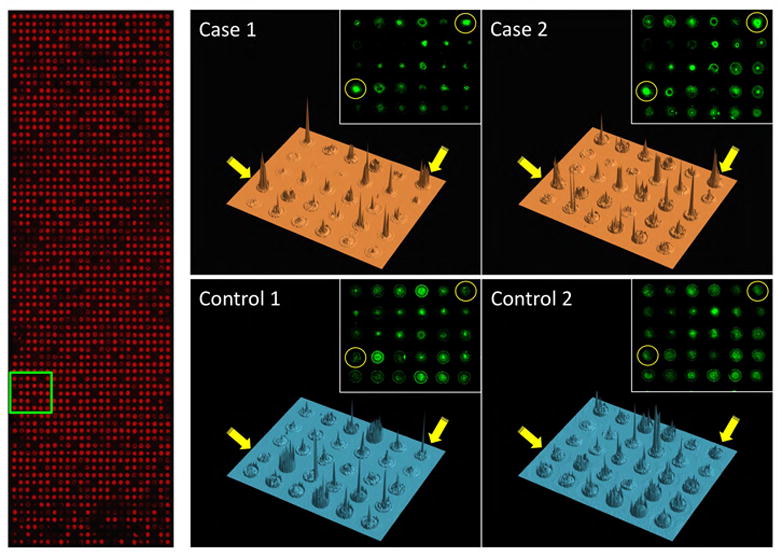
Left, anti-GST stain (red), which binds to a c-terminal tag present on all proteins, confirms total protein display; Right, 3-dimensional renderings of the signal intensities for representative images of one block (in green box on left) probed with four different serum samples (2 cases and 2 controls) and detected with anti-human IgG. Spots (gene SF3A1 arrayed in duplicate) indicated by yellow circles and arrows display differential reactivity between cases and controls. Insets show original scanned images.
The EBNA-1 antigen from EBV was selected as a positive control, since it is widely immunogenic, with EBNA-1 specific IgG antibodies detected in over 90% of all sera 29. This provides an internal control on each array for antigen expression, capture, display and antibody detection for most serum samples. EBNA-1 specific antibodies were equally detected in cases and controls in both the training sets (p=0.317) and validation sets (p=0.284).
Selection of Antigen Biomarker Panel
The goal for Phase I was to reduce the number of total antigens to screen by eliminating all of the uninformative antigens (e.g., no difference between case and control). This had the advantage of reducing the false positive rate and the cost of the screen. Thus, 53 cases/53 control sera were screened with sera at 1:250 to 1:600 dilution for IgG AAb on 4,988 single antigens, and the arrays were normalized for background intensity (see Statistical Analysis). The top 761 antigens (Supplemental Table 1) were selected based on differential detection between cases and controls (see Statistical Analysis). Antigens (n=217) were selected for further analysis if the 95th percentile of signal of cases and controls were significantly different (p<0.05) and if the number of cases with signals above the 95th percentile of controls was larger than the number expected due to random chance (p<0.05). The remaining antigens (n=544) were ranked by intensity in cases and decreasing specificity (cases/controls).
An example of array images is shown in Figure 3. Protein expression of individual spots on the microarrays is demonstrated with anti-GST on the left, since the spotted cDNAs encode c-terminal GST fusion proteins. Dark areas (non-red) within the array represent control spots with no DNA or spotted IgG registration spots for array alignment. Examples of four representative sera (two cases, two controls) are shown on the right. The sera were added to the arrays, and bound IgG detected with secondary antibodies (green). Serum antibody binding to duplicate SF3A1 antigen in case but not control sera is shown in yellow circles. At this array density, the individual spots are well separated, and local antigen diffusion (seen as a halo) is limited. A three-dimensional representation of the signal intensity is shown, with the SF3A1 antigen duplicate spots shown with yellow arrows. Variation in background intensity between the sera across multiple other antigen spots is visible.
The goal of the second phase was to identify candidate AAb. The selected 761 cDNAs were then printed in duplicate on single arrays. To select for antigens that discriminate cancer from benign breast disease, these arrays were screened with a separate training set of sera. These sera were from invasive breast cancer patients (n=51) and sera from benign breast disease patients (n=39). From these data, 119 antigens were selected as potential biomarkers for further analysis. These were antigens with p < 0.05 (FDR < 13%).
Validation of the potential biomarkers
We then tested the 119 antigen panel using blinded independent validation assays. The sera were fully independent and of similar composition as the training set sera (51 cases/38 controls) and the arrays were identical. We tested each antigen using the pAUC and found that the blinded validation assays provided supporting evidence (p < 0.05) for 28 of the 119 potential biomarkers. This represents a statistically significantly higher number of confirmatory findings than would be expected by chance alone (p = 0.0041). For these 28 antigens (Table 2), we used the threshold that yielded approximately 95% specificity on the training set. Most antigens maintained high levels of specificities (55–100%). The sensitivities of each biomarker ranged from 11–42%.
Table 2.
Training and Validation Statistics for 28 Potential Breast Cancer Biomarkers
| Antigen | Training Set | Validation Set | ||||||||
|---|---|---|---|---|---|---|---|---|---|---|
| pAUC | P-value | Q-value | Sens(%) | Spec(%) | pAUC | P-value | Q-value | Sens(%) | Spec(%) | |
| ATP6AP1 | 6.97 | 0.0034 | 0.0462 | 24.00 | 93.55 | 10.72 | 0.0002 | 0.0075 | 30.43 | 91.67 |
| PDCD6IP | 6.64 | 0.0075 | 0.0626 | 19.61 | 94.87 | 8.63 | 0.0004 | 0.0130 | 29.41 | 92.11 |
| DBT | 6.25 | 0.0099 | 0.0720 | 21.57 | 94.87 | 11.31 | 0.0000 | 0.0024 | 29.41 | 97.37 |
| CSNK1E | 8.99 | 0.0016 | 0.0342 | 31.37 | 94.87 | 6.23 | 0.0099 | 0.0706 | 37.25 | 84.21 |
| FRS3 | 12.72 | 0.0001 | 0.0067 | 39.22 | 94.44 | 5.18 | 0.0118 | 0.0718 | 42.00 | 55.26 |
| RAC3 | 8.08 | 0.0035 | 0.0462 | 25.49 | 94.59 | 6.98 | 0.0095 | 0.0706 | 33.33 | 84.21 |
| HOXD1 | 7.82 | 0.0008 | 0.0229 | 21.57 | 94.87 | 4.80 | 0.0180 | 0.0865 | 34.00 | 65.79 |
| SF3A1 | 11.76 | 0.0000 | 0.0047 | 33.33 | 93.75 | 8.16 | 0.0211 | 0.0943 | 36.73 | 83.33 |
| CTBP1 | 6.21 | 0.0114 | 0.0771 | 19.61 | 94.59 | 6.60 | 0.0103 | 0.0706 | 23.53 | 89.47 |
| C15orf48 | 4.71 | 0.0206 | 0.1050 | 11.76 | 94.29 | 7.16 | 0.0032 | 0.0412 | 18.00 | 97.37 |
| MYOZ2 | 5.85 | 0.0206 | 0.1050 | 25.49 | 94.87 | 7.06 | 0.0060 | 0.0581 | 23.53 | 92.11 |
| EIF3E | 5.09 | 0.0277 | 0.1057 | 21.57 | 94.87 | 12.55 | 0.0000 | 0.0012 | 33.33 | 89.47 |
| BAT4 | 9.80 | 0.0004 | 0.0197 | 29.41 | 93.75 | 5.13 | 0.0276 | 0.1000 | 30.61 | 80.00 |
| ATF3 | 6.65 | 0.0052 | 0.0562 | 17.65 | 94.74 | 4.80 | 0.0236 | 0.0962 | 20.00 | 86.84 |
| BMX | 4.66 | 0.0299 | 0.1064 | 13.73 | 94.74 | 10.53 | 0.0001 | 0.0075 | 29.41 | 84.21 |
| RAB5A | 7.38 | 0.0078 | 0.0628 | 24.00 | 94.44 | 6.02 | 0.0238 | 0.0962 | 28.57 | 81.58 |
| UBAP1 | 5.49 | 0.0308 | 0.1068 | 13.73 | 94.29 | 8.29 | 0.0027 | 0.0389 | 26.00 | 92.11 |
| SOX2 | 5.67 | 0.0138 | 0.0856 | 15.56 | 93.75 | 6.91 | 0.0273 | 0.1000 | 18.60 | 94.29 |
| GPR157 | 4.30 | 0.0297 | 0.1064 | 12.00 | 93.75 | 6.42 | 0.0120 | 0.0718 | 13.04 | 100.00 |
| BDNF | 6.62 | 0.0035 | 0.0462 | 17.65 | 94.44 | 4.00 | 0.0390 | 0.1147 | 20.00 | 86.84 |
| ZMYM6 | 5.07 | 0.0278 | 0.1057 | 17.65 | 94.87 | 5.08 | 0.0147 | 0.0800 | 19.61 | 89.47 |
| SLC33A1 | 6.79 | 0.0034 | 0.0462 | 18.00 | 94.87 | 4.00 | 0.0427 | 0.1195 | 26.00 | 86.84 |
| TRIM32 | 6.94 | 0.0262 | 0.1057 | 26.00 | 94.59 | 4.29 | 0.0278 | 0.1000 | 33.33 | 78.95 |
| ALG10 | 5.49 | 0.0099 | 0.0720 | 15.69 | 94.29 | 4.99 | 0.0456 | 0.1195 | 15.69 | 97.37 |
| TFCP2 | 5.68 | 0.0345 | 0.1100 | 23.53 | 93.10 | 4.71 | 0.0329 | 0.1065 | 21.74 | 85.29 |
| SERPINH1 | 5.72 | 0.0385 | 0.1116 | 27.45 | 94.59 | 4.29 | 0.0289 | 0.1003 | 11.76 | 89.47 |
| SELL | 5.73 | 0.0460 | 0.1175 | 25.00 | 93.75 | 5.78 | 0.0228 | 0.0962 | 24.00 | 80.56 |
| ZNF510 | 4.82 | 0.0408 | 0.1132 | 21.28 | 91.67 | 4.26 | 0.0473 | 0.1217 | 20.00 | 88.89 |
Multiplexed Analysis of the Biomarker Panel
One major concern about using AAb as detection biomarkers is the overall sensitivities of these markers, and whether only a few patients generate AAb to multiple antigens. To explore the utility of these AAb biomarkers as a diagnostic panel, we used the combined training and validation sera sets to determine the breadth of the detection of the AAb across the sera. 45 out of 102 cases (44.1% sensitivity) scored high (>99% specificity threshold for each antigen) on two or more of the 28 antigens, compared to only 3 out of the 77 controls (96.1% specificity). The selection criteria of two or more antigens above the 99% specificity level were selected to optimize sensitivity while maintaining at least 95% specificity. The most common pairings are DBT and SF3A1 (14/102 cases, 0/77 controls) and DBT and PDCD6IP (14/102 cases, 1/77 controls). There were 9 cases and no controls that scored high on all three of DBT, SF3A1 and PDCD6IP.
We also used the combined training and validation sets to construct a classifier of patient status using Breiman’s random forests algorithm with 2000 trees and 3 random features36. We measured the average leave-one-out cross validation performance of the classifier across five random seeds. The average sensitivity of the classifier was 80.8% and the average specificity was 61.6%, with an AUC of 0.756 (range, 0.724–0.789 at the 95% confidence interval). The receiver operating characteristic curve for the classifier using the leave-one-out predictions is shown in Figure 4. We assessed the importance of individual antigens to the classification by inspecting the mean decrease in classification accuracy when the values for the antigen are randomly permuted. The most statistically significant antigens in terms of their contribution to classification performance are SF3A1, EIF3E, and MYOZ2.
Figure 4. Receiver operating characteristic curve.
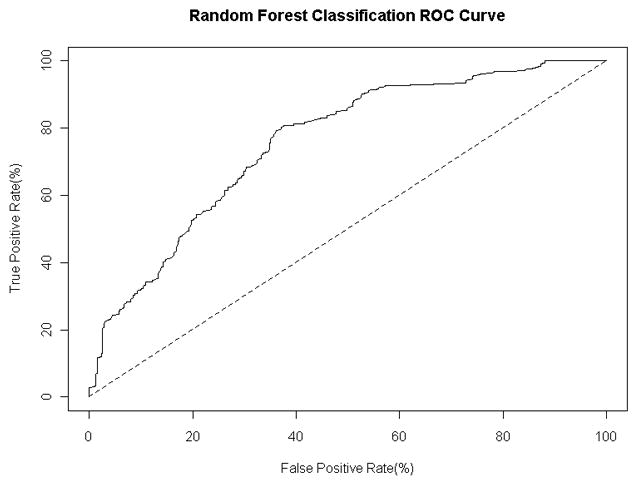
for the random forest classifier with 2000 trees and 3 random features. The curve is calculated using the predicted class probabilities from a leave-one-out cross classification study with five random seeds.
Confirmation of the ATP6AP1 Biomarker
In combined analysis of both the training and validation sets, ATP6AP1 was the most significant individual autoantigen detected (Table 2, p=0.003 and p=0.0002, respectively). ATP6AP1 is a known autoantigen, initially identified by serologic expression (SEREX) screening of a melanoma cDNAlibrary expressed by phage and immunoblotted with post-vaccination sera from a melanoma patient who had evidence of a clinical response to autologous tumor vaccination 30. In RNA microarray expression analysis of the Zhao dataset 37, ATP6AP1 is strongly overexpressed in both invasive ductal and lobular carcinoma (p=4.47 × 10⁻¹⁵). ATP6AP1 is overexpressed in multiple subtypes of breast cancer, as confirmed by immunoblotting breast cancer cell lysates (Figure 5A). Both ER+ breast cancers (MCF-7 and ZR751 cell lines) as well as basal-like triple-negative breast cancers (BT549 and MDA-436) have detectable protein expression of ATP6AP1. The HER2+ cell lines SKBR3 and BT474 showed little, if any, expression of ATP6AP1. To confirm the data from the protein microarrays, an ELISA was established using recombinant GST protein and ATP6AP1-GST protein expressed in bacteria. Pre-treatment sera were obtained from an independent set of sera from DFCI (n=148 cases, stage I (n=29), stage II (n=70), and stage III (n=49). Using a cut-off value of 2 S.D. over the mean of the controls, 19/148 (12.8%) had evidence of ATP6AP1 AAb, with a specificity of 95% (Figure 5B, p=0.059). In contrast, the negative control PCNA antigen showed no specific AAb binding, and the EBNA-1 positive control antigen showed equal IgG binding in case and control sera.
Figure 5. Independent evaluation of ATP6AP1 biomarker.
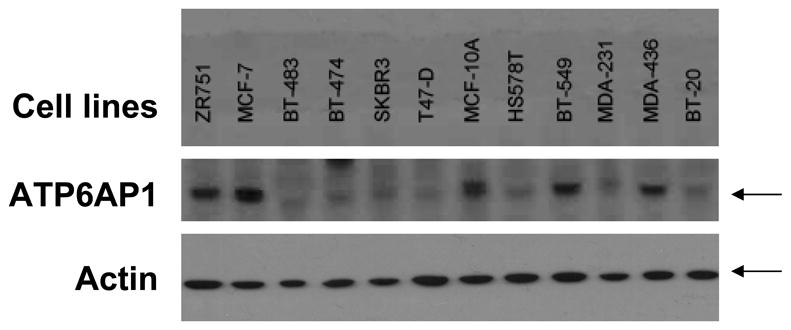
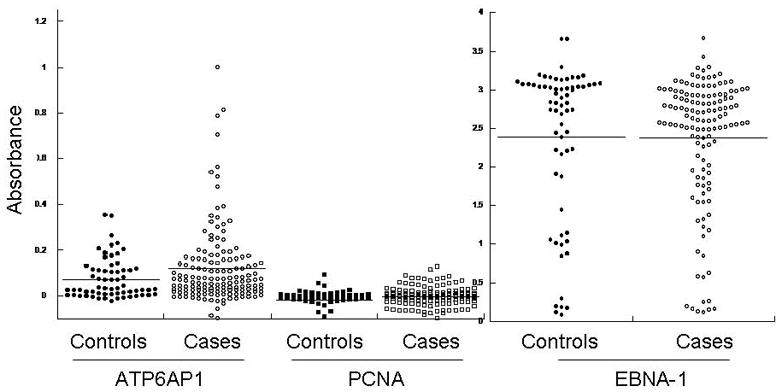
A. ATP6AP1 protein is overexpressed in a number of breast cancer cell lines. Immunoblotting of cell lysates separated by SDS-PAGE for ATP6AP1 protein was performed. ATP6AP1 (arrow) was strongly detected in the cell lines shown. Actin protein is shown in the lower panel. B. ATP6AP1 AAb detection in sera by ELISA. Sera derived from healthy normal controls (n=64) and Stage I-III breast cancer (n=148) were tested for ATP6AP1 IgG AAb using recombinant ATP6AP1-GST and GST proteins (p=0.059). Comparison of IgG responses in these sera to the negative control antigen PCNA and the positive control antigen EBNA-1 are shown.
DISCUSSION
Using custom protein microarrays, we have identified a panel of 28 AAb biomarkers that were detected in the sera of breast cancer patients prior to clinical diagnosis of invasive cancer, but not in healthy women or in women with benign breast disease. In comparison to sera from women with benign breast disease, these individual biomarkers had sensitivities ranging from 11–40% with sensitivities > 91% in the training set. All but three of these biomarkers maintained specificities >80% in an independent validation assay. A random forest classifier constructed using these biomarkers had 80.8% sensitivity and 61.6% specificity in a leave-one-out cross validation study (AUC=0.756). This classifier was built using all 28 biomarkers, which each individually showed promise as a breast cancer biomarker. Improvements in classification performance could likely be obtained by including additional antigens that individually are not strong candidate biomarkers, or by using feature selection within the panel of 28 biomarkers to reduce the number of biomarkers used for classification. However, our goal here was not to obtain the best possible classifier, but instead to assess the overall performance of the entire panel of 28 biomarkers.
This study is the first demonstration of the use of programmable protein microarrays for the proteomic detection of novel AAb biomarkers, and the first serum biomarker panel developed for the discrimination of benign breast disease from invasive breast cancers. Over 82% of the sera used for this study were from patients with stage I/II breast cancer, arguing that AAb detection can be used for early-stage cancers. However, these sera are from patients with heterogeneous breast cancers, since 70% of the sera used were from hormone-receptor positive cancers. It is likely that a specific screening strategy focused on detection of the minority breast cancer subtypes of ER-/PR-/Her2- (triple negative breast cancer) or Her2-positive breast cancers will be required for optimal biomarker detection of these cancers.
It is reassuring that many of the top 28 antigen biomarkers we identified have also been described as important in breast cancer tumor biology and pathogenesis (Table 3). The majority are intracellular, with 11 of 28 antigens present as nuclear antigens. RAC3 is a RAS family GTPase that is present in highly proliferative human breast cancer-derived cell lines and tumor tissues 38. RAC3 is implicated in the regulation of cell migration and invasion in metastatic breast cancer cells 39. CTBP1 is a phosphoprotein and functions as an attenuator of progesterone-regulated transcription 40. The activating transcription factor-3 (ATF3) is a member of the mammalian activation transcription factor/cAMP responsive element-binding (CREB) protein family. ATF3 is strongly stimulated by TGF-β1 in the human breast cancer cell line MDA-MB231 and is overexpressed in human primary breast cancer tissue 41. EIF3E42 and SOX243 promote cellular proliferation, and BDNF44 is upregulated in ER-positive breast cancers.
Table 3.
Cellular functions of candidate biomarkers
| Gene | Sequence iD | Description | Subcellular location | General function | Cancer-related functions |
|---|---|---|---|---|---|
| ATP6AP1 | BC000724 | ATPase, H+ transporting, lysosomal accessory protein 1 | integral membrane | proton transport, cell death, aging | functions in the proper initiation of macroautophagy in amino acid-starved cells68 |
| PDCD6IP | BC020066 | programmed cell death 6 interacting protein | cytoplasm | interacts with caspase-8 and TNF-R1 and involved in apotosis of motor neuron69 | |
| DBT | BC016675 | dihydrolipoamide branched chain transacylase E2 | mitochondria | fatty-acyl-CoA biosynthetic process | |
| CSNK1E | BC006490 | casein kinase 1, epsilon | cytoplasm | circadian rhythm regulation, ubiquitin-dependent protein catabolic process | |
| FRS3 | BC010611 | fibroblast growth factor receptor substrate 3 | plasma membrane-associated | blocks ErbB2 function; a putative tumor suppressor in non-small cell lung cancer70 | |
| RAC3 | BC009605 | ras-related C3 botulinum toxin substrate 3 | membrane_associated | GTPase, actin cytoskeleton organization | regulation of cell migration and invasion in metastatic breast cancer cells39 |
| HOXD1 | BC014477 | homeobox D1 | nucleus | transcription factor, organismal development | |
| SF3A1 | BC007684 | splicing factor 3a, subunit 1, 120kDa | nucleus | RNA splicing | |
| CTBP1 | BC011655 | C-terminal binding protein 1 | nucleus | transcriptional repressor | attenuator of progesterone-regulated transcription40 |
| C15orf48 | BC021173 | normal mucosa of esophagus specific 1 | nucleus | downregulated in human esophageal squamous cell carcinoma71 | |
| MYOZ2 | BC005195 | myozenin 2 | cytoplasm, sarcomere | actin cytoskelton regulation | |
| EIF3E | BC000734 | eukaryotic translation initiation factor 3, subunit E | nucleus, cytoplasm | negative regulation of translational initiation | highly expressed high-grade breast tumors; promotes invasion and proliferation42 |
| BAT4 | BC008783 | HLA-B associated transcript 4 | intracellular | ||
| ATF3 | BC006322 | activating transcription factor 3 | nucleus | gluconeogenesis, regulation of cell proliferation | stimulated by TGF-β1 in the human breast cancer cell line MDA-MB231; overexpressed in human primary breast cancer tissue 41 |
| BMX | BC016652 | BMX non-receptor tyrosine kinase | membrane-associated | mesodermal development | functions in EGF-induced apoptosis in MDA-MB-468 breast cancer cells72 |
| RAB5A | BC001267 | RAB5A, member RAS oncogene family | membrane-associated | endocytosis | mediates caspase-8-promoted cell motility and metastasis73 |
| UBAP1 | BC020950 | ubiquitin associated protein 1 | cytoplasm | down-regulated in multiple neoplastic tissues74 | |
| SOX2 | BC013923 | SRY (sex determining region Y)-box 2 | nucleus | organ development | promotes cell proliferation and tumorigenesis in breast cancer cells43 |
| GPR157 | BC018691 | G protein-coupled receptor 157 | integral membrane | G-protein coupled receptor activity | |
| BDNF | BC029795 | brain-derived neurotrophic factor | extracellular | axon guidance, neuronal development | upregulated in ER-positive breast tumors44 |
| ZMYM6 | BC007070 | zinc finger, MYM-type 6 | nucleus | organismal development | |
| SLC33A1 | BC014416 | solute carrier family 33 (acetyl-CoA transporter), member 1 | integral membrane | cell death, transport | |
| TRIM32 | BC003154 | tripartite motif-containing 32 | cytoplasm, nucleus | ubiquitin-dependent protein catabolic process | highly expressed in human head and neck squamous cell carcinoma; facilitates cell growth and migration via degradation of Abl-interactor275 |
| ALG10 | BC033730 | asparagine-linked glycosylation 10, alpha-1,2-glucosyltransferase homolog (S. pombe) | membrane-associated, endoplasmic reticulum | ||
| TFCP2 | BC003634 | transcription factor CP2 | nucleus | globin gene expression | |
| SERPINH1 | BC014623 | serpin peptidase inhibitor, clade H (heat shock protein 47), member 1, (collagen binding protein 1) | endoplasmic reticulum | serine proteinase inhibitors, maturation of collagen molecules, heat shock protein | higher expression in invasive ductal carcinoma (IDC) and prostatic adenocarcinoma (PCa) 76 |
| SELL | BC020758 | selectin L | integral membrane | cell adhesion | |
| ZNF510 | BC036676 | zinc finger protein 510 | nucleus | regulation of transcription |
Our protein microarray content (n=4,988) included approximately 1000 genes biased towards breast cancer. However, we have not limited the selection of novel AAb to overexpressed tumor antigens, since little is known on a proteome-wide level about the protein structural content that induces AAb formation 9. For the top 28 antigen biomarker panel (Table 2), 13/28 antigens are significantly overexpressed at the RNA level in invasive ductal carcinoma compared with normal breast tissue using the Richardson2 RNA microarray expression dataset 45 (www.oncomine.org). It is not known if any of the antigens that are the targets of these autoantibodies can be found in the serum as potential biomarkers for breast cancer.
The only validated serum biomarkers for breast cancer, i.e. CEA, CA27.29, and CA15.3, are used primarily to monitor advanced disease and do not have sufficient clinical sensitivity for early detection 46. Newer proteomic approaches to distinguish cancer-bearing patient sera from healthy control sera have been challenged by the difficulty in identifying small quantities of protein fragments within complex protein mixtures, by protein instability, and by natural variations in protein content within patient populations 47–49. As potential biomarkers, AAb are highly specific, biochemically stable in blood, and, in general, correlate with tumor burden and disease progression.
Many proteomics-based technologies have been used for the detection of antigen-specific antibodies. These assays are excellent discovery tools, approaching the ultimate goal of proteome-wide immune monitoring. The initial detection of AAb using serum screening of phage libraries (SEREX) has resulted in the identification of tumor antigens from multiple tumor types 11, 50–53. Reverse-phase protein microarray 54, 55, two-dimensional (2-D) immunoblots 56, protein microarrays20–22 and glycan arrays57 have all been used to detected AAb in cancer patient sera. Newer methods, such as phage display and phage-displayed antigen microarrays 58, 59 have also been used to detect AAb in cancer, including breast cancer60, ovarian cancer61, prostate cancer62 and lung cancer63. These approaches have identified many potential AAb biomarkers, but few have undergone large-scale validation studies. This will require multiplexed, clinical-grade assays of AAb detection, such as flow cytometric bead arrays 64 or electrochemiluminscence (ECL) assays65.
Our approach uses programmable protein microarrays for the production of the tumor antigens. Printing cDNA, rather than proteins, eliminates the need to express and purify proteins separately and produces proteins “just-in-time” for the assay, abrogating concerns about protein stability during storage. It also provides flexibility of cDNA manipulation for epitope mapping, tag switching, and mutational analysis. This chemistry has the advantage that mammalian proteins are expressed in a mammalian milieu (reticulocyte lysate) to increase the efficiency of expression and to encourage natural folding of the proteins 27.
A number of other serum AAb have been identified in the sera of breast cancer patients. With a panel of seven tumor-associated antigens (c-MYC, cyclin B1, p62, IMP-1, Koc, p53, and survivin), sera from patients with different cancers could be distinguished from each other and from healthy donor sera 17. In that study, sera from breast, colorectal, gastric, hepatocellular, lung, and prostate cancers were distinguished from normal sera with sensitivities ranging from 0.77–0.92 and specificities from 0.85–0.91, which is better than corresponding values for any of the single antigens. A combined analysis of five tumor antigens (FKBP52, PPIA, PRDX2, HSP60 and MUC1) significantly discriminated primary breast cancer (AUC = 0.73; 95% CI), 0.60–0.79) and carcinoma in situ (CIS) (AUC = 0.80; 95% CI, 0.71–0.85) from healthy individuals 19. With a panel of six tumor antigens (p53, c-MYC, HER2, NY-ESO-1, BRCA2 and MUC1), elevated levels of AAb were seen in at least one of the six antigens in 64% of primary breast cancer patient sera and 45% of patients with ductal carcinoma in situ (DCIS), at a specificity of 85% 18. These early studies, while provocative, remain to be validated in multi-institutional blinded cohorts.
Of these antigens, p53, c-MYC, and MUC1 were present on our arrays, but did not show evidence of selective AAb detection in our serum cohorts. In addition to ATP6AP1 which has been identified as a melanoma autoantigen30, only two of the AAb we have identified have been described as autoantigens in other disease settings, but have not been described as cancer-specific autoantigens. DBT is a known autoantigen target for antimitochondrial antibodies in primary biliary cirrhosis66. SerpinH1 encodes the rheumatoid arthritis-related autoantigen RA0A4767.
One key source of potential bias for serum biomarker detection is the clinical characteristics and sample handling of the serum or plasma. We have designed these studies using independent serum sets derived from multiple institutions (FCCC, DUMC, and DFCI), as well as different clinical settings (screening mammography, diagnostic mammography). All sera for antigen discovery were obtained prior to surgery and prior to treatment, and were collected under similar collection protocols, but we can detect background differences based on the location of the source sera (i.e. Pennsylvania vs. North Carolina, data not shown). -Control sera for the training and validation sets were age-, sex-, and location- matched, and were obtained in the same clinical setting (i.e. diagnostic radiology) as the case sera. We did not detect any differences in either background or positive control antigens between the matched cases and controls in our cohorts. However, clinical validation of any proposed serum biomarkers, including our markers, requires larger, blinded cohorts of sera obtained from multiple institutions. To this end, the NCI Early Detection Research Network (EDRN) has been prospectively collecting a Cancer Reference Sets of sera and plasma for investigators to further evaluate promising blood-based biomarkers.
In summary, these studies identify a potential panel of 28 autoantibody biomarkers for the early detection of breast cancer. These biomarkers have been selected after three independent rounds of screening different sera. Validation studies using multi-institutional, blinded serum sets are being planned.
Supplementary Material
1
Supplemental Table 1. List of 761 tumor antigens expressed on high density protein microarrays.
Table 4.
RNA Overexpression of Target Antigens in Breast Cancer.
| Antigen | p-value |
|---|---|
| ATP6AP1 | 0.194 |
| PDCD6IP | 0.262 |
| DBT | 0.000623 |
| CSNK1E | 0.217 |
| FRS3 | 0.079 |
| RAC3 | 0.000294 |
| HOXD1 | 0.288 |
| SF3A1 | 0.956 |
| CTBP1 | 0.01 |
| C15orf48 | 0.095 |
| MYOZ2 | 0.004 |
| EIF3E | 0.018 |
| BAT4 | 0.025 |
| ATF3 | 0.88 |
| BMX | 0.949 |
| RAB5A | 0.004 |
| UBAP1 | 0.509 |
| SOX2 | 0.013 |
| GPR157 | 0.153 |
| BDNF | 0.000179 |
| ZMYM6 | 0.0000499 |
| SLC33A1 | 0.001 |
| TRIM32 | 0.294 |
| ALG10 | 0.004 |
| TFCP2 | 0.958 |
| SERPINH1 | n.d. |
| SELL | 0.028 |
| ZNF510 | 0.986 |
Acknowledgments
This study was supported by a research grant from the Early Detection Research Network 5U01CA117374 (K.S.A. and J.L). We would like to thank Yanhui Hu for bioinformatic support. We would like to acknowledge the Biosample Repository at FCCC and their Institutional Core Grant (P30 CA006927).
References
- 1.Edwards BK, Brown ML, Wingo PA, Howe HL, Ward E, Ries LA, Schrag D, Jamison PM, Jemal A, Wu XC, Friedman C, Harlan L, Warren J, Anderson RN, Pickle LW. Annual report to the nation on the status of cancer, 1975–2002, featuring population-based trends in cancer treatment. J Natl Cancer Inst. 2005;97(19):1407–27. doi: 10.1093/jnci/dji289. [DOI] [PubMed] [Google Scholar]
- 2.Parkin DM, Bray F, Ferlay J, Pisani P. Global cancer statistics, 2002. CA Cancer J Clin. 2005;55(2):74–108. doi: 10.3322/canjclin.55.2.74. [DOI] [PubMed] [Google Scholar]
- 3.Schmoor C, Sauerbrei W, Bastert G, Bojar H, Schumacher M. Long-term prognosis of breast cancer patients with 10 or more positive lymph nodes treated with CMF. Eur J Cancer. 2001;37(9):1123–31. doi: 10.1016/s0959-8049(01)00090-9. [DOI] [PubMed] [Google Scholar]
- 4.Esserman L, Shieh Y, Thompson I. Rethinking screening for breast cancer and prostate cancer. Jama. 2009;302(15):1685–92. doi: 10.1001/jama.2009.1498. [DOI] [PubMed] [Google Scholar]
- 5.Esserman LJ, Shieh Y, Park JW, Ozanne EM. A role for biomarkers in the screening and diagnosis of breast cancer in younger women. Expert review of molecular diagnostics. 2007;7(5):533–44. doi: 10.1586/14737159.7.5.533. [DOI] [PubMed] [Google Scholar]
- 6.Tamimi RM, Byrne C, Colditz GA, Hankinson SE. Endogenous hormone levels, mammographic density, and subsequent risk of breast cancer in postmenopausal women. J Natl Cancer Inst. 2007;99(15):1178–87. doi: 10.1093/jnci/djm062. [DOI] [PubMed] [Google Scholar]
- 7.Tamimi RM, Hankinson SE, Colditz GA, Byrne C. Endogenous sex hormone levels and mammographic density among postmenopausal women. Cancer Epidemiol Biomarkers Prev. 2005;14(11 Pt 1):2641–7. doi: 10.1158/1055-9965.EPI-05-0558. [DOI] [PubMed] [Google Scholar]
- 8.Hartmann LC, Sellers TA, Frost MH, Lingle WL, Degnim AC, Ghosh K, Vierkant RA, Maloney SD, Pankratz VS, Hillman DW, Suman VJ, Johnson J, Blake C, Tlsty T, Vachon CM, Melton LJ, 3rd, Visscher DW. Benign breast disease and the risk of breast cancer. N Engl J Med. 2005;353(3):229–37. doi: 10.1056/NEJMoa044383. [DOI] [PubMed] [Google Scholar]
- 9.Anderson KS, LaBaer J. The sentinel within: exploiting the immune system for cancer biomarkers. J Proteome Res. 2005;4(4):1123–33. doi: 10.1021/pr0500814. [DOI] [PMC free article] [PubMed] [Google Scholar]
- 10.Jager D, Knuth A. Antibodies and vaccines--hope or illusion? Breast (Edinburgh, Scotland) 2005;14(6):631–5. doi: 10.1016/j.breast.2005.08.029. [DOI] [PubMed] [Google Scholar]
- 11.Jager D, Unkelbach M, Frei C, Bert F, Scanlan MJ, Jager E, Old LJ, Chen YT, Knuth A. Identification of tumor-restricted antigens NY-BR-1, SCP-1, and a new cancer/testis-like antigen NW-BR-3 by serological screening of a testicular library with breast cancer serum. Cancer Immun. 2002;2:5. [PubMed] [Google Scholar]
- 12.Stockert E, Jager E, Chen YT, Scanlan MJ, Gout I, Karbach J, Arand M, Knuth A, Old LJ. A survey of the humoral immune response of cancer patients to a panel of human tumor antigens. The Journal of experimental medicine. 1998;187(8):1349–54. doi: 10.1084/jem.187.8.1349. [DOI] [PMC free article] [PubMed] [Google Scholar]
- 13.Joos TO, Stoll D, Templin MF. Miniaturised multiplexed immunoassays. Curr Opin Chem Biol. 2002;6(1):76–80. doi: 10.1016/s1367-5931(01)00289-7. [DOI] [PubMed] [Google Scholar]
- 14.Stoll D, Templin MF, Schrenk M, Traub PC, Vohringer CF, Joos TO. Protein microarray technology. Front Biosci. 2002;7:c13–32. doi: 10.2741/stoll. [DOI] [PubMed] [Google Scholar]
- 15.Templin MF, Stoll D, Schwenk JM, Potz O, Kramer S, Joos TO. Protein microarrays: promising tools for proteomic research. Proteomics. 2003;3(11):2155–66. doi: 10.1002/pmic.200300600. [DOI] [PubMed] [Google Scholar]
- 16.Robinson WH, DiGennaro C, Hueber W, Haab BB, Kamachi M, Dean EJ, Fournel S, Fong D, Genovese MC, de Vegvar HE, Skriner K, Hirschberg DL, Morris RI, Muller S, Pruijn GJ, van Venrooij WJ, Smolen JS, Brown PO, Steinman L, Utz PJ. Autoantigen microarrays for multiplex characterization of autoantibody responses. Nat Med. 2002;8(3):295–301. doi: 10.1038/nm0302-295. [DOI] [PubMed] [Google Scholar]
- 17.Koziol JA, Zhang JY, Casiano CA, Peng XX, Shi FD, Feng AC, Chan EK, Tan EM. Recursive partitioning as an approach to selection of immune markers for tumor diagnosis. Clin Cancer Res. 2003;9(14):5120–6. [PubMed] [Google Scholar]
- 18.Chapman C, Murray A, Chakrabarti J, Thorpe A, Woolston C, Sahin U, Barnes A, Robertson J. Autoantibodies in breast cancer: their use as an aid to early diagnosis. Ann Oncol. 2007;18(5):868–73. doi: 10.1093/annonc/mdm007. [DOI] [PubMed] [Google Scholar]
- 19.Desmetz C, Bascoul-Mollevi C, Rochaix P, Lamy PJ, Kramar A, Rouanet P, Maudelonde T, Mange A, Solassol J. Identification of a new panel of serum autoantibodies associated with the presence of in situ carcinoma of the breast in younger women. Clin Cancer Res. 2009;15(14):4733–41. doi: 10.1158/1078-0432.CCR-08-3307. [DOI] [PubMed] [Google Scholar]
- 20.MacBeath G, Schreiber SL. Printing proteins as microarrays for high-throughput function determination. Science. 2000;289(5485):1760–3. doi: 10.1126/science.289.5485.1760. [DOI] [PubMed] [Google Scholar]
- 21.Zhu H, Bilgin M, Bangham R, Hall D, Casamayor A, Bertone P, Lan N, Jansen R, Bidlingmaier S, Houfek T, Mitchell T, Miller P, Dean R, Gerstein M, Snyder M. Global analysis of protein activities using proteome chips. Science. 2001;293(5537):2101–2105. doi: 10.1126/science.1062191. [DOI] [PubMed] [Google Scholar]
- 22.Hudson ME, Pozdnyakova I, Haines K, Mor G, Snyder M. Identification of differentially expressed proteins in ovarian cancer using high-density protein microarrays. Proc Natl Acad Sci U S A. 2007;104(44):17494–9. doi: 10.1073/pnas.0708572104. [DOI] [PMC free article] [PubMed] [Google Scholar]
- 23.Gnjatic S, Ritter E, Buchler MW, Giese NA, Brors B, Frei C, Murray A, Halama N, Zornig I, Chen YT, Andrews C, Ritter G, Old LJ, Odunsi K, Jager D. Seromic profiling of ovarian and pancreatic cancer. Proc Natl Acad Sci U S A. doi: 10.1073/pnas.0914213107. [DOI] [PMC free article] [PubMed] [Google Scholar]
- 24.Wandall HH, Blixt O, Tarp MA, Pedersen JW, Bennett EP, Mandel U, Ragupathi G, Livingston PO, Hollingsworth MA, Taylor-Papadimitriou J, Burchell J, Clausen H. Cancer biomarkers defined by autoantibody signatures to aberrant O-glycopeptide epitopes. Cancer Res. 70(4):1306–13. doi: 10.1158/0008-5472.CAN-09-2893. [DOI] [PMC free article] [PubMed] [Google Scholar]
- 25.Ramachandran N, Hainsworth E, Bhullar B, Eisenstein S, Rosen B, Lau AY, Walter JC, LaBaer J. Self-assembling protein microarrays. Science. 2004;305(5680):86–90. doi: 10.1126/science.1097639. [DOI] [PubMed] [Google Scholar]
- 26.Ramachandran N, Raphael JV, Hainsworth E, Demirkan G, Fuentes MG, Rolfs A, Hu Y, LaBaer J. Next-generation high-density self-assembling functional protein arrays. Nat Methods. 2008;5(6):535–8. doi: 10.1038/nmeth.1210. [DOI] [PMC free article] [PubMed] [Google Scholar]
- 27.Ramachandran N, Anderson K, Raphael J, Hainsworth E, Sibani S, Montor W, Pacek M, Wong J, Eljanne M, Sanda M, Hu Y, Logvinenko T, LaBaer J. Tracking humoral responses using self assembling protein microarrays. Proteomics- Clinical Applications. 2008;2(10–11):1518–1527. doi: 10.1002/prca.200800034. [DOI] [PMC free article] [PubMed] [Google Scholar]
- 28.Anderson KS, Sibani S, Wong J, Hainsworth G, Mendoza EA, Eugene R, Raphael J, Logvinenko T, Ramachandran N, Godwin A, Marks J, Engstrom P, LaBaer J. Using custom protein microarrays to identify autoantibody biomarkers for the early detection of breast cancer. San Antonio Breast Cancer Symposium; San Antonio, TX. 2008. [Google Scholar]
- 29.Anderson KS, Ramachandran N, Wong J, Raphael JV, Hainsworth E, Demirkan G, Cramer D, Aronzon D, Hodi FS, Harris L, Logvinenko T, LaBaer J. Application of protein microarrays for multiplexed detection of antibodies to tumor antigens in breast cancer. J Proteome Res. 2008;7(4):1490–9. doi: 10.1021/pr700804c. [DOI] [PMC free article] [PubMed] [Google Scholar]
- 30.Hodi FS, Schmollinger JC, Soiffer RJ, Salgia R, Lynch T, Ritz J, Alyea EP, Yang J, Neuberg D, Mihm M, Dranoff G. ATP6S1 elicits potent humoral responses associated with immune-mediated tumor destruction. Proc Natl Acad Sci U S A. 2002;99(10):6919–24. doi: 10.1073/pnas.102025999. [DOI] [PMC free article] [PubMed] [Google Scholar]
- 31.Koenker RW. Quantile Regression. Cambridge University Press; 2005. [Google Scholar]
- 32.McClish DK. Analyzing a portion of the ROC curve. Med Decis Making. 1989;9(3):190–5. doi: 10.1177/0272989X8900900307. [DOI] [PubMed] [Google Scholar]
- 33.Efron B. Bootstrap Methods: Another Look at the Jackknife. The Annals of Statistics. 1979;7:1–26. [Google Scholar]
- 34.Storey J. A direct approach to false discovery rates. J R Statist Soc B. 2002;64(3):479–498. [Google Scholar]
- 35.Witt AE, Hines LM, Collins NL, Hu Y, Gunawardane RN, Moreira D, Raphael J, Jepson D, Koundinya M, Rolfs A, Taron B, Isakoff SJ, Brugge JS, LaBaer J. Functional proteomics approach to investigate the biological activities of cDNAs implicated in breast cancer. J Proteome Res. 2006;5(3):599–610. doi: 10.1021/pr050395r. [DOI] [PMC free article] [PubMed] [Google Scholar]
- 36.Breiman L. Random Forests. Mach Learn. 2001;45(1):5–32. [Google Scholar]
- 37.Zhao H, Langerod A, Ji Y, Nowels KW, Nesland JM, Tibshirani R, Bukholm IK, Karesen R, Botstein D, Borresen-Dale AL, Jeffrey SS. Different gene expression patterns in invasive lobular and ductal carcinomas of the breast. Mol Biol Cell. 2004;15(6):2523–36. doi: 10.1091/mbc.E03-11-0786. [DOI] [PMC free article] [PubMed] [Google Scholar]
- 38.Mira JP, Benard V, Groffen J, Sanders LC, Knaus UG. Endogenous, hyperactive Rac3 controls proliferation of breast cancer cells by a p21-activated kinase-dependent pathway. Proc Natl Acad Sci U S A. 2000;97(1):185–9. doi: 10.1073/pnas.97.1.185. [DOI] [PMC free article] [PubMed] [Google Scholar]
- 39.Baugher PJ, Krishnamoorthy L, Price JE, Dharmawardhane SF. Rac1 and Rac3 isoform activation is involved in the invasive and metastatic phenotype of human breast cancer cells. Breast Cancer Res. 2005;7(6):R965–74. doi: 10.1186/bcr1329. [DOI] [PMC free article] [PubMed] [Google Scholar]
- 40.Palijan A, Fernandes I, Verway M, Kourelis M, Bastien Y, Tavera-Mendoza LE, Sacheli A, Bourdeau V, Mader S, White JH. Ligand-dependent corepressor LCoR is an attenuator of progesterone-regulated gene expression. J Biol Chem. 2009;284(44):30275–87. doi: 10.1074/jbc.M109.051201. [DOI] [PMC free article] [PubMed] [Google Scholar]
- 41.Kwok S, Rittling SR, Partridge NC, Benson CS, Thiyagaraj M, Srinivasan N, Selvamurugan N. Transforming growth factor-beta1 regulation of ATF-3 and identification of ATF-3 target genes in breast cancer cells. J Cell Biochem. 2009;108(2):408–14. doi: 10.1002/jcb.22267. [DOI] [PubMed] [Google Scholar]
- 42.Grzmil M, Rzymski T, Milani M, Harris AL, Capper RG, Saunders NJ, Salhan A, Ragoussis J, Norbury CJ. An oncogenic role of eIF3e/INT6 in human breast cancer. Oncogene. 29(28):4080–9. doi: 10.1038/onc.2010.152. [DOI] [PubMed] [Google Scholar]
- 43.Chen Y, Shi L, Zhang L, Li R, Liang J, Yu W, Sun L, Yang X, Wang Y, Zhang Y, Shang Y. The molecular mechanism governing the oncogenic potential of SOX2 in breast cancer. J Biol Chem. 2008;283(26):17969–78. doi: 10.1074/jbc.M802917200. [DOI] [PubMed] [Google Scholar]
- 44.Tozlu S, Girault I, Vacher S, Vendrell J, Andrieu C, Spyratos F, Cohen P, Lidereau R, Bieche I. Identification of novel genes that co-cluster with estrogen receptor alpha in breast tumor biopsy specimens, using a large-scale real-time reverse transcription-PCR approach. Endocrine-related cancer. 2006;13(4):1109–20. doi: 10.1677/erc.1.01120. [DOI] [PubMed] [Google Scholar]
- 45.Richardson AL, Wang ZC, De Nicolo A, Lu X, Brown M, Miron A, Liao X, Iglehart JD, Livingston DM, Ganesan S. X chromosomal abnormalities in basal-like human breast cancer. Cancer Cell. 2006;9(2):121–32. doi: 10.1016/j.ccr.2006.01.013. [DOI] [PubMed] [Google Scholar]
- 46.Harris L, Fritsche H, Mennel R, Norton L, Ravdin P, Taube S, Somerfield MR, Hayes DF, Bast RC., Jr American Society of Clinical Oncology 2007 update of recommendations for the use of tumor markers in breast cancer. J Clin Oncol. 2007;25(33):5287–312. doi: 10.1200/JCO.2007.14.2364. [DOI] [PubMed] [Google Scholar]
- 47.Petricoin E, Wulfkuhle J, Espina V, Liotta LA. Clinical proteomics: revolutionizing disease detection and patient tailoring therapy. J Proteome Res. 2004;3(2):209–17. doi: 10.1021/pr049972m. [DOI] [PubMed] [Google Scholar]
- 48.Anderson NL, Anderson NG. The human plasma proteome: history, character, and diagnostic prospects. Mol Cell Proteomics. 2002;1(11):845–67. doi: 10.1074/mcp.r200007-mcp200. [DOI] [PubMed] [Google Scholar]
- 49.Wulfkuhle J, McLean K, Paweletz C, Sgroi D, Trock B, Steeg P, Petricoin Er. New approaches to proteomic analysis of breast cancer. Proteomics. 2001;1(10):1205–15. doi: 10.1002/1615-9861(200110)1:10<1205::AID-PROT1205>3.0.CO;2-X. [DOI] [PubMed] [Google Scholar]
- 50.Forti S, Scanlan MJ, Invernizzi A, Castiglioni F, Pupa S, Agresti R, Fontanelli R, Morelli D, Old LJ, Pupa SM, Menard S. Identification of breast cancer-restricted antigens by antibody screening of SKBR3 cDNA library using a preselected patient’s serum. Breast Cancer Res Treat. 2002;73(3):245–56. doi: 10.1023/a:1015854415746. [DOI] [PubMed] [Google Scholar]
- 51.Gure AO, Stockert E, Scanlan MJ, Keresztes RS, Jager D, Altorki NK, Old LJ, Chen YT. Serological identification of embryonic neural proteins as highly immunogenic tumor antigens in small cell lung cancer. Proc Natl Acad Sci U S A. 2000;97(8):4198–203. doi: 10.1073/pnas.97.8.4198. [DOI] [PMC free article] [PubMed] [Google Scholar]
- 52.Gure AO, Altorki NK, Stockert E, Scanlan MJ, Old LJ, Chen YT. Human lung cancer antigens recognized by autologous antibodies: definition of a novel cDNA derived from the tumor suppressor gene locus on chromosome 3p21.3. Cancer Res. 1998;58(5):1034–41. [PubMed] [Google Scholar]
- 53.Jager D, Stockert E, Gure AO, Scanlan MJ, Karbach J, Jager E, Knuth A, Old LJ, Chen YT. Identification of a tissue-specific putative transcription factor in breast tissue by serological screening of a breast cancer library. Cancer Res. 2001;61(5):2055–61. [PubMed] [Google Scholar]
- 54.Bouwman K, Qiu J, Zhou H, Schotanus M, Mangold LA, Vogt R, Erlandson E, Trenkle J, Partin AW, Misek D, Omenn GS, Haab BB, Hanash S. Microarrays of tumor cell derived proteins uncover a distinct pattern of prostate cancer serum immunoreactivity. Proteomics. 2003;3(11):2200–7. doi: 10.1002/pmic.200300611. [DOI] [PubMed] [Google Scholar]
- 55.Qiu J, Madoz-Gurpide J, Misek DE, Kuick R, Brenner DE, Michailidis G, Haab BB, Omenn GS, Hanash S. Development of natural protein microarrays for diagnosing cancer based on an antibody response to tumor antigens. J Proteome Res. 2004;3(2):261–7. doi: 10.1021/pr049971u. [DOI] [PubMed] [Google Scholar]
- 56.Lichtenfels R, Kellner R, Atkins D, Bukur J, Ackermann A, Beck J, Brenner W, Melchior S, Seliger B. Identification of metabolic enzymes in renal cell carcinoma utilizing PROTEOMEX analyses. Biochim Biophys Acta. 2003;1646(1–2):21–31. doi: 10.1016/s1570-9639(02)00547-2. [DOI] [PubMed] [Google Scholar]
- 57.Wang CC, Huang YL, Ren CT, Lin CW, Hung JT, Yu JC, Yu AL, Wu CY, Wong CH. Glycan microarray of Globo H and related structures for quantitative analysis of breast cancer. Proc Natl Acad Sci U S A. 2008;105(33):11661–6. doi: 10.1073/pnas.0804923105. [DOI] [PMC free article] [PubMed] [Google Scholar]
- 58.Fossa A, Alsoe L, Crameri R, Funderud S, Gaudernack G, Smeland EB. Serological cloning of cancer/testis antigens expressed in prostate cancer using cDNA phage surface display. Cancer Immunol Immunother. 2004;53(5):431–8. doi: 10.1007/s00262-003-0458-8. [DOI] [PMC free article] [PubMed] [Google Scholar]
- 59.Sioud M, Hansen MH. Profiling the immune response in patients with breast cancer by phage-displayed cDNA libraries. Eur J Immunol. 2001;31(3):716–25. doi: 10.1002/1521-4141(200103)31:3<716::aid-immu716>3.0.co;2-9. [DOI] [PubMed] [Google Scholar]
- 60.Minenkova O, Pucci A, Pavoni E, De Tomassi A, Fortugno P, Gargano N, Cianfriglia M, Barca S, De Placido S, Martignetti A, Felici F, Cortese R, Monaci P. Identification of tumor-associated antigens by screening phage-displayed human cDNA libraries with sera from tumor patients. Int J Cancer. 2003;106(4):534–44. doi: 10.1002/ijc.11269. [DOI] [PubMed] [Google Scholar]
- 61.Chatterjee M, Mohapatra S, Ionan A, Bawa G, Ali-Fehmi R, Wang X, Nowak J, Ye B, Nahhas FA, Lu K, Witkin SS, Fishman D, Munkarah A, Morris R, Levin NK, Shirley NN, Tromp G, Abrams J, Draghici S, Tainsky MA. Diagnostic markers of ovarian cancer by high-throughput antigen cloning and detection on arrays. Cancer Res. 2006;66(2):1181–90. doi: 10.1158/0008-5472.CAN-04-2962. [DOI] [PMC free article] [PubMed] [Google Scholar]
- 62.Wang X, Yu J, Sreekumar A, Varambally S, Shen R, Giacherio D, Mehra R, Montie JE, Pienta KJ, Sanda MG, Kantoff PW, Rubin MA, Wei JT, Ghosh D, Chinnaiyan AM. Autoantibody signatures in prostate cancer. N Engl J Med. 2005;353(12):1224–35. doi: 10.1056/NEJMoa051931. [DOI] [PubMed] [Google Scholar]
- 63.Chen G, Wang X, Yu J, Varambally S, Thomas DG, Lin MY, Vishnu P, Wang Z, Wang R, Fielhauer J, Ghosh D, Giordano TJ, Giacherio D, Chang AC, Orringer MB, El-Hefnawy T, Bigbee WL, Beer DG, Chinnaiyan AM. Autoantibody profiles reveal ubiquilin 1 as a humoral immune response target in lung adenocarcinoma. Cancer Res. 2007;67(7):3461–7. doi: 10.1158/0008-5472.CAN-06-4475. [DOI] [PubMed] [Google Scholar]
- 64.Wong J, Sibani S, Lokko NN, LaBaer J, Anderson KS. Rapid detection of antibodies in sera using multiplexed self-assembling bead arrays. J Immunol Methods. 2009;350(1–2):171–82. doi: 10.1016/j.jim.2009.08.013. [DOI] [PMC free article] [PubMed] [Google Scholar]
- 65.Marchese RD, Puchalski D, Miller P, Antonello J, Hammond O, Green T, Rubinstein LJ, Caulfield MJ, Sikkema D. Optimization and validation of a multiplex, electrochemiluminescence-based detection assay for the quantitation of immunoglobulin G serotype-specific antipneumococcal antibodies in human serum. Clin Vaccine Immunol. 2009;16(3):387–96. doi: 10.1128/CVI.00415-08. [DOI] [PMC free article] [PubMed] [Google Scholar]
- 66.Csepregi A, Obermayer-Straub P, Kneip S, Kayser A, Loges S, Schmidt E, Nemesanszky E, Szalay F, Manns MP, Strassburg CP. Characterization of a lipoyl domain-independent B-cell autoepitope on the human branched-chain acyltransferase in primary biliary cirrhosis and overlap syndrome with autoimmune hepatitis. Clin Dev Immunol. 2003;10(2–4):173–81. doi: 10.1080/10446670310001642159. [DOI] [PMC free article] [PubMed] [Google Scholar]
- 67.Hattori T, Takahash K, Yutani Y, Fujisawa T, Nakanishi T, Takigawa M. Rheumatoid arthritis-related antigen 47kDa (RA-A47) is a product of colligin-2 and acts as a human HSP47. J Bone Miner Metab. 2000;18(6):328–34. doi: 10.1007/s007740070004. [DOI] [PubMed] [Google Scholar]
- 68.Huttenhower C, Haley EM, Hibbs MA, Dumeaux V, Barrett DR, Coller HA, Troyanskaya OG. Exploring the human genome with functional maps. Genome Res. 2009;19(6):1093–106. doi: 10.1101/gr.082214.108. [DOI] [PMC free article] [PubMed] [Google Scholar]
- 69.Mahul-Mellier AL, Strappazzon F, Petiot A, Chatellard-Causse C, Torch S, Blot B, Freeman K, Kuhn L, Garin J, Verna JM, Fraboulet S, Sadoul R. Alix and ALG-2 are involved in tumor necrosis factor receptor 1-induced cell death. J Biol Chem. 2008;283(50):34954–65. doi: 10.1074/jbc.M803140200. [DOI] [PMC free article] [PubMed] [Google Scholar]
- 70.Iejima D, Minegishi Y, Takenaka K, Siswanto A, Watanabe M, Huang L, Watanabe T, Tanaka F, Kuroda M, Gotoh N. FRS2beta, a potential prognostic gene for non-small cell lung cancer, encodes a feedback inhibitor of EGF receptor family members by ERK binding. Oncogene. 29(21):3087–99. doi: 10.1038/onc.2010.69. [DOI] [PubMed] [Google Scholar]
- 71.Zhou J, Wang H, Lu A, Hu G, Luo A, Ding F, Zhang J, Wang X, Wu M, Liu Z. A novel gene, NMES1, downregulated in human esophageal squamous cell carcinoma. Int J Cancer. 2002;101(4):311–6. doi: 10.1002/ijc.10600. [DOI] [PubMed] [Google Scholar]
- 72.Chen KY, Huang LM, Kung HJ, Ann DK, Shih HM. The role of tyrosine kinase Etk/Bmx in EGF-induced apoptosis of MDA-MB-468 breast cancer cells. Oncogene. 2004;23(10):1854–62. doi: 10.1038/sj.onc.1207308. [DOI] [PubMed] [Google Scholar]
- 73.Torres VA, Mielgo A, Barbero S, Hsiao R, Wilkins JA, Stupack DG. Rab5 mediates caspase-8-promoted cell motility and metastasis. Mol Biol Cell. 21(2):369–76. doi: 10.1091/mbc.E09-09-0769. [DOI] [PMC free article] [PubMed] [Google Scholar]
- 74.Qian J, Zhang XM, Li XL, Wang JR, Li WF, Wang R, Li GY. [Identification of digital differential expression patterns of a novel human gene (UBAP1) by an expressed sequence tag strategy] Ai Zheng. 2002;21(3):225–8. [PubMed] [Google Scholar]
- 75.Kano S, Miyajima N, Fukuda S, Hatakeyama S. Tripartite motif protein 32 facilitates cell growth and migration via degradation of Abl-interactor 2. Cancer Res. 2008;68(14):5572–80. doi: 10.1158/0008-5472.CAN-07-6231. [DOI] [PubMed] [Google Scholar]
- 76.Nese N, Kandiloglu AR, Simsek G, Lekili M, Ozdamar A, Catalkaya A, Coskun T. Comparison of the desmoplastic reaction and invading ability in invasive ductal carcinoma of the breast and prostatic adenocarcinoma based on the expression of heat shock protein 47 and fascin. Anal Quant Cytol Histol. 32(2):90–101. [PubMed] [Google Scholar]
Associated Data
This section collects any data citations, data availability statements, or supplementary materials included in this article.
Supplementary Materials
1
Supplemental Table 1. List of 761 tumor antigens expressed on high density protein microarrays.