Pulmonary function, bronchial reactivity, and epithelial permeability are response phenotypes to ozone and develop differentially in healthy humans (original) (raw)
Abstract
Effect of laboratory exposure to O3 (220 ppb) and filtered air (FA) on respiratory physiology were evaluated at two time points (acute and 1 day postexposure) in healthy cohort (n = 138, 18–35 yr, 40% women) comprised mainly of Caucasian (60%) and African American (33.3%) subjects. Randomized exposures had a crossover design and durations of 2.25 h that included rest and treadmill walking. Airway responsiveness (AHR) to methacholine (Mch) and permeability of respiratory epithelium (EI) to hydrophilic radiomarker (99mTc-DTPA, MW = 492), were measured at 1-day postexposure. O3 significantly affected FEV1 and FVC indices acutely with mean decrements from pre-exposure values on the order of 7.7 to 8.8% and 1.8 to 2.3% at 1-day post. Acute FEV1 and FVC decreases were most robust in African American male subjects. At 1-day post, O3 induced significant changes in AHR (slope of Mch dose response curve) and EI (Tc99m-DTPA clearance half-time). Based on conventional thresholds of response and dichotomous classification of subjects as responders and nonresponders, sensitivity to O3 was shown to be nonuniform. Acute decrements ≥15% in FEV1, a doubling of Mch slope, or ≥15% increase in EI developed in 20.3%, 23.1%, and 25.9%, respectively, of subjects evaluated. Results demonstrate a diffuse sensitivity to O3 and physiological responses, either acutely (decreases in FEV1) or 1 day post (development of AHR or change in EI) occur differentially in healthy young adults. Random overlap among subjects classified as responsive for respective FEV1, AHR, and EI endpoints suggests these are separate and independent phenotypes of O3 exposure.
Keywords: FEV1, airway reactivity, epithelial integrity, ethnicity
airborne environmental irritants can exert an initiating role in the exacerbation of disease processes, especially those associated with respiratory health (12, 32, 50). Inhalable irritants include both gas and solid phase air pollutants such as ozone (O3) and particulate matter (PM). O3, a highly reactive gas and major component of urban smog, is formed in the presence of sunlight from the interaction of volatile organic compounds with oxides of nitrogen, both of which are generated from multiple sources, i.e., motor vehicle exhaust, industrial emissions, gasoline vapors, and chemical solvents. In addition, photooxidative aging of airborne emission mixtures enhances toxicity of respirable particulates (8, 44).
An edemagenic lung irritant like O3 can deposit on epithelial membrane surfaces of the airway and also penetrate to the more distal surfaces essential for gas exchange (24). Toxicity of O3 to respiratory tissues is primarily attributed to generation of reactive oxygen metabolites (ROM) and ozononation of fatty acids present at epithelial cell surfaces and in lung lining fluids (30, 38). In controlled laboratory settings, early (3 h) and late (1-day post) responses of human subjects to O3 exposure include an infiltration into airway and alveolar surface fluids of serum proteins, inflammatory cells, and mediators (10, 29). The presence of cellular and molecular markers of epithelial membrane injury and the diffusivity of small hydrophilic molecules within submucosal tissues suggests epithelial injury together with soluble cellular and secreted mediators likely contribute to enhancement of physiological and airway functional responses, i.e., airway hyperreactivity (43).
We previously established that exposure of human subjects to moderate concentrations of O3 can alter the integrity of epithelial surfaces of the lower respiratory tract; although not a consistent observation acutely at the point of exposure, an increase in paracellular permeability of low-molecular weight hydrophilic materials was found to be present at 18–20 h postexposure (17). An alteration of epithelial integrity conveys a risk that xenobiotic and mitogenic substances that are normally contained by barrier defenses at epithelial surfaces may gain access to submucosal tissue elements leading to injury and increases in tissue repair (47). In an additional investigation we determined that airway hyperresponsiveness (AHR) in response to nonspecific bronchoprovocation was also present at ∼1-day postexposure, although a range in severity of the airway hyperreactivity was codependent on environmental temperature conditions of the exposure to O3 (14). Airway hyperresponsiveness is present in all humans with asthma, at least when symptomatic. The long-term effect(s) of increased airway responsiveness are unknown, although it is frequently considered as a risk factor for the development of chronic lung disease. Both of these prior laboratory studies although informative for the delineation of O3-induced changes in epithelial and airway functions and with statistically significant outcomes, were accomplished in a limited number of subjects.
The objective of the present investigation was to test the hypothesis that O3-induced changes in epithelial membrane integrity associate with the development of AHR and increased airway sensitivity to the prototypal bronchoprovocation agonist, methacholine. Airway exposure to irritants such as cigarette smoke has been associated with sensitivity to methacholine in habituated smokers (45), and although respiratory epithelial integrity is well known to be susceptible to cigarette smoke (27), the presence of bronchial AHR in at least young smokers appears unrelated to epithelial permeability (46). However, for other inflammatory airway diseases, such as stable asthma, the opposite has been demonstrated, and respiratory membrane permeability correlated with the patient's degree of airway AHR (26, 48). Whether barrier integrity of epithelial lining cells known to be ozone labile contributes to and correlates with bronchial reactivity to agonist stimulation of the airway has not been evaluated in humans. To test the hypothesis, we recruited healthy, adult subjects and monitored post-O3 the changes in pulmonary function at early and late (20–24 h) time points; additionally at the later time point dual assessments of epithelial integrity and non-specific AHR as well were accomplished.
METHODS
Subject recruitment and characteristics.
Healthy women and men were recruited by advertisement to participate in the research. Subjects within the normal range of body mass index and without evidence of pulmonary disease or respiratory symptoms suggestive of asthma (cough, wheezing, dyspnea, and chest tightness) as determined by clinical history and physical examination were selected for enrollment. Subject ethnicity was based on self-reported selection. Atopic status of the volunteers was determined by skin test to 10 aeroallergens common to North Carolina region. Subject exclusions: a recent (within 4 wk) respiratory infection, current or prior smoking history, pregnancy, age <18 or >35 yr, or inability to understand the protocol. All subjects were requested to refrain from antihistamines, nonsteroidal anti-inflammatory agents, and supplemental antioxidants, e.g., vitamins C and E, for 1 wk before and during visits. Subjects with a greater than 10% fall in forced expiratory volume in 1 s (FEV1) after 10 min of walking on a treadmill were excluded from participating in the protocol. Table 1 lists ethnicity and sex distributions of the subjects (n = 138) recruited to the protocol and means ± SD for age, BMI, vital capacity (FVC), FEV1, and the FEV1/FVC ratio for female and male subjects at enrollment. Overall, the majority of the subjects were of Caucasian (60.0%) or African American (33.3%) ancestry and 39.8% were women; pulmonary function values for all subjects were within predicted normal range for age, sex, and body habitus. BMIs (kg/m2) were within range of normal and similar for women and men, with means of 22.82 ± 0.28 SD, and 24.05 ± 0.24 SD. Of the 138 subjects recruited to the study, 121 were skin tested (n = 50 women and n = 71 men) and of these 48% of the women and 49.3% of the men, were found to be positive for 1–5 community antigens. Subjects provided written informed consent at enrollment and the protocol was approved by the Duke University Investigational Review Board.
Table 1.
Subject characteristics
| Women | Men | |
|---|---|---|
| Ethnicity | ||
| Subject number | 55 | 83 |
| Caucasian | 28 | 55 |
| African American | 24 | 22 |
| Hispanic | 0 | 2 |
| Asian | 3 | 4 |
| Age, yr | 23.05 ± 3.86 | 22.25 ± 4.10 |
| BMI, kg/m2 | 22.82 ± 2.07 | 24.05 ± 2.19 |
| FEV1 (l/s) @ baseline | 3.10 ± 0.44 | 4.43 ± 0.73 |
| FVC (l) @ baseline | 3.64 ± 0.52 | 5.42 ± 0.91 |
| FEV1/FVC | 0.86 ± 0.07 | 0.82 ± 0.09 |
Protocol design.
A crossover design was followed with the order of filtered air (FA) and O3 exposures randomized and thus each subject served as his/her own control with a minimum 14-day washout period between exposures. Baseline and immediately postexposure changes in pulmonary function, i.e., FVC and FEV1 were measured by spirometry. Approximately 1 day postexposure the subjects returned to the laboratory for reassessment of pulmonary function, followed by measurements of epithelial permeability and AHR to Mch aerosol challenge. All data derived from spirometry were obtained in triplicate in accordance with guidelines and recommendations of the American Thoracic Society (1994).
Laboratory exposures.
Exposures to FA or O3 took place in an exposure room (730 cu ft) that was capable of 30 turnovers (passes)/h and included a conditioned air ventilation system; the air supply was HEPA-filtered, dried, and conditioned to a selected range of temperatures (20–23°C) and relative humidity (45–55%). Exposures had durations of 135 min and a subject's physical activity level during exposure alternated between 15-min periods of rest (sitting) and treadmill walking. The activity period was to mimic an individual performing mild physical activity under ambient conditions. To obtain a consistent delivery of O3 to similar areas of the respiratory tract during activity periods, the degree of walking necessary to raise minute ventilation to ∼6–8× forced vital capacity (FVC, l/min) was established during history assessment and screening procedures, and thus this amount of minute ventilation was the targeted ventilation used during activity periods of the exposures (14). For exposure to O3 the dose was controlled to within ±10 ppb of 220 ppb air and was monitored continuously for O3 (Teledyne, Advanced Pollution Instrumentation, model 400E, San Diego, CA). O3 was generated from 100% O2 source by cold plasma corona discharge (Ozotech, Yreka, CA) and mixed with filtered air before addition to the chamber. Minute ventilation, frequency of ventilation, pulse rate, and transcutaneous O2-sat were monitored periodically during the exposures. During summer months in the Triangle area of NC the ambient level of O3 may peak in excess of 120 ppb (daily readouts of air quality for Durham County and RTP community of NC are available by internet from EPA), and therefore to avoid secondary exposures, protocols (filtered air or O3) were postponed 10–14 days during periods when community O3 levels consistently peaked above 120 ppb.
Bronchoprovocation methods.
Subjects were pretrained to follow a visual display guide and regulate their inspiratory flow rates (<0.5 l/s) during inhalation of saline (0.9% NaCl) aerosol, followed by increasing doses of methacholine diluted in 0.9% NaCl. Methacholine-chloride (Mch, provocholine, Metapharm, Coral Springs, FL) solutions were made fresh for each test challenge. The Mch aerosol, generated by jet nebulization and powered from a filtered air supply at 35 psi, was inhaled with a nose-clip in place during mouth breathing to inspiratory capacity with a dosimeter (Spira-elektra 2, Respiratory Care Center, Finland) to control onset and duration of nebulization. At the end of the aerosol inhalation breath, a 5-s breath-hold was instituted, before a slow exhalation to rest lung position. The starting aerosol dose level of Mch was 0.025 mg/ml and then increased on each subsequent aerosol dose to a maximal level of 25 mg/ml. After the fifth aerosol inhalation at each Mch dose, subjects relaxed for 2 min and then had their spirometric response measured for each cumulative Mch dose inhaled. Challenge procedures were halted if FEV1 fell by 20% or more from the maximum FEV1 that was recorded at baseline (following 0.9% NaCl) or during the challenge or when the maximum Mch dose was delivered. Based on advantages of analysis method recommended by O'Connor and colleagues (36) and its sensitivity to quantitate AHR in a general population by Schwartz et. al. (41), we characterized Mch responsiveness by calculating the dose-response slope for each subject. To avoid negative slopes, the absolute decline in FEV1 was defined as the difference between the maximum FEV1 over all Mch levels tested and FEV1 at the last level measured, irrespective of the dose level at which the maximum FEV1 occurred (41). Thus the percentage decline was computed using the maximum FEV1 as the reference value; and the dose-response slope was then defined as the ratio between the percentage decline in FEV1 and the total cumulative dose of Mch (mg inhaled from the nebulizer). A doubling of the slope of the Mch dose-response curve after ozone compared with after filtered air exposure was used as criteria to define a subject as ozone responsive for this endpoint (AHR to Mch).
Epithelial integrity methods.
Lung clearance of the hydrophilic radiomarker, 99mTc-diethylenetriamine pentaacetate (99mTc-DTPA, MW = 490 Daltons; Draxis Pharmaceutical, Quebec, Canada) through para-cellular pathways following aerosol deposition onto epithelial surfaces was measured non-invasively by scintigraphy with a γ-camera (Picker, Dyna 5). We used these methods previously in both animal models and humans (15, 17), and for human subjects, imaging is acquired from the posterior aspect in an erect, sitting position. 99mTc-DTPA on occasion is sampled prior to and postaerosolization to certify stability of the radiolabel during the measurement by chromatographic analysis (6). Prior to inhalation of 99mTc-DTPA a ventilation scan is acquired with 133xenon gas and rebreathing circuit (Pulmonmex, Biodex, NY) to obtain a steady-state image of regional lung volume at functional residual capacity (16). The ventilation image is subsequently used to correct for tissue attenuation and to precisely outline ventilated lung regions for analysis of deposition and lung clearance kinetics of 99mTc-DTPA. The 99mTc-DTPA aerosol, generated by jet nebulization technique (Ultravent, Mallinkrodt, St. Louis, MO) and energized with a filtered air supply at 35 psi, is delivered at ambient pressure as an aqueous droplet (equivalent aerodynamic diameter of 1.2 μm and a σg >1.2). To facilitate preferential deposition onto epithelial surfaces of the airway, 99mTc-DTPA aerosol is inhaled with an aerosol dosimeter (Spira-elektra 2, Respiratory Care Center, Finland) and mouth breathing in a seated position using a controlled inspiratory flow rate (<0.5 l/s), and a 5-s breath hold at end inhalation (17, 18). Analysis methods to characterize the regional clearance kinetics of 99mTc-DTPA from the lung have been developed previously and retention levels of 99mTc-DTPA are decay corrected and graphs are constructed of lung clearance vs. time and indexed as a half-time (T1/2) of clearance using a linear regression analysis (assumes a mono-exponential clearance process) (17). Analysis techniques based on the ventilation scan with Xe133 evaluated the penetration and distribution of the 99mTc-DTPA droplets onto the distal airway. A number of factors that may influence the clearance of small soluble molecules through paracellular pathways of alveolar epithelia, i.e., surface area, lung volume, position of the lung with respect to gravity, etc., are less influential to clearance of these molecules from the epithelial surfaces of the distal airway. Clearance of soluble markers from the peripheral airway by mucociliary clearance has not been problematic previously or in the present study using the methods described above for aerosol delivery and clearance assessment of 99mTc-DTPA.
Criteria for severity of ozone responses (FEV1, PD20 Mch, and 99mTc-DTPA T1/2).
We and others have demonstrated that the functional and biologic responses to ozone in laboratory studies are diverse, with healthy subjects demonstrating mild to high sensitivity to ozone (4, 37, 45). Physiological responses have generally been found to follow dose-response relationships with threshold concentrations leading to more robust responses (23, 42). For the present study we used a dichotomous classification to rank subjects as responsive to ozone based on exposure-induced changes in FEV1, epithelial permeability to 99mTc-DTPA, and bronchial responsiveness to Mch. Thus we considered a subject to be FEV1 responsive, if immediately after exposure to ozone the subject had an acute pre-post change in FEV1 of ≥15%. This convention is consistent with prior studies. For example others have classified subjects as O3 “sensitive” who had a ≥10% decrease in the FEV1 acutely following exposure to 200 ppb (4) or a fall of 15% or greater for more effective concentrations (>400 ppb) (37). Although less is known whether response thresholds also exist a full day after exposure for ozone-induced alterations in epithelial integrity and/or responsiveness to Mch, by our own convention we set changes in permeability (≥15% decrease in the T1/2) or sensitivity to Mch (doubling in the slope of the Mch dose-response curve) as criteria to identify ozone-responsive subjects for these response phenotypes.
Statistical measures.
To ensure controlled exposure conditions of temperature, relative humidity, and ozone concentration, continuous read-outs of conditions permitted readjustment whenever necessary. For assessment of MV during exercise activity periods, expired minute volume was measured and recorded directly for 1–2 min by mouth breathing with a dry gas meter. Standard statistical methods were used to determine the mean (±SE) of response endpoints. For basic comparisons between responses to FA and O3, e.g., to determine the significance of differences in 99mTc-DTPA lung clearance, dose-response slope to Mch challenge, and FEV1 and FVC, Snedcor's F test and two-tailed Student's _t_-test were used to determine the equality of variances and the significance of the differences in response to treatment (FA vs. O3). Linear regression analyses (method of least squares) was used to test for 1) associations between FEV1 and FVC outcomes measured either acutely after FA or ozone or at ∼1 day postexposure and 2) possible correlations between response elements (FEV1, Mch dose response slope, and T1/2 permeability). For inter-comparisons of group data based on ethnicity or sex for a measured endpoint (FEV1, FVC, Mch dose response slope, T1/2) an unpaired _t_-test was applied to determine if differences between groupings or sex were significant.
RESULTS
Measures of airway functional response to ozone.
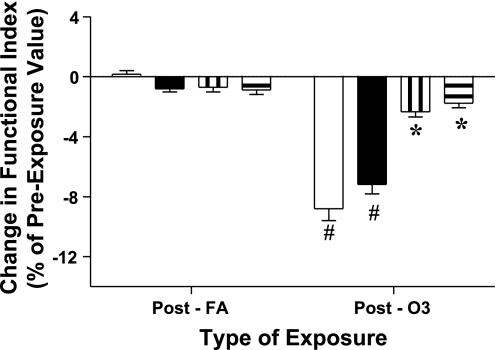
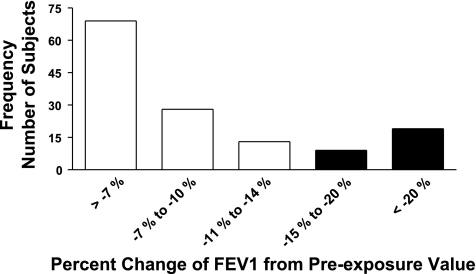
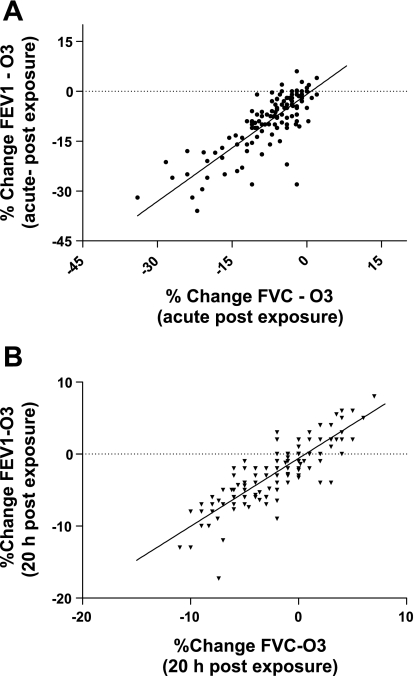
By design, minute ventilations (MV) during the treadmill activity periods of each exposure treatment (FA and O3) were targeted for a given individual and based upon lung volume (see methods). The MV achieved by the subjects during activity periods did not differ significantly between FA and O3 exposures; the means for female subjects were 22.47 (±3.78 SD) and 23.88 (±4.72 SD) l/min, and for the male subjects, means of 31.49 (±6.28 SD) and 32.14 (±6.14 SD) l/min for FA and O3 exposures, respectively. In general, and as reported previously, during exposures and when minute ventilation is increased by treadmill walking, subjects reduce the depth of the tidal volume inspired with a compensatory increase in the frequency of respiration (19). The mean changes in pulmonary function of the subjects measured immediately after exposure to O3 and FA are presented in Fig. 1. FEV1 and FVC responses were calculated as the percent change from the functional values observed pre-exposure. Immediately following exposure to O3, reductions in functional indices of the FEV1 and FVC were observed with mean decreases of 8.80% (±0.79 SE) and 7.18% (±0.64 SE), respectively. These impairments, as shown in Fig. 1, were significant compared with function following exposure to FA. Additionally, when remeasured at ∼1-day postexposure, FEV1 and FVC after ozone, although in recovery, were still slightly reduced, e.g., mean decreases of 2.31% (±0.35 SE) and 1.78% (±0.31 SE), respectively from the pre-exposure values. Although these changes at ∼24 h after ozone were improved, the difference was significant compared with function 24 h after FA exposure. When compared in total (men and women together), the mean FEV1 and FVC responses to ozone of the two largest ethnicity groups (African American and Caucasian) did not differ significantly; however, when analyzed separately between sex FEV1 response of African American men (mean decrease of 16.79%) to ozone was more robust than observed for either black women (decrease of 6.18%) or Caucasian men (7.94% fall from pre-exposure FEV1), and these differences were significant, P ≤ 0.003. For comparison, the differences between sex and ethnic subject groupings with respect to the acute FEV1 and FVC mean responses to O3 are presented in Table 2. As shown above in Fig. 1, there were no substantive effects either acutely or at 1-day postexposure from exposure to FA on FEV1 or FVC and thus response data to FA are not included in Table 2. When the functional responses to ozone for all subjects are viewed together, FEV1 was found to range from no change, to considerably robust responses; this is demonstrated in a frequency response histogram, presented in Fig. 2. A range in sensitivity to ozone based on the decrement in FEV1 was observed at the early time point, acutely at end exposure. For example, and based on a threshold of a ≥15% decrease in FEV1, 28 of the 138 subjects (20.3%) exhibited this level or greater of impairment of FEV1 function. The pre/post changes in FEV1 after ozone, both acutely and after ∼24 h, were associated with the respective and corresponding pre/post changes in FVC; these relationships are presented in Fig. 3, A and B, and, when fit with a least squares linear regression, were found to be highly correlated with correlation coefficients (_r_2) >0.70.
Fig. 1.
Functional changes in forced expiratory volume in 1 s (FEV1) and forced vital capacity (FVC) after ozone. Change in spirometric function after exposure to ozone (O3) compared with filtered air (FA). Means ± SE results measured in subjects (n = 138) immediately postexposure (acute) and late time point (1 day post). Change calculated as percent change from pre-exposure value. Open and filled bars are mean (±SE) changes for FEV1 and FVC, respectively, postexposure (acute); striped vertical and striped horizontal bars are mean (±SE) changes for FEV1 and FVC, respectively, at 1 day postexposure time point. Changes in FEV1 and FVC post O3 significantly different than post FA at acute (#P < 0.001) and late 24 h (*P = 0.04) time points.
Table 2.
Acute airway function changes post ozone
| Ethnicity Grouping | FEV1 Change | FVC Change |
|---|---|---|
| (% of PreValue) | (% of PreValue) | |
| African American | − 16.79 | − 12.63 |
| Male (n = 22) | ± 3.04* | ± 2.43† |
| African American | −6.18 | −6.00 |
| Female (n = 24) | ± 1.51 | ± 1.52 |
| Caucasian | −7.94 | −6.00 |
| Male (n = 55) | ± 1.00 | ± 0.67 |
| Caucasian | −8.32 | −7.38 |
| Female (n = 28) | ± 1.36 | ± 1.42 |
| Others | −3.88 | −4.55 |
| Male (n = 6) | ± 1.64 | ± 1.49 |
| Others | −1.33 | −4.17 |
| Female (n = 3) | ± 0.67 | ± 0.44 |
Fig. 2.
Frequency distribution of subjects with change in FEV1 after ozone. Acute FEV1 response, calculated as percent change from pre-exposure value, of subjects (n = 138) exposed to O3. Filled bars represent number of subjects with ≥15% decrease in FEV1.
Fig. 3.
Relationship between change in FEV1, to change in FVC after ozone. A: acute change in FEV1 and FVC, presented as %change from pre-exposure value, are correlated; B: change in FEV1 and FVC at ∼24 h postozone are correlated. For graphs each point represents data for a single subject (n = 138); solid line: data fit to a linear regression with goodness of fit _r_2 = 0.70, P < 0.001.
Sensitivity to Mch challenge.
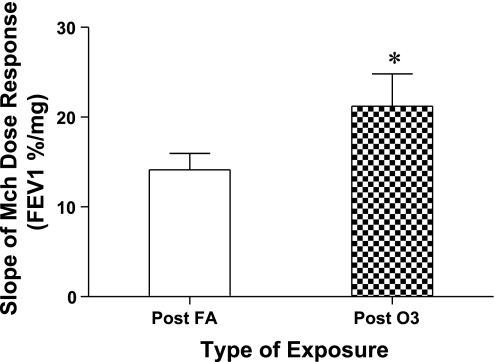
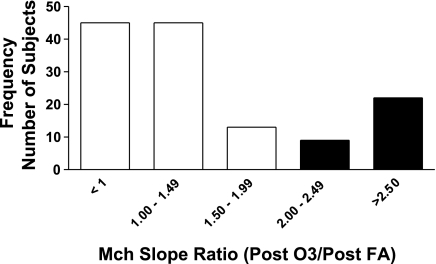
The results for responsiveness to Mch of the subjects are shown in Fig. 4, where the mean values for slopes of the Mch dose-response curves measured at the 1-day post ozone and FA time points are presented for 134 of the subjects (4 subjects who demonstrated extreme sensitivity to Mch in the steepness of their dose-response curves, and based on statistical evaluation were considered outliers to the normal distribution of values, were not included in the analyses for calculation and comparison of mean responses). Mean values for the dose-response slopes (decrease of FEV1 −%/mg Mch) were 14.15%/mg (±1.82 SE) after FA compared with 22.61%/mg (±3.85 SE) after ozone, and this difference was significant, P < 0.003. For each subject the value of the Mch dose-response slope after O3 was divided by the slope after FA; this ratio was used to generate a frequency response histogram shown in Fig. 5 and demonstrates the distribution of O3-responsive subjects. For example, the subjects with a ratio value that was ≥2, i.e., a doubling of the slope of the dose-response curve after ozone compared with FA, were considered to be responders, i.e., susceptible to O3-induced airway hyperresponsiveness. Overall, of the 134 subjects evaluated, after ozone 31 subjects (23.1%) had changes in sensitivity to Mch at or above this threshold (equal to or more than a doubling of the slope of the Mch dose-response curve). Mean values for the slope of the Mch dose-response curve were similar between ethnic and/or sex comparisons, and significant differences were not observed between groupings (data not shown).
Fig. 4.
Ozone induced changes on sensitivity to methacholine (Mch) bronchoprovocation. Bars represent means ± SE for value of the slope of methacholine dose-response curves of subjects (n = 134) measured ∼24 h postexposure to FA and O3. Slope calculated as percent change in FEV1 per mg of Mch aerosol delivered (*P < 0.004).
Fig. 5.
Frequency distribution of subjects with change in Mch sensitivity after ozone. Slope of Mch dose-response curves were measured at ∼24 h postexposure to FA and O3. Data presented as ratio of Mch slope after O3 to Mch slope after FA (O3 slope/FA slope). Filled bars represent number of subjects with slope ratios ≥2 (doubling of the slope in response to O3).
Radioisotopic measures of epithelial permeability.
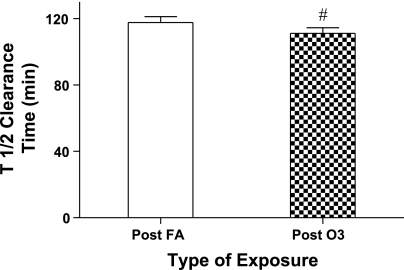
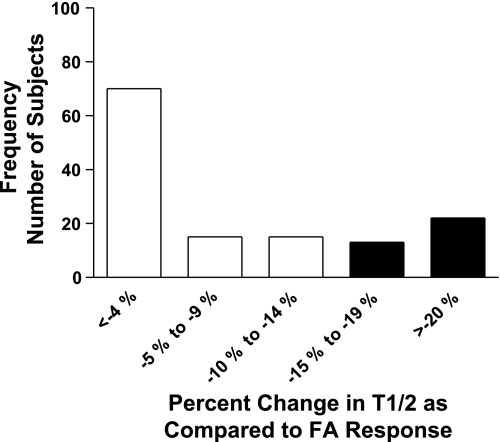
The clearance rate of hydrophilic 99mTc-DTPA radiomarker from the lung's epithelial surfaces at 20 h postexposure was also observed to be enhanced (more permeable epithelial surface) by exposure to O3. Mean results for T1/2 clearance times (time for 50% of the initial radioisotopic lung burden deposited to be cleared from the lung) are presented in Fig. 6, and although the difference in the mean values for clearance between FA and O3 were small, by paired analysis the values differed significantly, with a smaller mean value for T1/2 after ozone, i.e., a faster clearance rate. However, mean permeability (T1/2) responses to ozone between ethnicity or sex groupings were not found to differ significantly. Similar to the divergence in sensitivity to ozone for the functional indices of FEV1 and slope of Mch dose-response curve, epithelial permeability was also observed to separate subjects into responder and nonresponder categories. A frequency response histogram for permeability is presented in Fig. 7 and demonstrates the range of O3-induced changes in the T1/2 clearance index. Three of the 138 subjects entered into the protocol were not evaluated with the radioisotopic technique for personal or technical reasons. A threshold change representing an equal or greater than 15% decrease in the T1/2 for 99mTc-DTPA after O3 compared with the corresponding T1/2 of the subject after FA was used to classify a subject as an ozone responder. Thirty-five (25.9%) of the 135 subjects evaluated met or exceeded this threshold.
Fig. 6.
Change in epithelial integrity to 99mTc-DTPA. T1/2 is clearance half-time in min of the hydrophilic radiomarker 99mTc-DTPA (see methods for calculation). Bars represent means ± SE values of T1/2 as measured in subjects (n = 135) at ∼24 h postexposure to FA and O3 (#P < 0.004).
Fig. 7.
Frequency distribution of subjects with change in epithelial permeability after ozone. T1/2 assessed in subjects (n = 135) at ∼24 h postexposure to FA and O3. Data presented as ratio of ozone clearance time to FA clearance time (T1/2 − O3/T1/2 −FA). Filled bars represent numbers of subjects with ≥15% change in T1/2 clearance value after O3 compared with after FA.
Interaction of response elements.
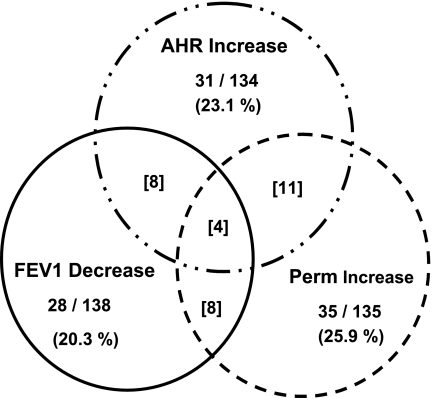
Consistent with earlier controlled laboratory studies and exposure to O3 (22), atopic status was not found to be influential for altering sensitivity to ozone for any of the three endpoints that were measured. With respect to interaction between endpoints, some overlap was found for those subjects who demonstrated an O3-induced increase in sensitivity to Mch, as well as a loss of epithelial membrane integrity, but this appeared to be a random occurrence. Also the intensity of a given responder's sensitivity to O3 did not appear to be related for these two response elements; for example, the responders who demonstrated the largest ozone-induced decreases in the T1/2 clearance time, did not demonstrate an equally severe change in the slope of the Mch dose-response curve. We also analyzed for an interaction between epithelial integrity and/or Mch sensitivity with ozone-induced changes in FEV1 for those subjects who met or exceeded the threshold for an acute change (decrement of 15% or greater in FEV1). Likewise a direct relationship was not found between acute changes in FEV1 and either of the other two response elements (epithelial permeability or Mch sensitivity) evaluated at the 20 h time point. Presented in Table 3 are the results of regression analyses to determine if there was an association between ozone-induced changes in epithelial permeability and development of Mch AHR, and there also was an association between the acute changes in FEV1 measured acutely post-ozone and either of the response elements, epithelial permeability or Mch AHR. None of the response elements were shown to demonstrate a linear correlation with either of the other responses (r2 ≤ 0.02, P ≥0.10_)_. Thus each response element appears to be a separable phenotype and independent of each other. A Venn diagram in Fig. 8 graphically demonstrates the independence of the three response elements.
Table 3.
Regression analyses for association between phenotypes
| Sample Size | Relationship | _r_2 | P Value |
|---|---|---|---|
| n = 131 | EP ratio (T1/2 O3/FA) = −0.0171 Mch ratio (O3/FA) +1.00 | 0.0204 | 0.103 |
| n = 134 | Mch ratio (O3/FA) = −0.0115 FEV1 change post O3 + 1.55 | 0.0048 | 0.427 |
| n = 135 | EP ratio (T1/2 O3/FA) = −0.0005 FEV1 change post O3 + 0.96 | 0.0007 | 0.753 |
Fig. 8.
Relationship between subjects classified with responder phenotypes (FEV1, Mch sensitivity, and epithelial permeability) to O3. The percentage of subjects, at or above response thresholds (see methods) to O3 for a specific end point, are indicated in the Venn diagram for each end point element (FEV1, AHR, or Epith Perm). Number in brackets represents the number of subjects classified as O3 responders for two or more of the indicated end points.
DISCUSSION
Our results represent the largest single cohort study to date to evaluate airway and respiratory epithelial responses to ozone in young healthy adult subjects in a controlled laboratory setting. The experimental design of the protocol had a straight forward rationale to determine if two known airway responses that occur temporarily at near identical time points postexposure to ozone, were functionally associated. The concept that an injured and hyper-permeable epithelium facilitates and enables access of agonist stimuli to submucosal tissues is supported by studies in airway diseases of a chronic inflammatory nature, such as asthma where a close relationship has been shown between airway epithelial permeability and airway hyperresponsiveness (26, 48). Although it was not an initial goal, the sample size of our study population (n = 138) permitted us with confidence to strengthen prevailing dogma that similar to spirometric changes induced by ozone wherein subjects exhibit low to high responsiveness (4, 49), a dichotomous range in subject susceptibility to ozone is likewise demonstrated for AHR and epithelial permeability phenotypes.
Our current findings confirm and expand on our prior results on the potential for exposure to O3 to impair epithelial integrity and to increase nonspecific bronchial airway hyperresponsiveness to Mch (14, 17). Furthermore we demonstrate in the present investigation that these responses to O3 do not occur uniformly across all subjects, and we identified the presence of both resistant and ozone-sensitive subjects. Moreover, and although it is an attractive hypothesis that desquamation and epithelial injury may lead to heightened airways responsiveness, our results do not support a direct relationship between O3-induced changes in epithelial integrity and the development of airway responsiveness to Mch. These findings were unexpected as we had initially hypothesized that ozone-induced impairment of integrity would lead to an increased permeability of hydrophilic molecules, such as Mch, and contribute to and/or correlate with a change in absorption or availability and increase airway responsiveness to Mch.
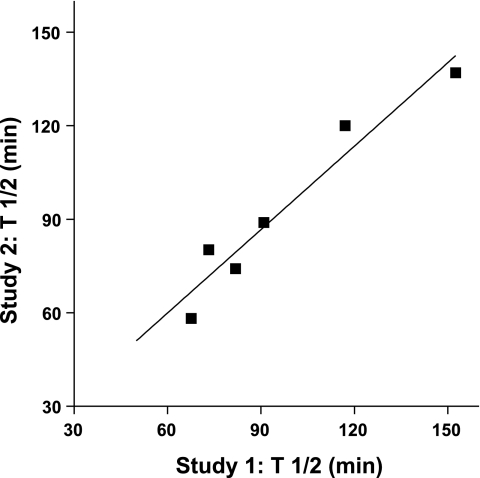
The overlap among given individual subjects to present as a responder for one, two, or even three response elements (FEV1, epithelial permeability, and airway hyperresponsiveness) within the cohort was limited, as demonstrated in Fig. 8, and thus overall each response element appears to be an independent response. Given the relatively complex physiologies surrounding each of these functional and epithelial responses, this suggests that more than a single host factor is likely responsible for modulating susceptibility to O3. Individual airway responses to ozone, for example the FEV1 and/or AHR, have been shown by us and others to be highly repeatable if the subject is restudied under identical exposure conditions (13, 14, 34). Thus these response elements demonstrate high levels of reproducibility for periods of time that may extend over a period of at least 12 mo. With respect to epithelial integrity and inherent sensitivity to ozone within a given subject, the T1/2 values for a subset of the present subjects evaluated on two separate study days with ozone are presented in Fig. 9. Similar to FEV1 and AHR responses to ozone, at least for healthy subjects, ozone-induced changes in epithelial permeability appear constant and reproducible. We have interpreted this to indicate that each of these response elements (FEV1, AHR, and epithelial integrity) are indeed valid physiological phenotypes to characterize airway vulnerability to ozone, and as shown by us and others, sensitivity to ozone is relatively constant over time in young healthy adults.
Fig. 9.
Repeatability of sensitivity of epithelial permeability to O3. Subjects (n = 6) exposed to O3 on 2 separate study days with measurement of lung clearance of 99mTc-DTPA at 1 day postexposure. Data points are the T1/2 values calculated for a single subject with value on day 1 plotted as a function of value on day 2; solid line: data fit to a linear regression with goodness of fit, _r_2 = 0.93, P < 0.002.
Increased ambient levels of O3 have been found to be associated with adverse health effects in both healthy individuals and “sensitive” groups, including asthmatics (32, 33, 39). Furthermore laboratory studies have shown only subsets of normal individuals, estimated at 30 to 50% of the population, experience measurable adverse effects after O3, including even just short-term exposures to O3 levels of ∼0.10 to 0.20 ppm (EPA 8 h standard for “moderate” exposure is 0.065 to 0.084 ppm; 3, 9, 34). This has led to the supposition that host genetic factors are likely contributing to differences in O3 sensitivity (11, 33). Our present evaluations and results in healthy adult-aged subjects parallels the responses observed and reported for ambient exposures (7, 28). In a prior study that was limited to young adult Caucasian subjects, we did not observe sex to be influential to ozone sensitivity (49). However, in the present study we found the African American male subjects had robust spirometric responses to ozone in the acute post-ozone period demonstrated by FEV1 decrements significantly exceeding changes observed in the African American women and Caucasian men. For the other phenotypic responses to ozone, epithelial permeability and Mch sensitivity, sensitivity to ozone was independent of either ethnicity or sex effects. Our results for decreases in FEV1 after ozone in African American males are consistent with an earlier study in which reductions in FEV1 after ozone also tended to be more severe in African American men (42). Others have also demonstrated that O3-induced decrements in FEV1 are not predicted nor associated with the degree of Mch responsiveness, for example at baseline (2). Based upon recent investigations in humans, the acute, ozone-induced inhibition of the ability to inspire that leads to a decrement in FVC is proposed to be reflex in origin and results from afferent vagal stimulation mediated by bronchial C-fibers in the smaller distal and peripheral airways (37, 40). We demonstrated previously that FRC and/or thoracic gas volume (Vtg) do not change following exposure to ozone (16, 18), and thus a decrease in FVC would be expected to limit elastic recoil and contribute mechanically to a reduction in FEV1. Therefore acutely after ozone exposure, the impairment in pulmonary function and significant association between spirometric FVC and FEV1 variables (Fig. 3_A_), was not a surprising finding. However, after 20 h of recovery and a much milder stage of airflow obstruction, a close relationship for these two variables is sustained and is a unique observation (Fig. 3_B_). Correlation of these variables at the later time point is not likely a result of residual reflex afferent stimulation and may reflect delayed mucosal inflammation and tissue edema formation leading to changes in viscoelastic properties and mild airflow obstruction (10).
Previously, we clearly demonstrated that airways may become hyperresponsive at ∼20 h postexposure to O3, compared with exposure to FA. A difference in our present approach is that we used FEV1 index to gauge development of AHR, whereas previously we relied on airway conductance (sGaw) acquired by body plethysmography (14). Thus, in the earlier study, Mch sensitivity was more representative of changes in large airway caliber, and in the present study, the changes in airflow conductivity would be applicable to Mch sensitivity of both large and smaller lung airways. A mechanism for the increase in responsiveness has not been established, although as shown by us and others, respectively, neither ozone-induced decrements in spirometric function (14) nor inflammation (monitored by inflammatory cell influx and cytokine profiles of bronchoalveolar lavage fluids)(4) correlate with airway responsiveness. Human bronchial airways evaluated ex vivo respond to oxidative stimuli with hyperreactivity, although this response was disassociated with epithelial permeability (25). There is a suggestion that a component of the O3-induced responsiveness in vivo is vagally mediated since premedication with a cholinergic antagonist reverses the development of responsiveness acutely at a point immediately postexposure (5). Neuronal and reflex activity have been proposed, and in a recent animal model study we demonstrated that at 20 h postozone the release of neuroendocrine peptides in airway tissues leads to the development of AHR (51). An additional model study (20) supports the postulate that prejunctional muscarinic M2 receptors (auto-receptors that normally function to limit neurotransmitter release and ablate reflex-induced AHR) on the efferent postganglionic parasympathetic nerves that innervate the airway are impaired by inflammatory cell infiltration postozone (20).
We found the subjects to be differentially susceptible to O3-induced changes in epithelial integrity. This is consistent with invasive techniques and collection of bronchoalveolar lavage and localized anesthesia where the presence of increased vascular proteins such as serum albumin and cellular markers of inflammation within epithelial surface fluids procured from small airway and alveolar units also are suggestive that epithelial permeability changes do not occur uniformly, and rather subsets of responder and non-responding subjects are observed (4). Although exercise is a physiological factor known to lead to increases in lung clearance of 99mTc-DTPA, epithelial permeability changes are recognized to occur acutely and within 30 min of the end of an exercise period (35). Due to the time difference (we assessed epithelial integrity at 1-day after treadmill activity periods), and the reduced level of physical activity of our protocol design (treadmill walking, rather than maximal exercise levels), it is unlikely that exercise and intermittent increases in MV during the activity periods of the exposure were influential to our observations. Additionally, the levels of activity and MV were by design at equivalent levels during FA and O3 exposures. There is no obvious mechanism to explain O3-induced changes in permeability, although reactive oxygen metabolites generated at the interface of O3 with the respiratory epithelium and interaction with cellular tight-junction proteins is an attractive one (10, 52). With respect to longevity of a more permeable epithelium, we established previously in a relevant animal model that a single local (intrabronchial) exposure to O3 increases trans-epithelial clearance; however, this occurred only in epithelia directly exposed and after which 7–14 days of recovery were required before transference kinetics of small-molecular weight solutes returned to normal (15).
In summary, our experimental design demonstrated that epithelial membrane and airway functional responses to ozone in both African American and Caucasian subgroups occur with a dichotomous pattern of low and high sensitivities. Similar to our earlier study (49) we confirmed in a more substantial sample size of subjects that following exposure of short duration to an ambient concentration level of ozone, spirometric changes from baseline develop and can range between little to no change, to decreases of 15% or greater. The consideration that a 15% or greater fall in the FEV1 can be applied as a threshold for sensitivity to ozone is consistent with, and supported by, regulatory guidelines to define adverse health effects from urban air pollutants (1). Our observation pointing to greater sensitivity to ozone by men of self-reported African American ancestry with respect to changes in FEV1 supports a prior suggestion of susceptibility due to interaction between elements of sex, race, and O3 concentration (42) and will require additional study to determine if stimulation of irritant airway C-fibers occurs differentially among racial groupings. Our results also confirmed earlier reports of a close relationship at end-exposure to ozone between changes in FEV1 and FVC, and we made the additional observation that without full recovery and return to normal pulmonary function, a correlation between these variables is persistent out to later time points, 20–24 h postexposure. Finally, we clearly have shown that ozone-induced development of airway hyperresponsiveness and loss of epithelial integrity are independent responses, not correlated, and dissociated from each other. Furthermore we demonstrated that thresholds for vulnerability to ozone exist at time points at least 1 day postexposure, and the susceptibility to develop AHR and/or increases in epithelial permeability is induced at significant levels (23–24%) within young adult-aged, healthy subjects.
GRANTS
This research was supported by National Institutes of Health awards ES-16347 (to W. M. Foster) and AI-81672 (to W. M. Foster and J. S. Sundy).
ACKNOWLEDGMENTS
The authors are grateful for vision, support, and advice during the initial development of the project from D. A. Schwarz (present address: School of Medicine, Univ. of Colorado, Denver, CO).
REFERENCES
- 1.American Thoracic Society Committee of the Assembly on Environmental, and Occupational Health. What constitutes an adverse health effect of air pollution? Am J Respir Crit Care Med 161: 665–73, 2000 [DOI] [PubMed] [Google Scholar]
- 2.Aris RM, Tager I, Christian D, Kelly T, Balmes JR. Methacholine responsiveness is not associated with O3-induced decreases in FEV1. Chest 107: 621–628, 1995 [DOI] [PubMed] [Google Scholar]
- 3.Arjomandi M, Witten A, Abbritti E, Reintjes K, Schmidlin I, Zhai W, Solomon C, Balmes J. Repeated exposure to ozone increases alveolar macrophage recruitment into asthmatic airways. Am J Respir Crit Care Med 172: 427–432, 2005 [DOI] [PMC free article] [PubMed] [Google Scholar]
- 4.Balmes JR, Chen LL, Scannnel C, Tager I, Christian D, Hearne PQ, Kelly T, Aris RM. Ozone-induced decrements in FEV1 and FVC do not correlate with measures of inflammation. Am J Respir Crit Care Med 153: 904–909, 1996 [DOI] [PubMed] [Google Scholar]
- 5.Beckett WS, McDonnell WF, Horstman DH, House DE. Role of the parasympathetic nervous system in acute lung response to ozone. J Appl Physiol 59: 1879–1885, 1985 [DOI] [PubMed] [Google Scholar]
- 6.Billinghurst MW. Chromatographic quality control of 99mTc-labeled compounds. J Nucl Med 14: 793–797, 1973 [PubMed] [Google Scholar]
- 7.Boezen M, Schouten J, Rijcken B, Vonk J, Gerritsen J, van der Zee S, Hoek G, Brunedreef B, Postma D. Peak expiratory flow variability, bronchial responsiveness, and susceptibility to ambient air pollution in adults. Am J Respir Crit Care Med 158: 1848–1854, 1998 [DOI] [PubMed] [Google Scholar]
- 8.Bosson J, Barath S, Pourazar J, Behndig AF, Sandstrom T, Blomberg A, Adelroth E. Diesel exhaust exposure enhances the ozone-induced airway inflammation in healthy humans. Eur Respir J 31: 1234–1240, 2008 [DOI] [PubMed] [Google Scholar]
- 9.Corradi M, Alinovi R, Goldoni M, Vettori MV, Folesani G, Mozzoni P, Cavassini S, Bergamaschi E, Mutti A. Biomarkers of oxidative stress after controlled human exposure to ozone. Toxicol Lett 134: 219–225, 2002 [DOI] [PubMed] [Google Scholar]
- 10.Devlin RB, McDonnell WF, Becker S, Madden MC, McGee MP, Perez R, Hatch G, House DE, Koren HS. Time-dependent changes of inflammatory mediators in the lungs of humans exposed to 0.4 ppm ozone for 3 hr: a comparison of mediators found in bronchoalvoelar lavage fluid 1 and 18 h after exposure. Toxicol Appl Pharmacol 138: 176–185, 1996 [DOI] [PubMed] [Google Scholar]
- 11.Drazen JM, Beier DR. Genetics of air pollution. Nat Genet 17: 365–366, 1997 [DOI] [PubMed] [Google Scholar]
- 12.Eggleston PA, Buckley TJ, Breysse PN, Wills-Karp M, Kleeberger SR, Jaakkola JJ. Environment and asthma in US inner cities. Environ Health Perspect 107, Suppl 3: 439–450, 1999 [DOI] [PMC free article] [PubMed] [Google Scholar]
- 13.Folinsbee LJ, Horstman DH, Kehrl HR, Harder S, Abdul-Salaam S, Ives PJ. Respiratory responses to repeated prolonged exposure to 0.12 ppm ozone. Am J Respir Crit Care Med 149: 98–105, 1994 [DOI] [PubMed] [Google Scholar]
- 14.Foster WM, Brown R, Macri K, Mitchell CS. Bronchial reactivity of healthy subjects: 18–20 h postexposure to ozone. J Appl Physiol 89: 1804–1810, 2000 [DOI] [PubMed] [Google Scholar]
- 15.Foster WM, Freed AN. Regional clearance of solute from peripheral airway epithelia: recovery after sublobar exposure to ozone. J Appl Physiol 86: 641–646, 1999 [DOI] [PubMed] [Google Scholar]
- 16.Foster WM, Silver JA, Groth ML. Exposure to ozone alters function and particle dosimetry in the human lung. J Appl Physiol 75: 1938–1945, 1993 [DOI] [PubMed] [Google Scholar]
- 17.Foster WM, Stetkiewicz P. Regional clearance of solute from the respiratory epithelia 18–20 h postexposure to ozone. J Appl Physiol 81: 1143–1149, 1996 [DOI] [PubMed] [Google Scholar]
- 18.Foster WM, Stetkiewicz PA, Freed AN. Retention of soluble 99mTc-DTPA in the human lung: 24-h postdeposition. J Appl Physiol 82: 1378–1382, 1997 [DOI] [PubMed] [Google Scholar]
- 19.Foster WM, Wills-Karp M, Tankersley CG, Chen X, Paquette NC. Bloodborne markers in humans during multi-day exposure to ozone. J Appl Physiol 81: 794–800, 1996 [DOI] [PubMed] [Google Scholar]
- 20.Gambone LM, Ebon CL, Fryer AD. Ozone-induced loss of neuronal M2 muscarinic receptor function is prevented by cyclophosphamide. J Appl Physiol 81: 794–800, 1996 [DOI] [PubMed] [Google Scholar]
- 21.Holz O, Jorres RA, Timm P, Mucke M, Richter K, Koschyk S, Magnussen H. Ozone-induced airway inflammatory changes differ between individuals and are reproducible. Am J Respir Crit Care Med 159: 776–784, 1999 [DOI] [PubMed] [Google Scholar]
- 22.Holtzman MJ, Cunningham JH, Sheller JR, Irsigler GB, Nadel JA, Boushey HA. Effect of ozone on bronchial reactivity in atopic and nonatopic subjects. Am Rev Respir Dis 120: 1059–1067, 1979 [DOI] [PubMed] [Google Scholar]
- 23.Horstman DH, Folinsbee LJ, Ives PJ, Abdul-Salaam S, McDonnell WF. Ozone concentration and pulmonary response relationships for 6.6 h-hour exposures with five hours of moderate exercise to 008, 010, and 012 ppm. Am Rev Respir Dis 142: 1158–1163, 1990 [DOI] [PubMed] [Google Scholar]
- 24.Hu SC, Ben-Jebria Ultman JS. Longitudinal distribution of ozone absorption in the lung: effects of respiratory flow. J Appl Physiol 77: 574–583, 1994 [DOI] [PubMed] [Google Scholar]
- 25.Hulsmann AR, Raatgeep HR, Den Hollander JC, Stijnen T, Saxema PR, Kerrebijn KF, De Jongste JC. Oxidative epithelial damage produces hyperresponsiveness of human peripheral airways. Am J Respir Crit Care Med 149: 519–525, 1994 [DOI] [PubMed] [Google Scholar]
- 26.Illowite JS, Bennett WD, Sheetz MS, Groth ML, Nierman DM. Permeability of the bronchial mucosa to 99mTc-DTPA in asthma. Am Rev Respir Dis 139: 1139–1143, 1989 [DOI] [PubMed] [Google Scholar]
- 27.Jones JG, Royston D, Minty BD. Changes in alveolar-capillary barrier function in animals and humans. Am Rev Respir Dis 127: S51–59, 1983 [PubMed] [Google Scholar]
- 28.Kinney PL, Nilsen DM, Lippmann M, Brescia M, Gordon T, McGovern T, El Fawal H, Devlin RB, Rom WN. Biomarkers of lung inflammation in recreational joggers exposed to ozone. Am J Respir Crit Care Med 154: 1430–1435, 1996 [DOI] [PubMed] [Google Scholar]
- 29.Koren HS, Devlin RB, Graham DE, Mannn R, McGee MP, Horstman DH, Kozumbo WJ, Becker S, House DE, McDonnell WF, Bromberg PA. Ozone-induced inflammation in the lower airways of human subjects. Am Rev Respir Dis 139: 401–415, 1989 [DOI] [PubMed] [Google Scholar]
- 30.Leikauf GD, Zhao Q, Zhou S, Santrock J. Activation of eicosanoid metabolism in human airway epithelial cells by ozonolysis products of membrane fatty acids. Health Effects Institute, Report #71: 1–26, 1995 [PubMed] [Google Scholar]
- 31.Linn WS, Avol EL, Shamoo DA, Peng RC, Valencia LM, Little DE, Hackney JD. Repeated laboratory ozone exposures of volunteer Los Angeles residents: an apparent seasonal variation in response. Toxicol Ind Health 4: 505–520, 1988 [DOI] [PubMed] [Google Scholar]
- 32.Maynard R. Key airborne pollutants—impact on health. Sci Total Environ 334–335: 9–13, 2004 [DOI] [PubMed] [Google Scholar]
- 33.McCunney RJ. Asthma, genes, and air pollution. J Occup Environ Med 47: 1285–1291, 2005 [DOI] [PubMed] [Google Scholar]
- 34.McDonnell WF, Horstman DH, Abdul-Salaam S, House DE. Reproducibility of individual responses to ozone exposure. Am Rev Respir Dis 131: 36–40, 1985 [DOI] [PubMed] [Google Scholar]
- 35.Meignan M, Rosso J, Leveau J, Katz A, Cinotti L, Madelaine G, Galle P. Exercise increases lung clearance of inhaled technetium-99m DTPA. J Nucl Med 27: 274–280, 1986 [PubMed] [Google Scholar]
- 36.O'Connor G, Sparrow D, Taylor D, Segal M, Weiss S. Analysis of dose-response curves to methacholine: an approach suitable for population studies. Am Rev Respir Dis 136: 1412–1417, 1987 [DOI] [PubMed] [Google Scholar]
- 37.Passannante AN, Hazucha MJ, Bromberg PA, Seal E, Folinsbee L, Koch G. Nociceptive mechanisms modulate ozone-induced human lung function decrements. J Appl Physiol 85: 1863–1870, 1998 [DOI] [PubMed] [Google Scholar]
- 38.Pryor WA, Squadrito GL, Friedman M. The cascade mechanism to explain ozone toxicity: the role of lipid ozonation products. Free Radic Biol Med 19: 935–941, 1995 [DOI] [PubMed] [Google Scholar]
- 39.Romieu I, Menesses F, Ruiz S, Huerta J, Sienra JJ, White M, Etzel R, Hernandez M. Effects of intermittent ozone exposure on peak expiratory flow and respiratory symptoms among asthmatic children in Mexico City. Arch Environ Health 52: 368–376, 1997 [DOI] [PubMed] [Google Scholar]
- 40.Schelegle ES, Eldridge MW, Cross CE, Walby WF, Adams WC. Differential effects of airway anesthesia on ozone-induced pulmonary responses in human subjects. Am J Respir Crit Care Med 163: 1121–1127, 2001 [DOI] [PubMed] [Google Scholar]
- 41.Schwartz J, Schindler C, Zemp E, Perruchoud AP, Zellweger JP, Wuthrich B, Leuenberger P, Ackermann-Liebrich U. Predictors of methacholine responsivneness in a general population. Chest 122: 812–820, 2002 [DOI] [PubMed] [Google Scholar]
- 42.Seal E, McDonnell WF, House DE, Salaam SA, Dewitt PJ, Butler SO, Green J, Raggio L. The pulmonary response of white and black adults to six concentrations of ozone. Am Rev Respir Dis 147: 804–810, 1993 [DOI] [PubMed] [Google Scholar]
- 43.Seltzer J, Bigby BG, Stulbarg M, Holtzman MJ, Nadel JA, Ueki IF, Leikauf GD, Goetzl EJ, Boushey HA. O3-induced change in bronchial reactivity to methacholine and airway inflammation in humans. J Appl Physiol 60: 1321–1326, 1986 [DOI] [PubMed] [Google Scholar]
- 44.Sexton KG, Jeffries HE, Jang M, Kamens RM, Doyle M, Voivu I. Photochemical products in urban mixtures enhance inflammatory responses in lung cells. Inhal Toxicol 16, Suppl 1: 107–114, 2004 [DOI] [PubMed] [Google Scholar]
- 45.Tashkin DP, Altose MD, Bleecker ER, Connett JE, Kanner RE, Lee WW, Wise R. The lung health study: airway responsiveness to inhaled methacholine in smokers with mild to moderate airflow limitation. Am Rev Respir Dis 145: 301–310, 1992 [DOI] [PubMed] [Google Scholar]
- 46.Taylor RG, Agnew JE, Francis RA, Pavia D, Clarke SW. Respiratory epithelial permeability is unrelated to bronchial reactivity and small airway function in young smokers and nonsmokers. Eur Respir J 1: 319–323, 1988 [PubMed] [Google Scholar]
- 47.Teisanu RM, Chen H, Matsumoto K, McQualter JL, Potts Foster WME, Bertoncello I, Stripp BR. Functional analysis of two distinct bronchiolar progenitors during lung injury and repair. Am J Respir Crit Care Med 44: 794–803, 2011 [DOI] [PMC free article] [PubMed] [Google Scholar]
- 48.Van de Graaf EA, Out TA, Roos CM, Jansen HM. Respiratory membrane permeability and bronchial hyperreactivity in patients with stable asthma. Effects of therapy with inhaled steroids. Am Rev Respir Dis 143: 362–368, 1991 [DOI] [PubMed] [Google Scholar]
- 49.Weinmann GC, WSeidenbach-Gerbase M, Foster Wm Zacur H, Frank R. Evidence for ozone-induced small-airway dysfunction: lack of menstrual-cycle and gender effects. Am J Respir Crit Care Med 152: 988–996, 1995 [DOI] [PubMed] [Google Scholar]
- 50.Wilson AM, Salloway JC, Wake CP, Kelly T. Air pollution and the demand for hospital services: a review. Environ Int 30: 1109–1118, 2004 [DOI] [PubMed] [Google Scholar]
- 51.Zhou S, Potts EN, Cuttitta F, Foster WM, Sunday ME. Gastrin-releasing peptide blockade as a broad-spectrum anti-inflammatory therapy for asthma. Proc Natl Acad Sci USA 108: 2100–2105, 2011 [DOI] [PMC free article] [PubMed] [Google Scholar] [Retracted]
- 52.Yamaya M, Sekizawa K, Masuda T, Morkawa M, Sawai T, Sasaki H. Oxidants affect permeability and repair of the cultured human tracheal epithelium. Am J Physiol Lung Cell Mol Physiol 268: L284–L293, 1995 [DOI] [PubMed] [Google Scholar]
