T cell repertoire scanning is promoted by dynamic dendritic cell behavior and random T cell motility in the lymph node (original) (raw)
Abstract
Dendritic cells (DCs) ingest antigens in peripheral tissues and migrate to lymph nodes where they present MHC class II-bound antigen to CD4+ T cells. We used two-photon microscopy to image the single-cell dynamics of interactions between DCs and T cells within intact lymph nodes in the absence of relevant antigen. DCs were fluorescently labeled in vivo by cutaneous injection of alum adjuvant including carboxyfluorescein diacetate succinimidyl ester (CFSE). CFSE-positive DCs (CD11c+, CD11b+, and low-to-intermediate CD8+) were observed in draining lymph nodes 24–72 h later. Labeled DCs meandered slowly (2–3 μm·min–1) in the T cell zone near B cell follicles but vigorously extended long agile dendrites. Encounters between T cells and DCs arose as T cells moved autonomously along random paths. Moreover, T cells did not accumulate around DCs, and their relative velocities approaching and departing DCs were equivalent, implying that T cells are not attracted toward DCs by chemotactic gradients but rather encounter them by chance. T cell/DC contacts occurred primarily on dendrites at arm's length from the DC soma and typically lasted ≈3 min, enabling an individual DC to interact with up to 5,000 T cells per hour. We conclude that dynamic DC gesticulation and random T cell motility together enhance the stochastic scanning of the T cell repertoire, thereby enabling rapid initiation of the immune response.
Keywords: two-photon microscopy, T lymphocyte
The initiation of an immune response requires that dendritic cells (DCs) physically contact antigen-specific T cells within the complex environment of the lymph node. Although DCs are remarkably efficient in evoking T cell responses with few antigen–MHC complexes (1–100 per DC) (1–3), they must first encounter a T cell with appropriate antigen specificity (one in 105 to 106). This presents a “needle-in-a-haystack” problem, in that DCs must rapidly scan a large portion of the T cell repertoire to establish rare cognate interactions. The mechanisms by which this is accomplished are poorly understood. For example, chemotaxis has been proposed to guide T cells toward DCs, thereby increasing the likelihood of productive interactions (4–6). However, naïve CD4+ T cells exhibit random migration in vivo, suggesting that antigen recognition may arise instead through a stochastic mechanism (7, 8).
Two-photon microscopy now makes it possible to resolve the behaviors of individual cells within native tissues of the immune system (9, 10). We directly imaged the interactions between DCs and CD4+ T cells in lymph-node explants by using a previously undescribed in vivo technique to fluorescently label DCs that would naturally respond during infection and immunization. This experimental approach paves the way to subsequent investigation of antigen-dependent cognate interactions. Here, we describe the single-cell dynamics underlying T cell repertoire scanning by DCs in the absence of cognate antigen.
Materials and Methods
Transgenic T Cells, B Cells, and Recipient Mice. T cells (2–8 million) specific for chicken ovalbumin (Ova) isolated from DO11.10 transgenic mice (The Jackson Laboratory) by magnetic negative selection using the CD4+ T cell isolation kit (Miltenyi Biotec, Auburn, CA) were labeled with 5-(and-6)-(((4-chloromethyl) benzol)amino)tetramethyl-rhodamine (CMTMR) (Molecular Probes) at 8 μM for 45 min at 37°C and adoptively transferred by tail-vein injection into 4- to 6-week-old BALB/c recipient mice. B cells were isolated from the spleens of C57 BL6 mice by magnetic separation with anti-CD43 microbeads (Miltenyi Biotec), labeled with CMTMR as above, and 10 million cells injected i.v. into C57 BL6 mice.
Adjuvant System and in Vivo Labeling of Endogenous DC. Mice were injected with Alum (1.3% suspension, Accurate Chemicals), containing 2 μg of recombinant murine tumor necrosis factor-α (R & D Systems), 5 μg of recombinant murine Flt-3 ligand (R & D Systems), and 15–25 μg of carboxyfluorescein diacetate succinimidyl ester (CFSE) (Molecular Probes) to fluorescently label endogenous DCs. Flt-3 ligand was chosen as an immunomodulator because of its demonstrated efficacy in vaccine studies with both mice and humans (11). The cytokines included in the adjuvant system increased the number of labeled DCs within the draining lymph node. Injections were performed under methoxyflurane (Metafane, Schering-Plough) anesthesia and given s.c. at the scruff of the neck (60 μl) and intradermally (20 μl) in the ear 12–72 h before imaging. The in vivo labeling procedure worked equally well in BALB/c or C57 BL6 animals. To assess antigen uptake by DCs, we included Ova-Alexa Fluor 555 (Molecular Probes) in the above adjuvant system. The presence of fluorescent Ova in CFSE+ cells was confirmed by using two-photon microscopy in draining lymph nodes, and the percentage of Ova-positive CFSE+ cells was assessed by flow cytometry.
Fluorescence-Activated Cell Sorter Analysis. CFSE+ cells were analyzed by flow cytometry (MoFlo, Cytomation, or FACSCalibur, BD Pharmingen) for expression of DC markers by gating on large cells (pulse-width characteristics or forward scatter) and using allophycocyanin-conjugated antibodies to CD11c, CD11b, and CD8a (BD Pharmingen). The presence of fluorescent Ova was analyzed in experiments that included Ova-Alexa Fluor 555 in the adjuvant injection mixture. Gates for CFSE detection were set based on controls with no CFSE added to the injection mixture. Gates for antibody staining or fluorescent Ova were set based on controls with unlabeled cells.
Two-Photon Imaging and Analysis. Cervical lymph nodes were removed after killing, maintained at 36°C under superfused medium bubbled with 95% O2/5% CO2, and imaged by multidimensional (x, y, z, time, emission wavelength) two-photon microscopy, as described (9). Image acquisition, morphometric analysis, and cell tracking were performed by using metamorph software (Universal Imaging, Media, PA). 3D information was encoded by assigning the colors red, green, and blue to overlapping segments (top, middle, and bottom) of monochrome _z_-stacks, resulting in a “top-view” projection with a five-color spectrum, each color representing a 15-μm section within the imaging volume (7). The surface areas of T cell/DC contacts were estimated by assuming circular geometry for small contacts, spherical geometry for large (>25% of the T cell surface) contacts, and measuring the length of membrane apposition in two-photon sections. Multidimensional rendering was performed by using imaris (Bitplane, St. Paul, MN).
Results
In Vivo Labeling of Endogenous DCs. Previous studies that have imaged T cell/DC interactions in the lymph node used adoptively transferred _in vitro_-derived DCs isolated from lymphoid organs or differentiated from bone marrow in culture (12, 13). However, there are concerns that such DCs may be altered in morphology, function, or differentiation, and that the in vitro step of antigen priming could lead to a nonphysiological level of peptide loading as compared to an immunization or natural infection. We therefore developed a technique to label endogenous DCs in vivo at a cutaneous injection site, by including the vital dye CFSE (14, 15) in the adjuvant mixture. Our rationale was that DCs would become fluorescently labeled in the skin by CFSE from the alum depot and, over the natural course of their maturation, would subsequently migrate to the lymph node. An important further point is that CFSE becomes fluorescent only after it enters into cells, where it is trapped after reacting with protein. DCs would therefore be effectively pulse-labeled, because free CFSE around the injection site would persist for only a short time (<2 h) before becoming complexed with intracellular and extracellular proteins in the skin.
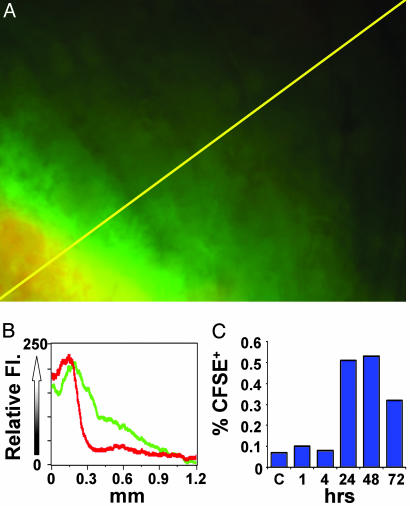
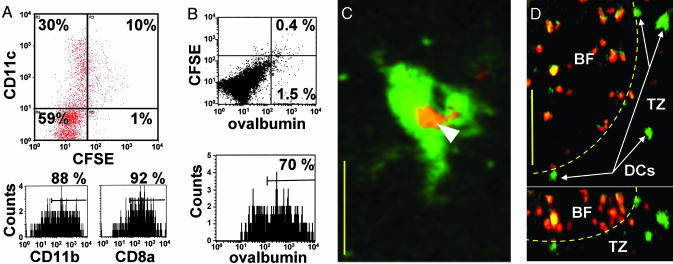
To verify that this technique indeed labeled DCs that normally carry antigen to the lymph node, we included both CFSE and fluorescently labeled Ova (Ova-Alexa Fluor 555) in the immunization mixture. At the site of injection, a ring of green CFSE fluorescence extended throughout and slightly (<1 mm) beyond the adjuvant depot at 1.5 h, indicating that the dye had reacted, whereas the red Ova remained confined to the alum depot (Fig. 1 A and B). The brightly labeled CFSE+ cells in draining lymph nodes were analyzed by flow cytometry at varying times after s.c. injection (Fig. 1_C_). Labeled cells were not found inside the lymph node within 4 h after injection, implying that unreacted CFSE did not directly label resident cells. A population of large CFSE-labeled cells (≈0.5% of all cells) was observed at 24 h and began to decline in number by 72 h. Further characterization by antibody staining revealed that the majority of large CFSE+ cells in the lymph node were CD11c+, CD11b+ and had low to intermediate CD8a+ expression (Fig. 2_A_), consistent with the phenotype of Langerhans-derived or migratory dermal DCs (16). Between 24 and 72 h, these CFSE+ cells comprised 10–30% of all CD11c+ DCs in lymph nodes. Moreover, flow cytometry showed that ≈70% of large CFSE+ cells present in lymph nodes contained detectable amounts of fluorescent Ova (Fig. 2_B_). Thus, our in vivo approach labels a physiologically relevant population of endogenous DCs that would traffic to the lymph node bearing antigen after vaccination or cutaneous infection.
Fig. 1.
CFSE labeling at the depot and subsequent trafficking of labeled cells to draining lymph nodes. (A) Imaging the alum depot 1.5 h after intradermal ear injection of adjuvant mixture containing CFSE and fluorescent Ova. Yellow scan line represents 1.26 mm. (B) Distribution of CFSE (green) and fluorescent Ova (red) along the line-scan near the edge of the adjuvant depot in skin. (C) The kinetics of CFSE+ cell trafficking to the lymph node. Draining cervical lymph nodes were harvested at varying times after adjuvant/CFSE injection and evaluated for CFSE+ cells by flow cytometry.
Fig. 2.
Characterization and localization of _in vivo_-labeled DCs in draining lymph nodes. (A) Surface expression of CD11c, CD11b, and CD8a on CFSE+ cells. CD8a staining was on average 4-fold lower than on CD8+ T cells. (B) Fluorescence-activated cell sorter analysis of cells isolated from lymph node 24 h after injection of adjuvant containing CFSE and fluorescent Ova. (Upper) Shown is the rare population (≈0.4% of total cells) that contains both CFSE and fluorescent Ova. (Lower) Histogram showing the percentage of CFSE+ cells that contain fluorescent Ova. (C) Two-photon image of a DC in a draining lymph node showing ingested fluorescent Ova (arrow) 24 h after injection of adjuvant containing CFSE and fluorescent Ova. (Bar = 15 μm.) (D) Image showing localization of CFSE+ DC in the T cell zone (TZ) near a B cell follicle (BF) in top (left) and side (right) views. (Bar = 50 μm.) Dotted line indicates approximate follicle boundary.
Imaging Endogenous DCs in Explanted Lymph Nodes. We used two-photon microscopy to characterize the size, distribution, and behavior of labeled cells within the lymph node 24–72 h after s.c. injection of adjuvant. When included in the adjuvant mixture, fluorescent Ova was later detected inside CFSE+ DCs within the lymph node (Fig. 2_C_). Most of the labeled cells were large and had the characteristic appearance expected for DCs. We sometimes observed other CFSE+ cells within the lymph node. However, these cells were less abundant and easily distinguished from DCs based on size and other morphological features. Typically, DCs were located at depths >120 μm beneath the capsule and congregated in small groups in the T cell areas adjacent to and below B cell follicles (Fig. 2_D_).
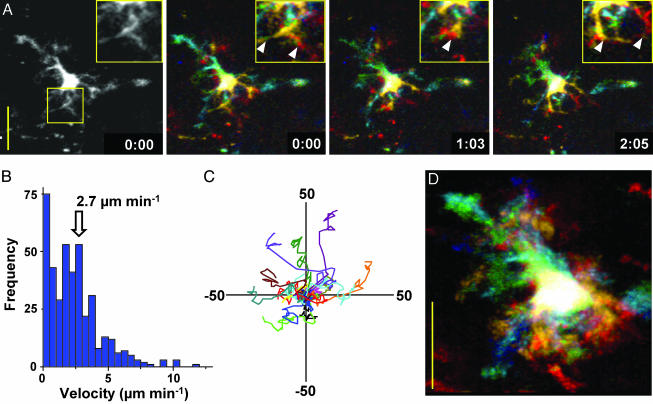
After s.c. injection of adjuvant containing CFSE and cytokines, but without Ova, we examined the motility and dynamic changes in morphology of individual DCs. Rapid motion of dendritic processes was evident in 3D time-lapse images (Fig. 3_A_; see Movie 1, which is published as supporting information on the PNAS web site). Individual DCs migrated slowly (Fig. 3_B_, mean velocity = 2–3 μm·min–1) relative to T cells (>10 μm·min–1) (7, 9) and appeared to follow random tracks (Fig. 3_C_, n = 16). The surface area of DCs measured from serial two-photon sections ranged from 1,800 to 2,400 μm2, consistent with areas derived from membrane capacitance measurements on DCs in vitro (17). Typically, more than two-thirds of the total volume of a DC was deployed as dendrites, radiating on average 19 μm (SE = 0.58, n = 161) and in some cases >60 μm away from the soma of the cell. The dendrites increased the surface area to volume ratio of DCs >3-fold as compared with a spherical cell of the same volume. In contrast to the slow overall motility of DCs, their dendrites were strikingly agile, continually probing and sweeping through the T cell area with measured peak velocities up to 40 μm·min–1. This dendritic gesticulation substantially increased the effective “swept volume” that represents the territory covered by an individual DC, as illustrated by superimposed images in Fig. 3_D_. DCs displayed this dynamic morphology and behavior for as long as 60 h after labeling and migration to the node, but then began to turn over (18). By 72 h, many CFSE+ DCs had migrated closer to the capsule and lost both their elaborate morphology and motility. In some cases, only CFSE-labeled cell debris remained.
Fig. 3.
Dynamics of DC movement. (A) High-resolution monochrome and depth-encoded _z_-projections of a DC, illustrating elaborate dendrite morphology shown at indicated times (min:sec); note rapid changes in dendritic morphology (see also Movie 1). (Insets) Shown are enlarged views of a selected region. (Bar = 25 μm.) Arrowheads mark individual dendrites. (B) Histogram of instantaneous DC velocities (mean = 2.7 μm·min–1) derived by tracking the center of fluorescence of 15 DCs. (C) Tracks of 15 DCs in the x, y plane normalized to their starting positions. (D) Superimposed images of a single DC, depth-encoded, to illustrate the swept volume over a 12-min period.
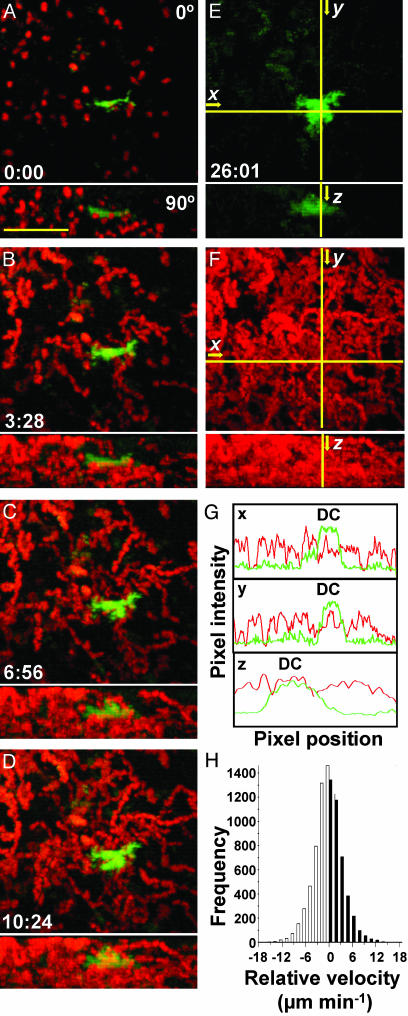
T Cells Encounter DCs Along Random Trajectories. To study interactions between T cells and endogenous DCs, we adoptively transferred (5-(and-6)-(((4-chloromethyl)benzol)amino)tetramethylrhodamine)-labeled (red) T cells into mice 24 h after in vivo labeling of DCs and then isolated lymph nodes for imaging 2–18 h later. If chemokine gradients recruit T cells to DCs, we expect that T cells would accumulate near DCs and move faster on average toward a DC than away from it. In comparison, T cells followed random trajectories with respect to DCs (Fig. 4 A–F; see Movie 2, which is published as supporting information on the PNAS web site), without an increase in T cell density near DCs (Fig. 4_G_). The concentration profiles indicate that T cell fluorescence is evenly distributed, providing no evidence that T cells congregate near unlabeled DC. Moreover, the distribution of vectorial velocities toward and away from DCs was symmetrical (Fig. 4_H_), similar to control measurements with respect to random points in the imaging field (data not shown).
Fig. 4.
T cells approach DCs along random trajectories. (A–D) Cumulative fluorescence images of T cells (red) and DC (green) at indicated times during recording (min:sec). (Bar = 50 μm.) Frames present top (Upper) and side (Lower) views as maximum intensity projections of each orthogonal view across sequential time-lapse sequences (see also Movie 2). (E and F) Color separation of frames to illustrate the area covered by the DC (green) and the even dispersion of T cell tracks (red). (G) Profiles of green and red fluorescence intensity along the x, y, and z axes, marked by crosshairs in E and F showing that T cell density (red trace) does not increase near the DC (green trace). (H) Histogram of T cell velocities (n = 8,700) along vectors normal to DCs, showing an equal distribution of negative and positive velocities.
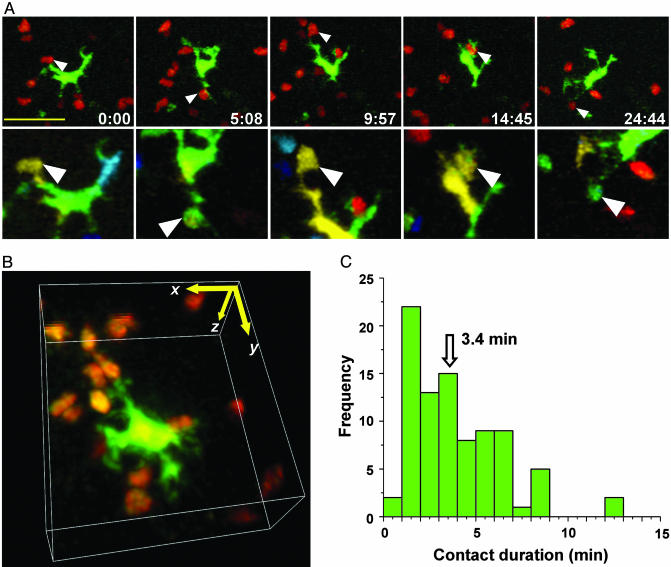
Brief Dendrite/T Cell Interactions Permit Rapid Scanning. To analyze T cell/DC interactions in four dimensions, we color-encoded cells according to their depth in the lymph node (7). This approach allowed us to distinguish true contacts from instances in which T cells and DCs colocalized in the _x_-y plane but were in fact separated in the z dimension (Fig. 5_A_). Examples of contacts can also be seen in 3D time-lapse videos (Fig. 5_B_; see Movies 3–5, which are published as supporting information on the PNAS web site). Encounters occurred primarily on dendrites a considerable distance (17 μm) from the DC center of mass. Moreover, these contacts were dynamic, changing rapidly in size over tens of seconds. The average surface area in the contact region was 8 μm2 but ranged from more than one-half (>70 μm2) of the T cell's total surface to as little as 1 μm2. The median contact duration between DCs and T cells was 3.4 min (Fig. 5_C_). This brief interaction time represents the period during which T cells have the opportunity to sample peptide–MHC complexes. We counted the number of contacts between labeled T cells and DC in nine experiments in which the fraction of labeled T cells was also determined by flow cytometry (Table 1, which is published as supporting information on the PNAS web site). Based on the measured contact frequency and the fraction of labeled T cells, an estimated scanning rate for an individual DC of 4,630 ± 670 contacts per hour was obtained.
Fig. 5.
T cell/DC contact morphology and duration. (A) Time-lapse image sequence (times indicated min:sec) illustrating brief contacts between T cells and a DC in the absence of antigen. (Bar = 25 μm.) Top frames are true color (red, T cells; green, DC) projections along the z axis. Frames below are depth-encoded enlarged views of the same images (see also Movie 3). Multiple discrete contacts are indicated (arrows) where the DCs (green) and T cells (red) colocalize in the x-y plane and occupy the same _z_-position (display the same color) as seen in the pseudocolored image. (B) Contacts between T cells and DCs, rendered in three dimensions (see Movies 4 and 5). Contacts between T cells and DC were dynamic, changing rapidly in size over tens of seconds. Detailed morphometric analysis of several contacts: The average surface area in the contact region was 7.8 μm2 (SE = 2.0, n = 32), ranging from more than one-half (>70 μm2) of the T cell's total surface to as little as 1 μm2. Contacts took place an average of 16.8 μm (SE = 1.1 μm, n = 26) from the DC center of mass. (C) Histogram of T cell/DC contact durations (89 contacts: median duration = 3.4 min).
Discussion
Two-photon imaging of intact lymphoid tissue provides crucial insight into the dynamics of individual T cells and B cells in native living tissues (8, 10). The in vivo labeling procedure described here allowed us to capture a high-definition view of live DC morphology in situ and to examine T cell/DC interactions in real time. Our experiments were designed to mimic inflammatory conditions that would be present during infection or vaccination but may not apply to steady-state interactions between T cells and DC. Inclusion of CFSE in the adjuvant depot pulse-labels a subset of DCs in draining nodes that appear to be Langerhans-derived DCs and dermal DCs originating from skin, based on CD11c and CD11b expression (16), characteristic morphology (19), and localization in T cell areas adjacent to and beneath follicles in fixed lymph nodes (20, 21). These CFSE+ DCs are similar to a recently described second wave of trafficking DCs, although DCs were CD8a negative in that study (22). After cutaneous challenge, CFSE+ DCs carried fluorescent Ova from the injection site to draining lymph nodes. As such, these DCs represent a relevant population that would likely present antigen after an immunization or natural infection.
As shown most vividly in Movies 1–5, DCs vigorously extend and sweep their dendrites in all directions and are clearly active partners in initiating and terminating contacts with T cells. Encounters occur preferentially on dendritic processes many microns from the DC body, thereby increasing the surface area of DC membrane available for interaction and minimizing steric hindrance among T cells. Although the characteristic dendrites of DCs have long been observed in fixed tissue sections (19, 23), in situ time-lapse imaging reveals the strikingly dynamic aspect of this morphology. Because multiple dendrites extend from the DC body and move several times faster than T cells, DCs can survey a large percentage of T cells in their vicinity. The estimated scanning rate (Table 1) implies that a DC can contact ≈5,000 T cells per hour, much greater than the corresponding number (500) reported for contacts between CD8+ T cells and _in vitro_-derived DCs (13). The disparity might reflect a difference between _in vivo_-labeled DC compared to isolated peptide-pulsed DC or a difference between CD4+ and CD8+ cells. However, it is also possible that the difference is methodological, in that the image resolution in the study by Bousso and Robey (13) was insufficient to resolve fine dendrites and associated T cell contacts. For a DC to make 5,000 contacts per hour, each lasting ≈3 min, each DC would be in contact with ≈250 T cells at any instant. This number is close to the limit of available surface area on DCs. We estimate the DC surface area to be ≈2,400 μm2, and the mean contact area with a T cell to be ≈8 μm2, thereby restricting the maximum number of simultaneous T cell contacts to ≈300. A single DC will thus turn over ≈80 fresh contacts per minute, at a rate limited primarily by contact duration. As an example of scanning efficiency, assuming that a node contains 100 antigen-bearing DCs, this rate would give a 95% probability of contacting an antigen-specific T cell present at a frequency of 1 in 106 within ≈6 h. This simple calculation assumes an even distribution of T cells that can each be sampled more than once and verifies that a stochastic scanning mechanism is compatible with the kinetics of immune response initiation in vivo. Recently, DCs have been observed to localize near sites of T cell homing at high endothelial venales (21), which could increase the efficiency of stochastic scanning because DC would be more likely to encounter newly arrived T cells than resident T cells that may have already been scanned. Rapid scanning is likely critical during the early stages of a natural infection, when only a small fraction of DCs may present a relevant antigen.
In addition to DC dynamics, rapid T cell migration plays an important role in the efficient scanning of the T cell repertoire. Our analysis of T cell migration with respect to DCs demonstrated that the initial encounter between a naïve T cells and a DC is a stochastic event resulting from a random walk and is not guided by a simple chemotactic process. In the absence of a specific antigen, these chance encounters lead to interactions that last only a few minutes before T cells resume their autonomous migration pattern and leave DCs free to interact with other T cells. Such noncognate interactions may constitute an antigen-independent presynapse, proposed to play a role in long-term T cell survival (24). If T cell/DC interactions were orchestrated by chemokine gradients, T cells with irrelevant specificity would quickly surround DCs, and scanning efficiency would be inhibited. Instead, each naïve T cell appears to function as an autonomous agent, migrating randomly within the T cell area of the lymph node.
Our imaging results lead to two key conclusions regarding the cellular dynamics of antigen presentation to naïve CD4+ T cells in lymph nodes. (i) DCs are active participants in soliciting T cell interactions. By vigorously deploying a net of fine dendritic processes to increase their available surface area and effective swept volume, DCs are able to efficiently scan the T cell repertoire. (ii) T cells approach DCs along random trajectories, without any apparent directed motion toward DCs, as would be expected if they were guided by a classical chemotactic mechanism. Even though T cell motions are random, stochastic encounters allow efficient scanning of the T cell repertoire. The rate-limiting step, instead, appears to be the turnover of T cells as they sample the DC surface for cognate antigen. Collectively, the behavior of T cells and DCs emerges as an efficient search strategy to identify foreign antigen and to assure that T cell responses are rapidly initiated during the early stages of infection.
Supplementary Material
Supporting Information
Acknowledgments
We thank Dr. Luette Forrest for outstanding veterinary support and Dr. Stephen Hou for flow cytometry expertise. We thank Jason Cyster and Taka Okada for stimulating scientific discussions and K. George Chandy for thoughtful comments on the manuscript. This work was supported by Grants GM-41514 (to M.D.C.) and GM-48071 (to I.P.) from the National Institutes of Health.
This paper was submitted directly (Track II) to the PNAS office.
Abbreviations: CFSE, carboxyfluorescein diacetate succinimidyl ester; DC, dendritic cell; Ova, ovalbumin.
References
- 1.Demotz, S., Grey, H. M. & Sette, A. (1990) Science 249**,** 1028–1030. [DOI] [PubMed] [Google Scholar]
- 2.Harding, C. V. & Unanue, E. R. (1990) Nature 346**,** 574–576. [DOI] [PubMed] [Google Scholar]
- 3.Irvine, D. J., Purbhoo, M. A., Krogsgaard, M. & Davis, M. M. (2002) Nature 419**,** 845–849. [DOI] [PubMed] [Google Scholar]
- 4.Ngo, V. N., Tang, H. L. & Cyster, J. G. (1998) J. Exp. Med. 188**,** 181–191. [DOI] [PMC free article] [PubMed] [Google Scholar]
- 5.von Andrian, U. H. & Mackay, C. R. (2000) N. Engl. J. Med. 343**,** 1020–1034. [DOI] [PubMed] [Google Scholar]
- 6.Mackay, C. R. (2001) Nat. Immunol. 2**,** 95–101. [DOI] [PubMed] [Google Scholar]
- 7.Miller, M. J., Wei, S. H., Cahalan, M. D. & Parker, I. (2003) Proc. Natl. Acad. Sci. USA 100**,** 2604–2609. [DOI] [PMC free article] [PubMed] [Google Scholar]
- 8.Cahalan, M. D., Parker, I., Wei, S. H. & Miller, M. J. (2003) Curr. Opin. Immunol. 15**,** 372–377. [DOI] [PMC free article] [PubMed] [Google Scholar]
- 9.Miller, M. J., Wei, S. H., Parker, I. & Cahalan, M. D. (2002) Science 296**,** 1869–1873. [DOI] [PubMed] [Google Scholar]
- 10.Cahalan, M. D., Parker, I., Wei, S. H. & Miller, M. J. (2002) Nat. Rev. Immunol. 2**,** 872–880. [DOI] [PMC free article] [PubMed] [Google Scholar]
- 11.Dong, J., McPherson, C. M. & Stambrook, P. J. (2002) Cancer Biol. Ther. 1**,** 486–489. [DOI] [PubMed] [Google Scholar]
- 12.Stoll, S., Delon, J., Brotz, T. M. & Germain, R. N. (2002) Science 296**,** 1873–1876. [DOI] [PubMed] [Google Scholar]
- 13.Bousso, P. & Robey, E. (2003) Nat. Immunol. 4**,** 579–585. [DOI] [PubMed] [Google Scholar]
- 14.Weston, S. A. & Parish, C. R. (1990) J. Immunol. Methods 133**,** 87–97. [DOI] [PubMed] [Google Scholar]
- 15.Lyons, A. B. & Parish, C. R. (1994) J. Immunol. Methods 171**,** 131–137. [DOI] [PubMed] [Google Scholar]
- 16.Itano, A. A. & Jenkins, M. K. (2003) Nat. Immunol. 4**,** 733–739. [DOI] [PubMed] [Google Scholar]
- 17.Hsu, S., O'Connell, P. J., Klyachko, V. A., Badminton, M. N., Thomson, A. W., Jackson, M. B., Clapham, D. E. & Ahern, G. P. (2001) J. Immunol. 166**,** 6126–6133. [DOI] [PubMed] [Google Scholar]
- 18.Kamath, A. T., Henri, S., Battye, F., Tough, D. F. & Shortman, K. (2002) Blood 100**,** 1734–1741. [PubMed] [Google Scholar]
- 19.Steinman, R. M. & Cohn, Z. A. (1973) J. Exp. Med. 137**,** 1142–1162. [DOI] [PMC free article] [PubMed] [Google Scholar]
- 20.Ingulli, E., Ulman, D. R., Lucido, M. M. & Jenkins, M. K. (2002) J. Immunol. 169**,** 2247–2252. [DOI] [PubMed] [Google Scholar]
- 21.Bajenoff, M., Granjeaud, S. & Guerder, S. (2003) J. Exp. Med. 198**,** 715–724. [DOI] [PMC free article] [PubMed] [Google Scholar]
- 22.Itano, A. A., McSorley, S. J., Reinhardt, R. L., Ehst, B. D., Ingulli, E., Rudensky, A. Y. & Jenkins, M. K. (2003) Immunity 19**,** 47–57. [DOI] [PubMed] [Google Scholar]
- 23.Witmer, M. D. & Steinman, R. M. (1984) Am. J. Anat. 170**,** 465–481. [DOI] [PubMed] [Google Scholar]
- 24.Revy, P., Sospedra, M., Barbour, B. & Trautmann, A. (2001) Nat. Immunol. 2**,** 925–931. [DOI] [PubMed] [Google Scholar]
Associated Data
This section collects any data citations, data availability statements, or supplementary materials included in this article.
Supplementary Materials
Supporting Information
