Annotation of a Serum N-glycan Library for Rapid Identification of Structures (original) (raw)
. Author manuscript; available in PMC: 2013 Mar 2.
Published in final edited form as: J Proteome Res. 2012 Feb 22;11(3):1958–1968. doi: 10.1021/pr2011439
Abstract
Glycosylation is one of the most common post-translational modifications of proteins and has been shown to change with various pathological states including cancer. Global glycan profiling of human serum based on mass spectrometry has already led to several promising markers for diseases. The changes in glycan structure can result in altered monosaccharide composition as well as in the linkages between the monosaccharides. High-throughput glycan structural elucidation is not possible due to the lack of a glycan template to expedite identification. In an effort toward rapid profiling and identification of glycans, we have constructed a library of structures for the serum glycome to aid in the rapid identification of serum glycans. N-Glycans from human serum glycoproteins are used as a standard and compiled into a library with exact structure (composition and linkage), liquid chromatography retention time, and accurate mass. Development of the library relies on highly reproducible nanoLC/MS retention times. Tandem MS and exoglycosidase digestions were used for structural elucidation. The library currently contains over 300 entries with 50 structures completely elucidated and over 60 partially elucidated structures. This database is steadily growing and will be used to rapidly identify glycans in unknown biological samples.
Keywords: N-linked glycan, Glycan structures, Isomers, nano HPLC-Chip TOF MS, on-line detection, retention time, database/library
INTRODUCTION
Glycosylation is one of the most common post-translational modifications in proteins. It has been estimated that over 50% of human proteins are glycosylated1. The glycans serve important structural roles by participating in protein folding, enhancing protein solubility, attaching proteins to cell membranes, protecting proteins from degradation and mediating many important biological functions2–5. Changes in glycosylation have been linked to various pathological states including cancer, atherosclerosis, rheumatoid arthritis, Chron's Disease, and inflammation making them important targets for analysis2, 6–10. Alteration of the glycan structures can take on several forms including different monosaccharide compositions, changes in connectivity (sequence), and most interestingly, changes in the types of linkages between monosaccharides. The ability to monitor these changes quantitatively and specifically can make monitoring of glycosylation a valuable diagnostic tool by providing greater sensitivity and specificity. Indeed, glycomics, the characterization of the glycan constituents of a biological system, is rapidly emerging as a new paradigm for biomarker discovery8, 9, 11–13.
Despite the advancements in glycan analysis, structural elucidation remains a complicated and difficult task. The variation in size, polarity, and linkage configuration can yield a dizzying array of structures. Glycans can vary in size from disaccharide to complex carbohydrates; additionally, each monosaccharide can differ in linkages, potentially forming 1012 distinct structures from as few as six monosaccharides8, 14, 15. Furthermore, there is glycan heterogeneity at the site of covalent attachment to the protein meaning a particular site of glycosylation may have a number of different glycans associated with it (site- or micro-heterogeneity). The result is a collection of `glycoforms' associated with each glycoprotein further complicating the analysis13, 16. Uncovering the glycome has been described as a bigger challenge than the genome or proteome not only because of the many variations among glycans, but also because carbohydrate synthesis is not under direct genetic control resulting in no relationship between their synthesis and the organism's genome17, 18.
High throughput structural elucidation is therefore not likely with current technology. However, rapid structural identification is a possibility if the glycome is finite and not as large as previously estimated. Recent studies from this group developed a theoretical N-glycan library for serum19. Based on this library, it was estimated that there are about 330 distinct compositions in the serum N-glycome. A further study on isomer separation of N-glycans in serum show that there are, on average, about five isomers for each composition20. Given these results, it may be concluded that there could be as few as 1600 distinct structures in the serum N-glycome, and far smaller than the possible chemical combinations.
To this end, several databases and libraries21–24 have been developed to encourage high-throughput glycan identification. Most of these, however, contain structures from previously published studies and are not suitable for specific glycan identification in unknown samples. Glycosuite database contains most of the published N-linked and O-linked glycans including native and recombinant sources, tissues, and cell lines21. Glycan structures are cross-referenced to Swiss-Prot/TrEMBL as well as pubMed when available, unfortunately retention time is not offered. The Consortium for Functional Glycomics provides a database with information containing glycan structures, glycan binding proteins, as well as glycosyl transferases. Their efforts provide an “integrated-systems approach to understanding the structure-function relationship of glycans”22. EUROCarbDB offers databases and bioinformatic tools enabling research groups to upload their data to share with others23. The most pertinent is Glycobase by Rudd and co-workers, which boasts a fully automatable technology platform with more than 350 N-glycan structures including 117 present in the human serum glycome. Here, glycans are 2-aminobenzamide labeled separated by HILIC and annotated/measured with glucose units24, 25 to identify structures.
In this study, we have constructed a serum N-glycome library that allows matching of nanoLC retention times and accurate masses to rapidly identify exact glycan structures. The library facilitates rapid structure identification from unknown samples providing comprehensive analysis of underivatized N-linked human serum glycans. There are currently no databases that focus on fully annotating the human serum N-glycome with retention times and on-line mass spectrometry detection. We chose a porous graphitized carbon (PGC) stationary phase as it provides superior isomer separation and unique retention times for individual isomers26, 27. On-line mass spectrometry detection allows for greater confidence in our glycan assignments. A two-part approach was used to build up the library, consisting of identifying known structures and `de novo' sequencing for unknown compounds. The use of serum glycoprotein standards provided some previously characterized structures. Structures were determined and confirmed through sequential exoglycosidase digestions. Also, knowledge of the N-glycan synthesis and biological pathway allowed for the refinement of some structural assignments. Our library is composed of native glycans found in human serum separated by porous graphitized carbon (PGC) whose structural assignments are supported with MS/MS analysis and exoglycosidase digestions.
MATERIALS and METHODS
Materials and Chemicals
Glycoprotein standards IgG, IgM, Transferrin, alpha-1-acid glycoprotein, alpha-2-macroblobulin, and human serum were obtained from Sigma-Aldrich (St. Louis, MO); alpha-1-antitrypsin, and IgA were obtained from EMD Chemicals (Gibbstown, NJ); alpha-1-antichymotrypsin was obtained from Athens Research and Technology (Athens, GA); and complement component 3 was obtained from Genway Biotech, Inc. (San Diego, CA). Exoglycosidase alpha 2–3 neuraminidase, alpha 1–6 mannosidase, alpha 1–2,3 mannosidase, and beta-N-Acetyl glucosaminidase were obtained from New England Biolabs (Ipswich, MA). All other reagents were of analytical or HPLC grade.
Reduction and Purification
N-linked glycans were released from protein standards using PNGase F obtained from New England Biolabs (Ipswich, MA), with glycoprotein starting material ranging from 100–500μg. The released N-glycans were reduced using sodium borohydride from Sigma-Aldrich (St. Louis, MO) according to the protocol previously reported by our laboratory20. N-glycans were cleaned up via a two-step solid phase extraction (SPE) procedure using C8 cartridges from Suppelco (Bellefonte, PA) and graphitized carbon cartridges from Alltech Associated (Deerfield, Il). C8 cartridges were conditioned with 6mL acetonitrile (ACN) and 6mL nanopure water. The glycan digest was loaded onto the cartridge and the flow-through was collected and loaded on pre-conditioned graphitized carbon cartridges then washed with 6 mL of nanopure water. N-Glycans were eluted in 20% ACN in water (v/v) and 0.05% Trifluoroacetic acid (TFA) in 40% ACN in water (v/v), dried down, then reconstituted in 20 L of nanopure water.
MALDI FT-ICR MS and HPLC-Chip/TOF MS Analysis
Reduced and purified glycans were first analyzed using an IonSpec HiRes MALDI FT-ICR MS (IonSpec, Lake Forest, CA) equipped with a 355nm pulsed Nd:YAG laser and 7.0 Tesla Magnet. The sample was spotted on a stainless steel MALDI plate with equal volume of DHB matrix made up of 0.05mg/mL DHB in 50% ACN in nanopure water as previously described28. Glycans were identified within a 5 ppm accurate mass criterion. The N-glycan samples were analyzed in positive and negative ion modes. Tandem MS via collision-induced dissociation (CID) was then performed for selected peaks.
NanoLC MS analyses were performed using the Agilent 6200 Series HPLC-Chip/TOF MS equipped with a microwell-plate auto sampler, capillary sample loading pump, nano pump, HPLC-Chip Cube interface, and the Agilent 6210 TOF LC/MS. Oligosaccharides were separated using the Agilent HPLC-Chip II comprised of a 40nL enrichment column and a 75 μm × 43mm separation column both packed with graphitized carbon stationary phase. The system consists of a capillary and nanoflow pump both operating with a binary solvent system consisting of A, 0.1% formic acid in 3% ACN in water and B, 0.1% formic acid in 90% ACN in water. Samples were loaded onto the HPLC-Chip at concentrations ranging 0.6–25 g with the capillary pump delivering 0.1% formic acid in 3% ACN in water at 4μL/min with a 2μL sample injection. The nano pump delivered the 45-minute gradient used to separate oligosaccharides with a flow rate of 0.3μL /min. The samples were eluted with the following gradient: 0%B, 0–2.5 minutes; 0 to 16%B, 2.5–20 minutes; 16 to 44%B, 20–30 minutes; 44 to 100%B, 30–35 minutes; and 100%B, 35–45 minutes. This procedure was followed by equilibration at 0%B, 45.01–65 minutes. Data was acquired in positive ion mode and calibrated with internal calibrant ions covering a wide mass range (ESI-TOF Tuning Mix, Agilent Technologies, Santa Clara, CA). Glycans were identified within a 20 ppm accurate mass criteria using the Molecular Feature Extractor algorithm included in the Mass Hunter Qualitative Analysis Software (Version B.03.01, Agilent Technologies). The software identified individual compounds by considering expected charge states based on a predicted isotopic distribution. The deconvoluted glycan mass, retention time (at the maximum compound height), and abundance (in summed ion counts) were extracted.
Separation of N-Glycans with off-line HPLC
N-Glycans were separated off-line with an Agilent Hewlett-Packard Series 1100 HPLC system using a Hypercarb PGC column (Thermoquest, Hypersil Division) with the dimensions 100mm × 2.1 mm. The oligosaccharides were eluted with a solvent system consisting of nanopure water, A, and ACN, B, with a flow rate of 0.250 mL/min. 80 fractions were collected in intervals of 0.5 minutes over the 60-minute gradient, with the last 10 minutes reserved for column reconditioning. The collected fractions were dried and reconstituted in 10uL of nanopure water then analyzed by MALDI FT-ICR.
Exoglycosidase Digestion
To determine the linkage between monosaccharides, exoglycosidase digestions were performed following an established protocol outlined by Zhang, et al29. The buffer was prepared by adding glacial acetic acid to a 0.1M ammonium acetate solution until the pH reached 6.5. Specific enzymes require different pH values and care was taken to ensure that the proper pH values were obtained. Exoglycosidase digestion reactions were optimized according to the enzyme activity and amounts of glycan used. When developing the method, enzyme reactions were tested over various time points to confirm the linkage specificity of the enzyme and to ensure complete digestion. The digestion was carried out in a 37 C water bath with 3μL of buffer, 1μL of sample and 0.5μL of enzyme. Digestion times vary depending on the enzyme as outlined by previous studies29. After each digestion the sample was cleaned using Millipore ZipTip C18 pipette tips (Millipore Corporation, Billerica, MA) to remove the enzyme. Each was then dried down and reconstituted in nanopure water for analysis. For sequential exoglycosidase digestions, after the first digestion, the reaction was checked using MALDI FT-ICR and the next enzyme was added to the solution and the digestion was continued**.**
RESULTS AND DISCUSSION
The glycan library was constructed from the native N-glycans of the most abundant glycoproteins in human serum. The proteins were chosen because they possess predominantly N-glycans that provide good coverage of all N-glycan types including high mannose, complex, and hybrid. Furthermore, many of these proteins have been extensively studied in literature with several glycan structures already elucidated30–32. The known glycan structures were identified and characterized and provided the initial core structures of the library. Glycans were first profiled by MALDI MS and then separated by nanoLC MS. MALDI MS provided a rapid profile of the glycan compositions and their relative glycan abundances for the specific proteins. NanoLC MS was then performed on the same samples to separate the components into individual compounds as well as provide retention times and mass spectra.
Release of glycans from glycoprotein IgM with compositional profile by MALDI MS
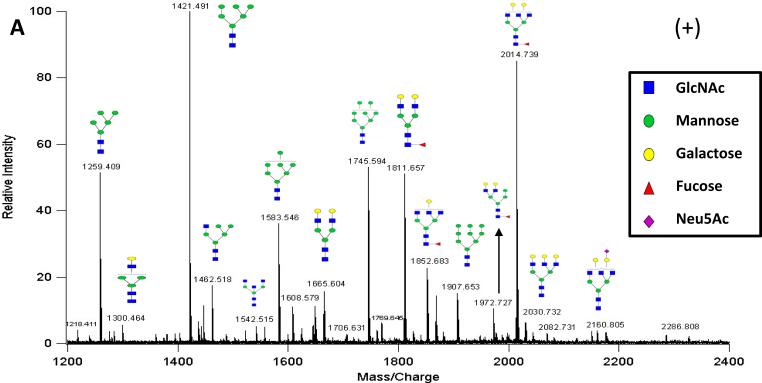
The analysis of glycans from a single protein standard is illustrated with IgM, where the N-Glycans were released using the protocol described in the Experimental Section. MALDI FT-ICR MS was used to obtain a glycan composition profile where sodiated ions were produced. This MALDI MS spectrum provided confirmation that the release was successful and yielded the types of glycans (complex, hybrid, high mannose) associated with each glycoprotein. In addition, the MALDI MS profile provides semi-quantitative information regarding the relative abundances of the released glycans, which proved valuable for subsequent analyses. Figure 1A shows the positive mode MALDI FT-ICR MS profile of the released glycans from the IgM glycoprotein in the 20% ACN SPE fractions. In the spectrum all three types of N-glycans are observed supporting previous analyses of this glycoprotein30. Tandem MS via CID was performed to confirm the composition of the glycans as well as provide information pertaining to the connectivity of the monosaccharides (sequence) allowing for greater confidence in assignments. An example fragmentation profile via CID for the reduced fucosylated neutral oligosaccharide at m/z 1811.6 [M+Na]+ with the composition 5Hexose (Hex), 4N-acetyl hexosamine (HexNAc), 1Fucose (Fuc) is shown in Supplementary Figure 1. The fragmentation profile is consistent with the proposed composition of the glycan based on mass accuracy.
Figure 1A.
MALDI MS N-Glycan Profile of IgM in Positive Ion Mode. This spectrum shows the released N-glycans from the glycoprotein IgM with representation from all three glycan types: high mannose, complex, and hybrid. Sodiated ions are predominately produced. Putative structures are presented based on glycan composition. Blue squares represent N-Acetyl glucosamine, green circles represent mannose, yellow circles represent galactose, purple diamonds represent sialic acid, and red triangles represent fucose.
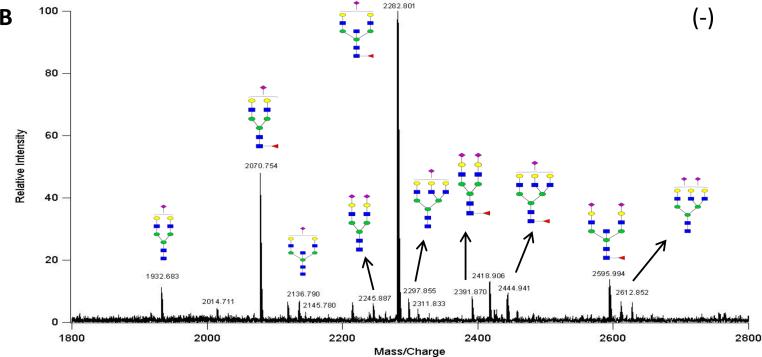
Negative ion mode glycan mass profiles were also obtained by MALDI FT-ICR MS as shown in Figure 1B, which demonstrates an increased detection of anionic oligosaccharides. The negative ion mode is used to detect sialylated glycans from the 40% ACN fraction as sialic acid residues are readily deprotonated, and are not suppressed, as they would be in the positive mode by neutral species33, 34. The abundant peaks are labeled with their putative structures based on compositional assignments employing accurate masses and supported by tandem MS.
Figure 1B.
MALDI MS N-Glycan Profile of IgM in Negative Ion Mode. This spectrum shows the increased detection of sialylated N-glycans from IgM. Deprotonated ions are predominately produced.
NanoLC MS characterization of glycan isomers in IgM
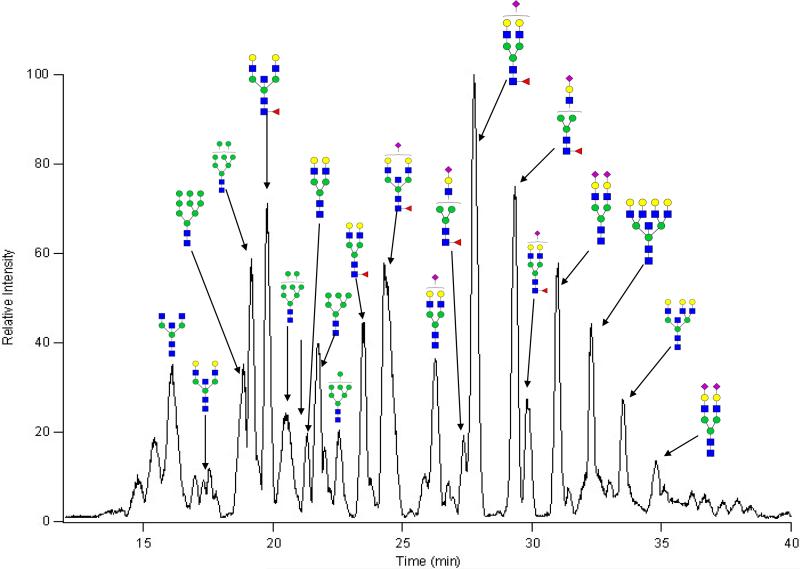
MALDI MS of a mixture of glycans provides a rapid composition profile but provides little to no information regarding the isomers. For nanoLC/MS analysis, the MALDI samples were diluted by nearly five-fold and analyzed via nanoHPLC-Chip/nanoESI/TOF MS (Chip-TOF). Glycans were separated with a PGC stationary phase incorporated into an HPLC-microchip, as described previously20. The chip is found to have high sensitivity, reproducibility, and effective isomer separation35–38. A further consequence of the separation is minimized suppression effects during ionization resulting in new potential compositions not observed with MALDI MS39. The effects of increased sensitivity and decreased suppression effects are observed when comparing the analyses of N-glycans from IgM between MALDI FT-ICR MS and nanoLC/TOF MS. Figure 2 shows the base peak chromatogram of the reduced N-glycans from IgM with the most abundant peaks labeled with their putative structures based on accurate mass. Approximately 30 distinct glycan compositions were identified in the MALDI MS profile from the 20% and the 40% ACN fraction for IgM. For the Chip/TOF MS analysis, the two fractions were combined and analyzed to yield 47 distinct glycan compositions. The additional 17 compositions identified are a result of minimized suppression effects resulting from the nanoLC separation as well as the increased sensitivity of the HPLC-Chip/nanoESI/TOF MS instrument over the MALDI MS analysis. From the nanoLC analysis, 120 compounds are observed due to the detection of isomers associated with each glycan composition. The additional compounds detected include hybrid, fucosylated, and sialylated type glycans.
Figure 2.
Base Peak Chromatogram of Glycans from IgM. NanoLC/MS Chromatogram of N-Glycans from IgM with glycan compositions labeled for the most abundant peaks. Isomer separation allows for the detection of isomers associated with each compound as well as the detection of more compounds due to decreased competition during ionization.
In cases where structures have many isomers, the structural assignment becomes increasingly complicated. Assigning glycan structures is further complicated by the separation of anomers. The reducing end can have the anomeric oxygen in alpha or beta form. Therefore, each compound bears two anomers40, 41. Because separation on PGC is so effective, anomers are separated, potentially doubling the number of peaks. A comprehensive structural assignment is significantly complicated by the presence of anomeric peaks. To eliminate this ambiguity, the reducing ends were reduced using sodium borohydride, which converts the aldehyde to an alditol. Taking the simple example of the composition 4Hex, 4HexNAc, and 1Fuc, having two isomers, Supplementary Figure 2A yields an EIC (extracted ion chromatogram) with four peaks, or two sets of doublets. Reduction of the mixture yields two overlapping peaks as shown in Supplementary Figure 2B. Interestingly, the anomers often resolve more easily than the positional and linkage isomers.
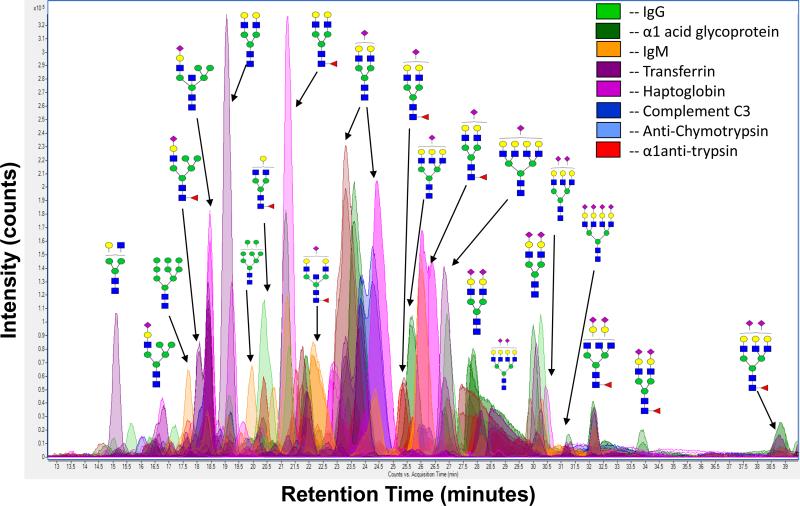
Overlaying nano LC/MS data from all the samples results in a global glycan pool. Shown in Figure 3 is the BPC (base peak chromatogram) overlay of seven chromatograms representing seven different glycoproteins. For simplicity, the BPC from each glycoprotein is represented by its own color with the abundant compositions and putative structures labeled. Many peaks have multiple glycans eluting at the same time. Also, note there are smaller peaks that exist between the major peaks throughout the chromatogram representing the lower abundant species. The TOF MS instruments inherently boast 5 orders in-spectrum dynamic range allowing for the detection of low abundant compounds in the presence of major components. This provides another advantage during the nanoLC MS analysis allowing the detection of the most abundant glycans in the presence of the minor components.
Figure 3.
Global Glycan Pool. Chromatogram overlay of N-glycans from seven glycoproteins where each color represents a different glycoprotein. Abundant compositions from some of the major peaks have been labeled.
Because Figure 3 only labels the most abundant compounds, Supplementary Figures 3A and B zoom in and highlight the lower abundant species. We find that high mannose glycans elute earlier, which is highlighted in Supplementary Figure 3A, followed by complex bi-antennary and hybrid glycans. Finally, acidic glycans and complex type glycans with three or more antennae elute. Supplementary Figure 3B highlights the elution of the larger and anionic glycans, where we observe tri- and tetra-sialylated species. These elution trends are consistent with previous studies in our laboratory20, 26 and in other laboratories42.
Chromatograms can be overlaid to rapidly determine identical structures from different proteins. Due to the high retention time reproducibility as shown previously26, 27, compounds that are highly overlapped and have the same accurate mass are the same structures. Retention times under these rigorous conditions can be reproducible to within 2.0 seconds27. Given this criteria and a similar one for accurate masses, we can determine the structures that are common to different proteins. We find several isomers that are common to the majority of the glycoproteins, and others that are unique to only one. For example, one of the most abundant glycans for all the proteins corresponded to m/z 822.31 [M+2H]+2, 5Hex and 4HexNAc. This glycan composition was found in several isomers with the most abundant isomer corresponding to a retention time of 19.4 minutes ±3.0 seconds. The structure was determined to be the well-known bi-antennary complex type glycan structure and corresponds to entry 48 in Supplementary Table 131.
In any LC/MS analysis, unwanted fragmentation can cause problems by complicating analysis. This problem is more common with oligosaccharides, which fragment more readily than, for example, peptides. While fragmentation has been minimized to less than 5%, but more commonly less than 1%, it may still present a problem when identifying the minor components. To ensure that the proper molecular ions are assigned, EICs of compounds are inspected for larger co-eluting compounds that may be fragmenting to yield the smaller species. A simple test is to examine the mass spectrum at a given time point for any smaller related species that are co-eluting. If these two compounds have identical retention times there is a possibility that the smaller one could be a fragment. This examination helps eliminate false structural assignments due to any in-source fragmentation.
Structure Elucidation with enzymatic reactions
For structure analyses, there are two types of glycans: those with previously characterized structures and those with unknown structures. Glycans with known structures require the identification of a few residues with their linkages to confirm. Unknown structures require de novo characterization of entire structures, although, the entire exercise is facilitated by the conserved structure in the core region. Therefore, even de novo analyses require only a limited number of glycosidase reactions. Furthermore, each product glycan can be tested to determine whether it matches in retention time and accurate mass to a previously identified structure, so that structure elucidation simply requires only one or two exoglycosidases. Additionally, once a structure is characterized, its unique retention time and mass can be used to identify the same structure from other protein sources.
The first step in either process is to isolate the compound of interest through the use of an off-line HPLC system with a porous graphitized column and a fraction collector. Although complete isolation is desirable, it is not necessary if the structures differ in compositions. Because the PGC stationary phase is better at separating isomers than oligomers, compounds that differ in size by one or two residues may prove more difficult to separate than isomers with different linkages. In this case, the mass spectrometry analysis is ideal, as it complements the isomer-specific data obtained through the chromatographic separation. HPLC fractions are first analyzed by MALDI MS to determine the different compositions present in the fraction. This mixture is then analyzed by Chip TOF MS to determine the number of isomers present in the fraction. The mixture is then reacted with specific exoglycosidases monitored by MALDI MS and Chip TOF MS. Similar methods have been published with greater detail from this laboratory28, 43.
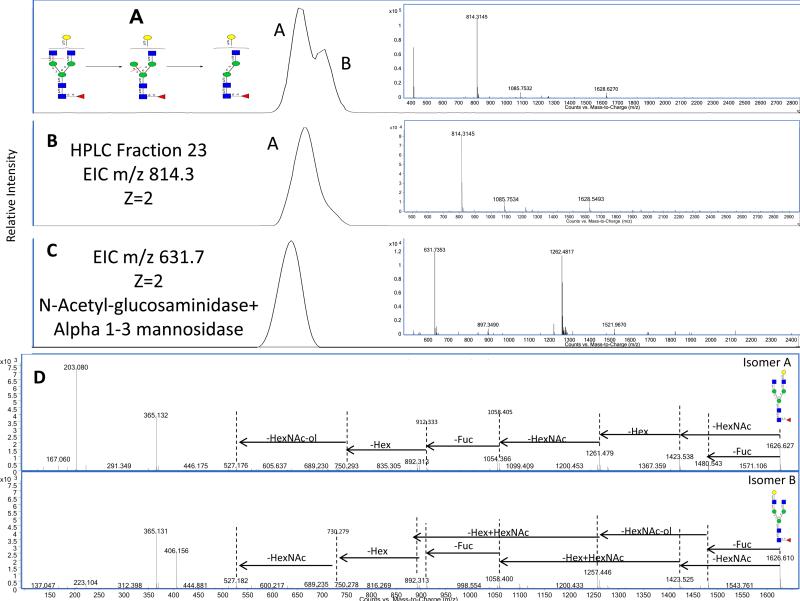
The annotation of a glycan structure using these techniques is shown in the example of m/z 814.29 [M+2H]+2, which corresponds to 4Hex, 4HexNAc, and 1Fuc. Based on the nanoLC MS, this composition consists of two major isomers, which are abundant in IgG and shown in Figure 4A. The putative structure of this composition is bi-antennary with a terminal galactose and a terminal N-Acetylglucosamine. The uncertainty is in the linkage of the galactose and its position on the terminus i.e. the 1–3 or 1–6 antennae. The schematic, inset in Figure 4A, summarizes the exoglycosidase digestion strategy needed to elucidate the structure. The mixture was separated further by HPLC to isolate one compound. Figure 4B shows an EIC of m/z 814.3 [M+2H]+2, obtained from HPLC separation (fraction 23) and analyzed by Chip TOF MS (retention time 21.6 minutes).
Figure 4.
A: Extracted Ion Chromatogram for m/z 814.29 [M+2H]+2 showing two isomers associated with that composition. B: EIC of m/z 814.29 [M+2H]+2 after off-line HPLC fractionation to isolate one isomer. C: EIC of m/z 631.74 [M+2H]+2 after sequential exoglycosidase digestion. Mass spectrum for each chromatogram is inset.
The compound was first treated with a general β-N-acetylglucosaminidase followed by an α 1–3 mannosidase. Figure 4C shows an EIC of m/z 631.7, which correlates to the loss of a HexNAc and Hex, confirming the respective products from these enzymes. The results indicate that the galactose is attached to the α 1–6 antenna and not the α 1–3 antenna. The same compound was also treated with an α 1–6 mannosidase (data not shown). The result showed no mass shift or reaction confirming the results. The corresponding mass spectra are shown. The most abundant ions are those for the doubly charged except for the product in Figure 4C where the singly charged is also abundant. The same experiments were performed on the other isomer on Figure 4A and it was found to be the isomer with the galactose on the 1–3 antenna.
For additional verification the distinct tandem MS for these two positional isomers is shown in Figure 4D. Although the isomer-specific tandem MS profiles appear to be very similar there are significant differences between them. In particular the earlier eluting isomer has a major ion at 203.1 Da representing a free HexNAc monosaccharide. In the spectrum of the later eluting isomer this peak is hardly expressed. Additionally, each isomer has its own preferred fragmentation pathway with different intensities for their monosaccharide losses. For example, the earlier eluting isomer has 1261.4 with higher intensity where the later eluting isomer has 1257.4. The differences in their fragmentation profiles confirm these two compounds as distinct isomers.
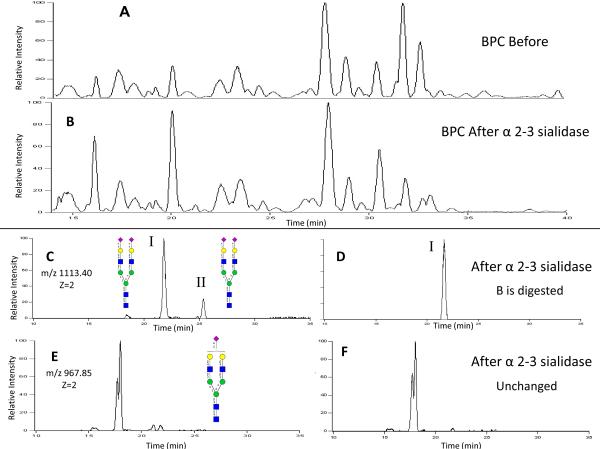
For some of the structures, the enzymes can be applied directly to the glycan mixture to obtain structural information. Figures 5A shows the BPC chromatogram of the glycans released from the protein transferrin. The mixture was treated with α2–3 sialidase, and the resulting base peak chromatogram in Figure 5B, shows peaks that decrease after the reaction. The extracted ion chromatogram shows more clearly the affect of the glycosidase. Figure 5C and D, are the EICs for m/z 1113.40 [M+2H]+2, before and after α2–3 sialidase treatment, respectively. This mass corresponds to the composition 5Hex, 4HexNAc, and 2NeuAc. Figure 5C shows two isomers for the di-sialylated bi-antennary species. Peak labeled I in Figure 5C corresponds to the more abundant species and II is the less abundant species. After digestion with the α2–3 sialidase, peak II disappears while peak I remains untouched. The results indicate that both sialylated residues in I are linked α2–6 while both sialic acid groups in II are α2–3 linked. We are able to conclude this because there is no change in the mono-sialylated EIC after the sialidase digestion. If one sialic acid were left attached we would expect an increase in the mono-sialylated EIC. The reaction mixture also includes the mono-sialylated homolog. Figure 5E and F, show the EIC for m/z 967.85 [M+2H]+2, before and after α2–3 sialidase treatment, respectively. This composition corresponds to 5Hex, 4HexNAc, and 1NeuAc. The EIC shows two isomers that are not fully chromatographically resolved and were identified as bi-antennary mono-sialylated glycans. After treatment with the α2–3 sialidase, there is no change in the abundance of either. This result leads to the conclusion that both isomers have an α2–6 linked sialic acid. Reaction of the mixture with a non-specific sialidase diminishes these two peaks (data not shown).
Figure 5.
A: Base Peak Chromatogram (BPC) of Transferrin N-Glycans before enzyme digestion. B: BPC of Transferrin N-Glycans after alpha 2–3 sialidase digestion. C: EIC of m/z 1113.40 [M+2H]+2 before digestion. D: EIC of m/z 1113.40 [M+2H]+2 after digestion. E: EIC of m/z 967.85 [M+2H]+2 before digestion. F: EIC of m/z 967.36 [M+2H]+2 after digestion.
Application of Library to Rapidly Identify Structures in Unknown Samples
The library is a continual work in progress with an established group of abundant structures that can be identified rapidly. The glycans from the selected group of proteins number in excess of 350 structures. The 200 most abundant are listed in Supplementary Table 1. There are approximately 55 complete structures and over 60 nearly complete with only one or two linkages missing.
To identify a structure in an unknown mixture, the accurate mass and retention times for that compound are used. Tandem MS is also available but would require significant programming, which is outside the scope of this manuscript. Future publications will address identification of glycans using isomer-specific tandem MS.
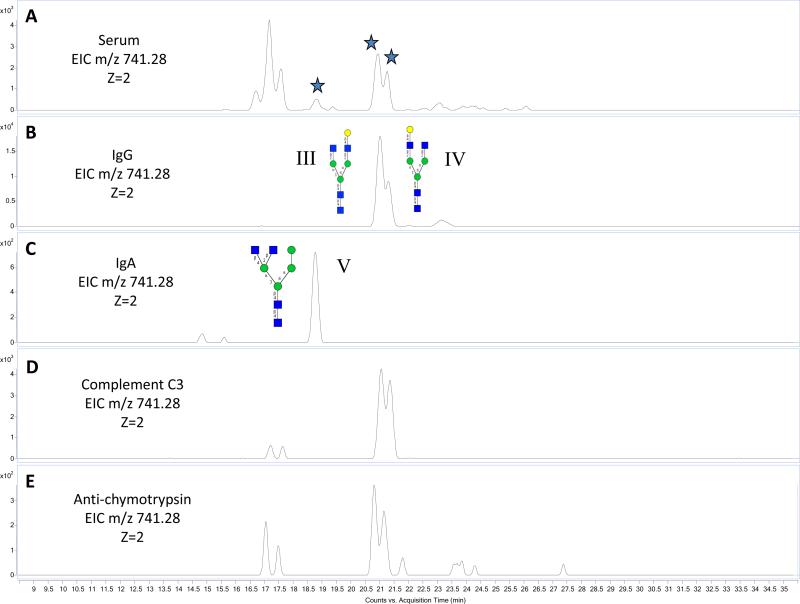
The utility of this library is illustrated with N-glycans released from an unknown serum. Figure 6A shows the EIC of m/z 741.28 (z=2), corresponding to 4 Hex, 4 HexNAc, from human serum with seven major isomers matching this composition. Three isomers are highlighted in Figure 6A (III, IV, and V) that can be identified based on accurate mass and retention time from the structure library. Figure 6B–E shows the EICs for m/z 741.28 [M+2H]+2, from different glycoprotein standards, IgG, IgA, Complement C3, and anti-chymotrypsin, respectively. Based on the accurate mass and the chromatogram retention time, it is observed that V (RT 18.5 min) is found as the most abundant isomer in IgA, but it is not found in any of the other proteins. This structure was determined to be a hybrid type and was validated with tandem MS. The other two compounds (III and IV- RT 20.6 minutes and 21.3 minutes, respectively) are abundant in serum and found in several of the proteins including IgG, Complement C3, and anti-chymotrypsin eluting at 20.6 and 21.3 minutes. These structures were determined via exoglycosidase digestions from previous experiments and can be matched in this unknown sample via their unique retention time and accurate mass. The main isomer from IgA elutes at 18.5 minutes and is not observed in any of the other glycoproteins analyzed. This figure demonstrates the excellent retention time reproducibility across different samples and illustrates how specific glycan structures can be identified over several samples. This example clearly demonstrates the goal of this library, where we use previously characterized glycan structures to accurately identify isomers. This same treatment can be applied on a larger scale to rapidly identify glycan structures based on their accurate mass and unique retention time.
Figure 6.
A_–_E: EICs of m/z 741.28 [M+2H]+2 from different protein sources, serum, IgG, IgA, complement C3, and anti-chymotrypsin.
CONCLUSION
An N-glycan library was developed based on the most abundant proteins in serum. Despite the small number of proteins, a large number of oligosaccharides' structures were obtained. Furthermore, despite the large number of structures there were large structural correlations between the glycans of different proteins. We propose that an extensive library can be readily developed for any biological systems based on a small number of proteins. The library includes glycan structures, accurate masses, unique retention times, and protein sources. The most abundant glycan structures were readily identified based on knowledge of the conserved biological processes and confirmed with tandem MS and exoglycosidase digestions. The lower abundant structures are more difficult to fully elucidate without enrichment. In these cases partial structures are offered in the database. With this library, we are able to quickly identify glycan structures based on their unique retention time and accurate mass. The limitations of full structural elucidation are a function of the difficulty in fully separating and isolating isomers for sequential exoglycosidase mapping and the limited commercial availability of specific exoglycosidases.
Although the nanoLC has been shown to be exceptionally reproducible, to account for any major retention time shifts, a pool of glycan standards can be used to calibrate the system. Because the elution order of isomers will not change, it is possible to simply realign retention times according to their shift. This will enable users to adjust library retention times making this library widely applicable for those with similar LC/MS systems.
This library provides a powerful template for rapid N-glycan structure identification in unknown samples. Our laboratory is employing the library to rapidly identify the most abundant glycan structures in biological samples, including serum, milk, and saliva samples. Any new structures identified are included in the growing database. The library's applicability extends to several fields involving rapid glycan analysis and identification.
Supplementary Material
1_si_001
ACKNOWLEDGEMENTS
Funding provided by National Institute of Health (R01GM049077 and R01HD059127) is gratefully acknowledged.
Footnotes
Supporting Information Available: This material is available free of charge via the Internet at http://pubs.acs.org.
REFERENCES
- 1.Apweiler R, Hermjakob H, Sharon N. On the frequency of protein glycosylation, as deduced from analysis of the SWISS-PROT database. Biochimica et Biophysica Acta (BBA) - General Subjects. 1999;1473(1):4–8. doi: 10.1016/s0304-4165(99)00165-8. [DOI] [PubMed] [Google Scholar]
- 2.Morelle W, Canis K, Chirat F, Faid V, Michalski JC. The use of mass spectrometry for the proteomic analysis of glycosylation. Proteomics. 2006;6(14):3993–4015. doi: 10.1002/pmic.200600129. [DOI] [PubMed] [Google Scholar]
- 3.Dwek RA. Glycobiology: Toward Understanding the Function of Sugars. Chem Rev. 1996;96(2):683–720. doi: 10.1021/cr940283b. [DOI] [PubMed] [Google Scholar]
- 4.Varki A, Cummings R, Esko J, Freeze H, et al. Essentials of Glycobiology. Cold Spring Harbor Laboratory Press: Cold Spring Harbor; New York: 1999. [PubMed] [Google Scholar]
- 5.Ratner DM, Adams EW, Disney MD, Seeberger PH. Tools for Glycomics: Mapping Interactions of Carbohydrates in Biological Systems. ChemBioChem. 2004;5(10):1375–1383. doi: 10.1002/cbic.200400106. [DOI] [PubMed] [Google Scholar]
- 6.Alavi A, Axford JS. Sweet and sour: the impact of sugars on disease. Rheumatology. 2008;47(6):760–770. doi: 10.1093/rheumatology/ken081. [DOI] [PubMed] [Google Scholar]
- 7.Varki A. Sialic acids in human health and disease. Trends in Molecular Medicine. 2008;14(8):351–360. doi: 10.1016/j.molmed.2008.06.002. [DOI] [PMC free article] [PubMed] [Google Scholar]
- 8.Callesen AK, Madsen JS, Vach W, Kruse TA, Mogensen O, Jensen ON. Serum protein profiling by solid phase extraction and mass spectrometry: A future diagnostics tool? Proteomics. 2009;9(6):1428–1441. doi: 10.1002/pmic.200800382. [DOI] [PubMed] [Google Scholar]
- 9.Abbott KL, Aoki K, Lim J-M, Porterfield M, Johnson R, O,ÄôRegan RM, Wells L, Tiemeyer M, Pierce M. Targeted Glycoproteomic Identification of Biomarkers for Human Breast Carcinoma. Journal of Proteome Research. 2008;7(4):1470–1480. doi: 10.1021/pr700792g. [DOI] [PMC free article] [PubMed] [Google Scholar]
- 10.Zhang XL. Roles of Glycans and Glycopeptides in Immune System and Immune-Related Diseases. Current Medicinal Chemistry. 2006;13:1141–1147. doi: 10.2174/092986706776360897. [DOI] [PubMed] [Google Scholar]
- 11.Srivastava S. Move Over Proteomics, Here Comes Glycomics. Journal of Proteome Research. 2008;7(5):1799–1799. doi: 10.1021/pr083696k. [DOI] [PubMed] [Google Scholar]
- 12.Packer NH, von der Lieth C-W, Aoki-Kinoshita KF, Lebrilla CB, Paulson JC, Raman R, Rudd P, Sasisekharan R, Taniguchi N, York WS. Frontiers in glycomics: Bioinformatics and biomarkers in disease An NIH White Paper prepared from discussions by the focus groups at a workshop on the NIH campus, Bethesda MD (September 11–13, 2006) Proteomics. 2008;8(1):8–20. doi: 10.1002/pmic.200700917. [DOI] [PubMed] [Google Scholar]
- 13.Gagneux P, Varki A. Evolutionary considerations in relating oligosaccharide diversity to biological function. Glycobiology. 1999;9(8):747–755. doi: 10.1093/glycob/9.8.747. [DOI] [PubMed] [Google Scholar]
- 14.Willy Morelle J-CM. The Mass Spectrometric Analysis of Glycoproteins and their Glycan Structures. Current Analytical Chemistry. 2005;1:29–57. [Google Scholar]
- 15.Laine RA. Invited Commentary: A calculation of all possible oligosaccharide isomers both branched and linear yields 1.05 √ó 1012 structures for a reducing hexasaccharide: the Isomer Barrier to development of single-method saccharide sequencing or synthesis systems. Glycobiology. 1994;4(6):759–767. doi: 10.1093/glycob/4.6.759. [DOI] [PubMed] [Google Scholar]
- 16.Arnold JN, Saldova R, Hamid UMA, Rudd PM. Evaluation of the serum N-linked glycome for the diagnosis of cancer and chronic inflammation. Proteomics. 2008;8(16):3284–3293. doi: 10.1002/pmic.200800163. [DOI] [PubMed] [Google Scholar]
- 17.Brooks SA, Dwek MV, Schumacher U. Functional and Molecular Glycobiology. BIOS Scientific Publishers Limited; Oxford, UK: 2002. [Google Scholar]
- 18.Lis H, Sharon N. Protein glycosylation. European Journal of Biochemistry. 1993;218(1):1–27. doi: 10.1111/j.1432-1033.1993.tb18347.x. [DOI] [PubMed] [Google Scholar]
- 19.Kronewitter SR, An HJ, de Leoz ML, Lebrilla CB, Miyamoto S, Leiserowitz GS. The development of retrosynthetic glycan libraries to profile and classify the human serum N-linked glycome. Proteomics. 2009;9(11):2986–2994. doi: 10.1002/pmic.200800760. [DOI] [PMC free article] [PubMed] [Google Scholar]
- 20.Chu CS, Ninonuevo MR, Clowers BH, Perkins PD, An HJ, Yin H, Killeen K, Miyamoto S, Grimm R, Lebrilla CB. Profile of native N-linked glycan structures from human serum using high performance liquid chromatography on a microfluidic chip and time-of-flight mass spectrometry. Proteomics. 2009;9(7):1939–51. doi: 10.1002/pmic.200800249. [DOI] [PMC free article] [PubMed] [Google Scholar]
- 21.Joshi HJ, Harrison MJ, Schulz BL, Cooper CA, Packer NH, Karlsson NG. Development of a mass fingerprinting tool for automated interpretation of oligosaccharide fragmentation data. Proteomics. 2004;4(6):1650–64. doi: 10.1002/pmic.200300784. [DOI] [PubMed] [Google Scholar]
- 22.Raman R, Raguram S, Venkataraman G, Paulson JC, Sasisekharan R. Glycomics: an integrated systems approach to structure-function relationships of glycans. Nat Meth. 2005;2(11):817–824. doi: 10.1038/nmeth807. [DOI] [PubMed] [Google Scholar]
- 23.Ceroni A, Maass K, Geyer H, Geyer R, Dell A, Haslam SM. GlycoWorkbench: a tool for the computer-assisted annotation of mass spectra of glycans. J Proteome Res. 2008;7(4):1650–9. doi: 10.1021/pr7008252. [DOI] [PubMed] [Google Scholar]
- 24.Campbell MP, Royle L, Radcliffe CM, Dwek RA, Rudd PM. GlycoBase and autoGU: tools for HPLC-based glycan analysis. Bioinformatics. 2008;24(9):1214–6. doi: 10.1093/bioinformatics/btn090. [DOI] [PubMed] [Google Scholar]
- 25.Royle L, Campbell MP, Radcliffe CM, White DM, Harvey DJ, Abrahams JL, Kim YG, Henry GW, Shadick NA, Weinblatt ME, Lee DM, Rudd PM, Dwek RA. HPLC-based analysis of serum N-glycans on a 96-well plate platform with dedicated database software. Anal Biochem. 2008;376(1):1–12. doi: 10.1016/j.ab.2007.12.012. [DOI] [PubMed] [Google Scholar]
- 26.Hua S, An HJ, Ozcan S, Ro GS, Soares S, DeVere-White R, Lebrilla CB. Comprehensive native glycan profiling with isomer separation and quantitation for the discovery of cancer biomarkers. Analyst. 2011;136(18):3663–3671. doi: 10.1039/c1an15093f. [DOI] [PMC free article] [PubMed] [Google Scholar]
- 27.Hua S, Lebrilla C, An HJ. Application of nano-LC-based glycomics towards biomarker discovery. Bioanalysis. 2011;3(22):2573–2585. doi: 10.4155/bio.11.263. [DOI] [PubMed] [Google Scholar]
- 28.Wu S, Tao N, German JB, Grimm R, Lebrilla CB. Development of an annotated library of neutral human milk oligosaccharides. J Proteome Res. 2010;9(8):4138–51. doi: 10.1021/pr100362f. [DOI] [PMC free article] [PubMed] [Google Scholar]
- 29.Zhang J, Lindsay LL, Hedrick JL, Lebrilla CB. Strategy for Profiling and Structure Elucidation of Mucin-Type Oligosaccharides by Mass Spectrometry. Analytical Chemistry. 2004;76(20):5990–6001. doi: 10.1021/ac049666s. [DOI] [PubMed] [Google Scholar]
- 30.Arnold JN, Wormald MR, Suter DM, Radcliffe CM, Harvey DJ, Dwek RA, Rudd PM, Sim RB. Human Serum IgM Glycosylation. Journal of Biological Chemistry. 2005;280(32):29080–29087. doi: 10.1074/jbc.M504528200. [DOI] [PubMed] [Google Scholar]
- 31.Field MC, Amatayakul-Chantler S, Rademacher TW, Rudd PM, Dwek RA. Structural analysis of the N-glycans from human immunoglobulin A1: comparison of normal human serum immunoglobulin A1 with that isolated from patients with rheumatoid arthritis. Biochem J. 1994;299(Pt 1):261–75. doi: 10.1042/bj2990261. [DOI] [PMC free article] [PubMed] [Google Scholar]
- 32.Stadlmann J, Pabst M, Kolarich D, Kunert R, Altmann F. Analysis of immunoglobulin glycosylation by LC-ESI-MS of glycopeptides and oligosaccharides. Proteomics. 2008;8(14):2858–2871. doi: 10.1002/pmic.200700968. [DOI] [PubMed] [Google Scholar]
- 33.Karlsson NG, Wilson NL, Wirth H-J, Dawes P, Joshi H, Packer NH. Negative ion graphitised carbon nano-liquid chromatography/mass spectrometry increases sensitivity for glycoprotein oligosaccharide analysis. Rapid Communications in Mass Spectrometry. 2004;18(19):2282–2292. doi: 10.1002/rcm.1626. [DOI] [PubMed] [Google Scholar]
- 34.Thomsson KA, BaÃàckstroÃàm M, HolmeÃÅn Larsson JM, Hansson GC, Karlsson H. Enhanced Detection of Sialylated and Sulfated Glycans with Negative Ion Mode Nanoliquid Chromatography/Mass Spectrometry at High pH. Analytical Chemistry. 2010;82(4):1470–1477. doi: 10.1021/ac902602e. [DOI] [PubMed] [Google Scholar]
- 35.Ninonuevo MR, Park Y, Yin H, Zhang J, Ward RE, Clowers BH, German JB, Freeman SL, Killeen K, Grimm R, Lebrilla CB. A Strategy for Annotating the Human Milk Glycome. Journal of Agricultural and Food Chemistry. 2006;54(20):7471–7480. doi: 10.1021/jf0615810. [DOI] [PubMed] [Google Scholar]
- 36.Knox JH, et al. Carbon-based Packing Materials for Liquid Chromatography-Structure, Performance, and Retention Mechanisms. Vol. 37. Marcel Dekker; New York: 1997. [Google Scholar]
- 37.Ross P, et al. Carbon-based Packing Materials for Liquid Chromatography: Applications. Vol. 37. Marcel Dekker; New York: 1997. [PubMed] [Google Scholar]
- 38.Davies M, Smith KD, Harbin A-M, Hounsell EF. High-performance liquid chromatography of oligosaccharide alditols and glycopeptides on a graphitized carbon column. Journal of Chromatography A. 1992;609(1–2):125–131. doi: 10.1016/0021-9673(92)80155-n. [DOI] [PubMed] [Google Scholar]
- 39.Annesley TM. Ion Suppression in Mass Spectrometry. Clin Chem. 2003;49(7):1041–1044. doi: 10.1373/49.7.1041. [DOI] [PubMed] [Google Scholar]
- 40.Koizumi K. High-performance liquid chromatographic separation of carbohydrates on graphitized carbon columns. Journal of Chromatography A. 1996;720(1–2):119–126. doi: 10.1016/0021-9673(94)01274-1. [DOI] [PubMed] [Google Scholar]
- 41.Koizumi K, Okada Y, Fukuda M. High-performance liquid chromatography of mono- and oligo-saccharides on a graphitized carbon column. Carbohydrate Research. 1991;215(1):67–80. [Google Scholar]
- 42.Itoh S, Kawasaki N, Ohta M, Hyuga M, Hyuga S, Hayakawa T. Simultaneous microanalysis of N-linked oligosaccharides in a glycoprotein using microbore graphitized carbon column liquid chromatography-mass spectrometry. J Chromatogr A. 2002;968(1–2):89–100. doi: 10.1016/s0021-9673(02)00951-2. [DOI] [PubMed] [Google Scholar]
- 43.Li B, Russell SC, Zhang J, Hedrick JL, Lebrilla CB. Structure determination by MALDI-IRMPD mass spectrometry and exoglycosidase digestions of O-linked oligosaccharides from Xenopus borealis egg jelly. Glycobiology. 2011;21(7):877–894. doi: 10.1093/glycob/cwr003. [DOI] [PMC free article] [PubMed] [Google Scholar]
Associated Data
This section collects any data citations, data availability statements, or supplementary materials included in this article.
Supplementary Materials
1_si_001
