A Mutation in the LDL Receptor–Related Protein 5 Gene Results in the Autosomal Dominant High–Bone-Mass Trait (original) (raw)
Abstract
Osteoporosis is a complex disease that affects >10 million people in the United States and results in 1.5 million fractures annually. In addition, the high prevalence of osteopenia (low bone mass) in the general population places a large number of people at risk for developing the disease. In an effort to identify genetic factors influencing bone density, we characterized a family that includes individuals who possess exceptionally dense bones but are otherwise phenotypically normal. This high–bone-mass trait (HBM) was originally localized by linkage analysis to chromosome 11q12-13. We refined the interval by extending the pedigree and genotyping additional markers. A systematic search for mutations that segregated with the HBM phenotype uncovered an amino acid change, in a predicted β-propeller module of the low-density lipoprotein receptor–related protein 5 (LRP5), that results in the HBM phenotype. During analysis of >1,000 individuals, this mutation was observed only in affected individuals from the HBM kindred. By use of in situ hybridization to rat tibia, expression of LRP5 was detected in areas of bone involved in remodeling. Our findings suggest that the HBM mutation confers a unique osteogenic activity in bone remodeling, and this understanding may facilitate the development of novel therapies for the treatment of osteoporosis.
Introduction
Bone is a dynamic organ that is constantly being degraded and renewed in a remodeling process. A tight coupling between bone resorption by osteoclasts and deposition by osteoblasts is therefore required to maintain normal skeletal structure. If this delicate balance is disturbed, however, the density and architecture of bone can become abnormal, resulting in diseases such as osteoporosis or osteopetrosis (Marks and Hermey 1996). Although environmental factors such as diet and exercise clearly affect bone mineral density (BMD), it is also well documented that genetic factors are involved (Blank 2001). In an effort to identify genes that play a role in regulating BMD, we have elsewhere characterized a family exhibiting an autosomal dominant trait of high bone mass (HBM or BMND1 [MIM 601884]; Johnson et al. 1997). Linkage analysis showed that the trait was localized to a region of ∼30 cM between markers D11S905 and D11S937 on chromosome 11q12-13_._ Interestingly, additional genetic loci that segregated with abnormal bone phenotypes and that map to 11q13 include loci for osteoporosis pseudoglioma syndrome (OPS [MIM 259770]; Gong et al. 1996) and autosomal recessive osteopetrosis (arOP [MIM 259700]; Heaney et al. 1998), as well as a quantitative trait locus (QTL) that contributes to normal variation in bone mineral density (Koller et al. 1998). OPS, a recessive disorder, is characterized by premature osteoporosis that leads to bone fracture and deformity and by congenital or juvenile-onset blindness. A subset of arOP cases results from mutations in the osteoclast-specific TCIRG1 subunit of the vacuolar proton pump (Frattini et al. 2000; Scimeca et al. 2000). This results in defective resorption of immature bone by osteoclasts and causes the abnormal accumulation of excessive amounts of bone.
In the present study, we describe the refinement of the HBM interval by extending the pedigree and genotyping additional markers in the region. In addition, we systematically searched for mutations that segregated with the HBM phenotype and that were rare in the general population. From these analyses, we identified a mutation, in the low-density lipoprotein receptor–related protein 5 gene (LRP5), that results in the HBM phenotype.
Material and Methods
Phenotyping
Spinal bone mineral content (BMC) and BMD measurements were made by dual-energy X-ray absorptiometry, using Hologic 2000 (Hologic) or Norland XR2600 (Norland Medical Systems) densitometers. The study was approved by the appropriate institutional review board; appropriate informed consent was obtained from human subjects.
Genotyping
DNA was extracted from blood samples, using a kit (Gentra Systems, Inc.). Genotyping was performed as described elsewhere (Johnson et al. 1997). Markers supplementing the original screening set in the critical interval included D11S4191, D11S1296, D11S1337, D11S970, D11S4113, D11S4136, and D11S4139 and seven novel genetic markers developed from genomic sequence. Microsatellite marker GTC271K22, a CA repeat that defined the telomeric boundary, was identified from genomic sequence. Primers used for genotyping the ∼175-bp products were 5′-TTTTGGGTACACAATTCAGTCG-3′ (forward) and 5′-AAAACTGTGGGTGCTTCTGG-3′ (reverse).
Linkage Analysis
Multipoint and haplotype analyses were performed using a modified version of the program SIMWALK2 (Sobel and Lange 1996) that allowed for the analysis of quantitative traits. Affection status (qualitative phenotype) was defined as having a sum of hip and spine Z scores >4 or having spine Z scores >2, among the three individuals for whom hip BMD measurements were not available. A quantitative phenotype was defined as the sum of the hip and spine Z scores and as twice the spine Z score when no hip score was available. Thirty-eight individuals were genotyped and included in the linkage analysis; phenotypic information was missing for one individual who was too young to be phenotyped at the time of the study. Marker-allele frequencies were estimated by maximum likelihood (Boehnke 1991), and the gene frequency was set at .0001. For the qualitative trait, an autosomal dominant, fully penetrant model with a phenocopy rate of 1% was used. We used maximum likelihood estimates for a mixture of normal distributions to define our quantitative model. The mean of the sum of the hip and spine Z scores for homozygous wild-type individuals was estimated at −0.1 and that for heterozygotes was estimated at 8.4; the mean for hypothetical individuals with two copies of the mutation was set at 16.9, under the assumption of an additive model. In addition, the variance for the trait was estimated at 1.9 for the homozygous groups and at 6.8 for the heterozygous group. Haplotype analysis was performed using the genotype only with SIMWALK2 and was visualized with the Cyrillic program.
Gene Characterization
BAC clones containing sequence-tagged site (STS) markers were obtained by PCR-based screening of DNA pools from human BAC libraries (CITB, RPCI-11, and Genome Systems). DNA pools corresponding to nine genomic equivalents of human DNA were screened. Sequencing of BAC clones and BAC insert termini was performed using standard ABI 377 automated DNA sequencing methods. Direct cDNA selection was performed, as described elsewhere, using cDNA pools from bone marrow, calvarial bone, femoral bone, kidney, skeletal muscle, testis, and total brain (Del Mastro and Lovett 1997). DNA from 54 BACs spanning the region was isolated using Nucleobond AX columns (The Nest Group), was pooled in equimolar amounts, and was used as the genomic template for direct cDNA selection. Approximately 5,000 direct selected cDNA clones were sequenced using standard ABI 377 automated fluorescence sequencing methods (Applied Biosystems). Directionally cloned cDNA libraries were constructed and screened by standard methods (Soares 1994). MZEF (Zhang 1997), an exon-prediction program, was used to identify putative exons that may constitute portions of novel genes.
Mutation Analysis
PCR products were sequenced according to the standard protocol for energy-transfer primers (Amersham), using ABI 377 sequencers. PolyPhred (Nickerson et al. 1997) was used to assemble sequence sets for viewing with Consed (Gordon et al. 1998). All PCR primers were made as chimeras, to facilitate dye-primer sequencing. The M13-21F (5′-GTA CGA CGG CCA GT-3′) and −28REV (5′-AAC AGC TAT GAC CAT G-3′) primer-binding sites were included on the 5′ end of each forward and reverse PCR primer, respectively, during synthesis. Candidate regions were first screened in a subset of the family with HBM, which consisted of the affected proband daughter and her mother and unaffected father and brother. Mutations that segregated exclusively with the HBM phenotype were then re-examined in additional members of the family. Segregating mutations in this extended group were typed in 84 additional persons (48 individuals known to have normal BMD and 36 unrelated individuals [Dausset et al. 1990] with unknown BMD). Rare mutations were subsequently examined in the entire HBM pedigree.
Allele-Specific Oligonucleotide Analysis
Individuals were typed, using an allele-specific oligonucleotide method (Dietz et al. 1991). The amplicon containing the HBM mutation was amplified by PCR, using the following primers: 5′-CCAAGTTCTGAGAAGTCC-3′ (forward) and 5′-AATACCTGAAACCATACCTG-3′ (reverse). PCR products briefly underwent electrophoresis on agarose gels, were blotted to nylon membranes, and then were hybridized with radiolabeled oligonucleotide probes (5′-AGACTGGGGTGAGACGC-3′ [wild-type] and 5′-CAGACTGGGTTGAGACGCC-3′ [mutant]; the mutation is underlined). The population analyzed included 67 grandparents (most of whom were white) from the database of the Centre d'Etude du Polymorphisme Humain, as well as 192 white, 192 African American, 96 Hispanic, and 96 Asian individuals.
Structural Modeling
LDLR and LRP5 sequences were aligned using the local-alignment algorithm of Smith and Waterman (1981) as implemented by GCG's BestFit program. Ribbon diagrams were viewed using Weblab Viewer Pro (Accelrys). The structure containing the substituted valine was relaxed for 500 minimizing steps, using Discover3 as part of the Accelrys InsightII package to relax any steric hindrances.
In Situ Hybridization
In situ hybridization to rat tibia was conducted by Pathology Associates International. Tibias were collected from two female Sprague-Dawley rats that were 6–8 wk old. The bones were sectioned, were mounted on adhesive slides, and were hybridized with the following probes from a unique region of the mouse LRP5 cDNA (GenBank accession number AF064984): 5′-AGCGAGGCCACCATCCACAGG-3′ (sense primer) and 5′-TCGCTGGTCGGCATAATCAAT-3′ (antisense primer). Antisense and sense riboprobes were synthesized using T7 and T3 RNA polymerases, respectively, in the presence of digoxigenin-11-UTP (Boehringer-Mannheim). A MAXIscript IVT kit (Ambion) was used according to the manufacturer's protocol.
Results and Discussion
In our initial genomewide scan, haplotype analysis placed the HBM locus within a 30-cM region between markers D11S905 and D11S937 (Johnson et al. 1997). To narrow the genetic interval, we extended the pedigree and genotyped additional microsatellite markers in this region. BMD measurements were determined at six skeletal sites (spine, hip, total body, total radius, midradius, and one-third radius). Density measurements were converted to Z scores, a value that corresponds to the standard deviation by which a subject differs from the mean value for an age- and sex-matched reference population. As shown in figure 1, when spine Z scores are plotted against hip Z scores, some individuals cluster into a clear group that has a combined spine and hip Z score >4. This index was used in subsequent analyses as the criterion for determining affected status. We estimated the probability of having a sum of hip and spine Z scores of >4 to be ∼1% in the general population, and we used that value to approximate the phenocopy rate in our linkage analysis. This was based on a bivariate normal distribution for the spinal and hip Z scores with means of 0, variances of 1, and a correlation coefficient of .48, as estimated from the unaffected members of the pedigree. Individuals with and without HBM had mean total body Z scores of 4.91±1.41 and 0.64±1.00, respectively; the mean Z score for unaffected individuals is 0. Thus, affected members of the pedigree had a bone mass approximately five times greater than 1 SD above the mean of the general population. The skeletal structure of individuals with the HBM trait in this family is completely normal, and no other unusual clinical findings were observed in affected individuals (R. R. Recker, M. L. Johnson, K. Davies, and S. M. Recker, unpublished data). We are unaware of reports of comparable phenotypes corresponding to a generalized increase in bone mass throughout the body. Diseases such as osteopetrosis, pycnodysostosis (PYCD [MIM 265800]), progressive diaphyseal dysplasia (DPD1 [MIM 13100]), endosteal hyperostosis (VBCH [MIM 239100]), and melorheostosis (MIM 155950) also result in increased bone density but are associated with detrimental effects and usually produce localized lesions.
Figure 1.
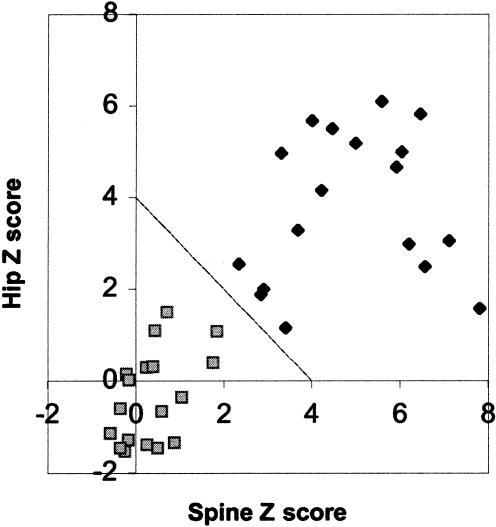
BMD measurements. A plot of the hip versus spine BMD measurements of the family with HBM is shown. Blackened diamonds indicate individuals with the mutation, and shaded squares indicate individuals without the mutation. The criterion used for assigning affection status was a sum >4 of Z scores from hip and spine, as indicated by the diagonal line.
The pedigree used in the linkage studies is shown in figure 2. Multipoint linkage analysis was performed using both qualitative and quantitative phenotypic definitions. The qualitative phenotype yielded a highly significant peak LOD score of 10.1. Haplotype analysis showed that all individuals determined to be affected, according to this index (a sum of hip and spine Z scores >4), shared a common haplotype in the critical interval. The quantitative analysis resulted in a peak LOD score of 9.5 in the region of the shared haplotype and was independent of the criterion (combined hip and spine Z score >4) that was used in the qualitative analysis. Haplotype analysis identified recombination events in individuals 44 (HBM) and 46 (unaffected) that significantly refined the HBM interval (fig. 2). On the basis of these analyses, observations for individual 44 placed the HBM locus centromeric to marker GTC271K22, and observations for individual 46 placed the centromeric boundary of the HBM locus at marker D11S987. Thus, the HBM interval was narrowed to a 3-cM region between markers D11S987 and GTC271K22.
Figure 2.
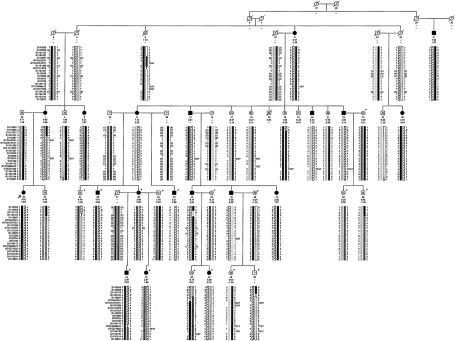
HBM pedigree and haplotypes of the individuals used in the genetic–linkage studies. Blackened symbols represent affected individuals. Symbols containing “N” indicate unaffected individuals. Numbers beneath the symbols show the identification numbers, the Z scores for the spinal and hip BMD, and the alleles for the critical markers on chromosome 11. Question marks (?) denote unknown affection status, genotype, or phase. Untyped genotypes inferred with certainty are included in parentheses. The striped haplotype is shared by all affected individuals; critical crossovers were identified in individuals 44 and 46. Asterisks (*) indicate the 16 additional individuals used to narrow the region. Arrow indicates the proband.
A physical map spanning this critical interval was constructed by screening BAC libraries with markers derived from public resources and BAC insert termini (fig. 3). To identify candidate HBM genes, genomic sequencing of 15 BACs from the 2-mB interval, as well as direct cDNA selection, was performed. Figure 3 illustrates the approximate location of 16 genes that were considered as candidate HBM genes.
Figure 3.
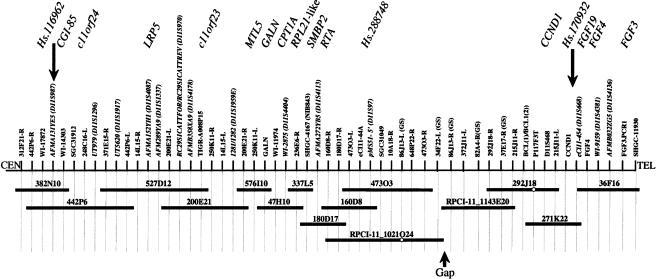
Physical map of the HBM interval. STS markers derived from genes, expressed-sequence tags, microsatellites, random sequences, and BAC end sequences are denoted above the long horizontal line. STSs derived from BAC end sequences are listed with the BAC library address followed by L or R, for the left or right end of the clone, respectively; end sequences derived from BACs from the Genome Systems library are indicated with GS. The two large arrows indicate the location of genetic markers that define the HBM critical region. The horizontal lines below the STSs indicate a minimal tiling path of BAC clones that were sequenced. Open circles indicate that the marker did not amplify from the corresponding BAC. All clones were from the CITB library except for the two preceded by an RPCI-11 prefix. A region that was underrepresented in the library is indicated as a gap. Genes that were analyzed for mutations are shown in their approximate location at the top of the figure. Genes with a prefix of Hs correspond to UniGene entries.
Comparative DNA sequencing was used to identify mutations in the HBM candidate genes. Amplicons used to identify mutations included exons, UTRs, splice sites, and, in some cases, putative promoter regions. Our strategy consisted of three stages that used different subsets of the family with HBM to identify segregating mutations and a population panel of 84 individuals to assess allele frequencies. We assumed that, since elevated BMD is rare in the general population, the causal mutation would not be observed at high frequency in a random sample. A total of 231 exons were analyzed for mutations, using this approach. On the basis of these analyses, 146 polymorphisms were identified; 53 were present within exons, and 93 were located in introns or putative regulatory elements. A single mutation was found that was present only in affected individuals of the kindred with HBM. This rare mutation was a G-to-T transversion in exon 3 of the LRP5 gene (Dong et al. 1998; Hey et al. 1998; Kim et al. 1998; Twells et al. 2001) (GenBank accession numbers AF064548 and AAC36467 [fig. 4A]) that resulted in a glycine-to-valine amino acid change (G171V). All affected individuals were heterozygous for the mutation, an observation consistent with the autosomal dominant mode of inheritance for the trait. To determine the allele frequency for this mutation in the general population, an allele-specific oligonucleotide assay was used. The population analyzed included 275 phenotyped individuals who had normal BMD (Z scores between −2.8 and +2.1) and 643 random individuals from an ethnically diverse panel. Of the ∼1,000 individuals examined in the present study, only individuals with HBM who were part of the original kindred harbored the mutation in exon 3 of the LRP5 gene.
Figure 4.
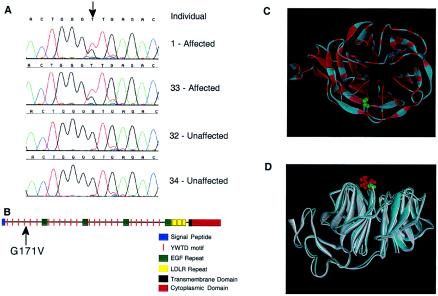
HBM mutation and domain structure of the LRP5 protein. A, Sequence traces illustrating the HBM mutation (arrow) for a core four-member family. Identification numbers are as in figure 2. B, Domain organization of LRP5. The site of the glycine-to-valine change that occurs in the HBM protein is indicated with an arrow. C, Similarity of LRP5 and LDLR. A ribbon representation of LDLR, in which colors are based on homology with the first propeller (and EGF) domains of LRP5, is shown as viewed from the top. Identities are shown in red, and similarities are shown in pink. The location of G516 of the mature LDLR protein (comparable to residue G171 in LRP5) is shown in green. D, Simulation of the LRTP5 G171V mutation in the LDLR YWTD-EGF domain pair. The glycine at amino acid 516 of the mature LDLR protein was replaced with a valine, and the resulting three-dimensional structures were superimposed and viewed from the side. The wild-type structure is shown in blue with G516 in green, and the G516V mutant structure is shown in white with the V516 residue in red.
The protein encoded by LRP5 is a member of the low-density lipoprotein–receptor (LDLR) gene superfamily (Hussain et al. 1999) and is most closely related to LRP6 (Brown et al. 1998). The extracellular portions of these two proteins contain four domains consisting of six YWTD repeats followed by an epidermal growth factor (EGF)–like module, and an LDLR-like ligand-binding domain (fig. 4_B_). The mutation at glycine 171 occurs near the fourth YWTD repeat of the first YWTD/EGF domain in LRP5. The second and third YWTD/EGF repeats of LRP5 also contain glycine at the corresponding position, as do YWTD/EGF repeats in LDLR, LRP6, and the mouse ortholog of LRP5, suggesting that this residue is evolutionarily conserved. Recently, analysis of the crystal structure of the YWTD/EGF domain pair of the LDLR revealed that the YWTD repeats form a six-bladed β-propeller module (Jeon et al. 2001). To evaluate the possible impact of the HBM mutation in this domain, we analyzed the structure of the human LDLR YWTD-EGF domain pair (PDB 1IJQ) by replacing the conserved glycine with valine. Figures 4_C_ and 4_D_ show that this residue is predicted to reside on the surface of the protein and at the top of the propeller module. Figure 4_D_ further suggests that the glycine-to-valine change would alter the local hydrophobic environment and, thus, may affect the interaction of LRP5 with other proteins. Interestingly, a number of mutations in this region of the β-propeller module of the LDLR cause familial hypercholesterolemia (Jeon et al. 2001), confirming that this domain is important for protein function.
Northern blot analysis (fig. 5) revealed that LRP5 was transcribed in human bone tissue as well as in numerous other tissues. Specific regions of bone were also assessed for expression, using in situ hybridization to rat tibia (fig. 6). LRP5 transcripts were primarily detected in areas of bone involved in remodeling, including the endosteum and trabecular bone within the metaphysis. Hybridization was also observed to cells within the periosteum, epiphysis, and growth plate.
Figure 5.
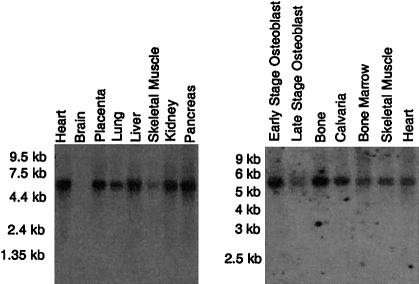
Northern blot analyses showing the expression of LRP5 in various tissues.
Figure 6.
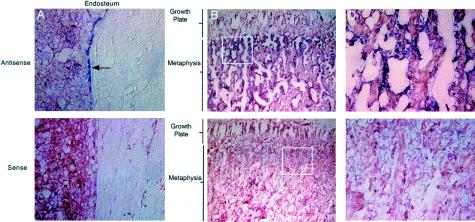
In situ hybridization of the LRP5 gene in bone tissue. A, Localization of LRP5 transcripts in rat endosteum by in situ hybridization with antisense and sense probes; original magnification ×400. Arrow indicates bone-lining cells. B, Localization of LRP5 transcripts in rat metaphysis and growth plate by in situ hybridization with antisense and sense probes; original magnification ×100. Boxes enclose regions that are shown at higher magnification in panel C. C, Localization of LRP5 transcripts in rat proximal metaphysis by in situ hybridization with antisense and sense probes; original magnification ×400.
Additional genetic loci segregating with a bone phenotype that map to 11q13 include osteoporosis pseudoglioma syndrome (OPS [MIM 259770]; Gong et al. 1996), autosomal recessive osteopetrosis (arOP [MIM 259700]; Heaney et al. 1998), and a quantitative trait locus that contributes to normal variation in BMD (Koller et al. 1998). The recent finding that deleterious (loss of function) mutations in LRP5 cause the bone defects seen in OPS further supports the critical role of this gene in skeletal integrity (Gong et al. 2001). In addition, mice deficient in LRP5 have been reported to have low bone mass, low body weight, and abnormal eye vascularization (Levasseur et al. 2001). Conversely, the gain of function mutation in LRP5 that we describe produces increased bone mass with no adverse effect on skeletal structure. Additional compelling evidence to support the importance of LRP5 in bone remodeling is derived from transgenic mice that express the human LRP5 gene containing the HBM mutation (P. Babij, W. Zhao, C. Small, P. Reddy, P. Yaworsky, M. Bouxsein, P. Bodine, J. Robinson, R. Moran, Y. Kharode, and F. Bex, personal communication). These mice exhibit increased trabecular and cortical bone parameters, as well as enhanced skeletal strength. Recently, the LRP5 and LRP6 proteins have been shown to play a role in Wnt signaling (Pinson et al. 2000; Tamai et al. 2000; Wehrli et al. 2000; Mao et al. 2001), which is a key pathway involved in various developmental processes, including skeletal differentiation (Yamaguchi et al. 1999). Further characterization of the LRP5 protein and associated signaling pathways could lead to a new paradigm for therapeutics targeted to enhancing bone deposition, compared with current therapies that rely on antiresorptive agents.
Acknowledgments
We are very grateful to all the members of the family with HBM for their cooperation. The authors would like to thank the following for valuable contributions: P. Baltzer, E. Clark, J. Dubois, L. Elze, N. Ma, M. Nguyen, J. Piconni, B. Pothier, S. Ramakrishnan, M. Rubenfield, P. Snell, L. Thurston, D. Zaveri, and C. Zheng. The authors would also like to acknowledge the significant sequencing effort provided by the Genome Therapeutics Corporation Sequencing Center and to thank Fred Bex, Tim Keith, Richard Labaudiniere, Charles Richard, and Paul Yaworsky for comments on the manuscript.
Electronic-Database Information
Accession numbers and URLs for data in this article are as follows:
- Cyrillic program, http://www.cyrillicsoftware.com/ (for visualizing pedigrees)
- GenBank, http://www.ncbi.nlm.nih.gov/Genbank/ (for human LRP5 cDNA [accession number AF064548], human LRP5 protein [accession number AAC36467], and mouse LRP5 cDNA [accession number AF064984])
- Online Mendelian Inheritance in Man (OMIM), http://www.ncbi.nlm.nih.gov/Omim/ (for HBM or BMND1 [MIM 601884], OPS [MIM 259770], arOP [MIM 259700]), PYCD [MIM 265800], DPD1 [MIM 13100], VBCH [MIM 239100], and melorheostosis [MIM 155950])
- Protein Data Bank, http://www.rcsb.org/pdb/ (for LDLR YWTD-EGF domain pair [PDB 1IJQ])
- UniGene, http://www.ncbi.nlm.nih.gov/UniGene/ (for UniGene Cluster Hs.116962, CGI-85 [UniGene Cluster Hs.267448], c11orf24 [UniGene Cluster Hs.303025], LRP5 [UniGene Cluster Hs.6347], c11orf23 [UniGene Cluster Hs.180817], MTL5 [UniGene Cluster Hs.121378], GALN [UniGene Cluster Hs.1907], CPT1A [UniGene Cluster Hs.259785], SMBP2 [UniGene Cluster Hs.1521], RTA [UniGene Cluster Hs.118513], [UniGene Cluster Hs.288748], CCND1 [UniGene Cluster Hs.82932], [UniGene Cluster Hs.170932], FGF19 [UniGene Cluster Hs.249200], FGF4 [UniGene Cluster Hs.1755], and FGF3 [UniGene Cluster Hs.37092])
References
- Blank RD (2001) Breaking down bone strength: a perspective on the future of skeletal genetics. J Bone Miner Res 16:1207–1211 [DOI] [PubMed] [Google Scholar]
- Boehnke M (1991) Allele frequency estimation from data on relatives. Am J Hum Genet 48:22–25 [PMC free article] [PubMed] [Google Scholar]
- Brown SD, Twells RC, Hey PJ, Cox RD, Levy ER, Soderman AR, Metzker ML, Caskey CT, Todd JA, Hess JF (1998) Isolation and characterization of LRP6, a novel member of the low density lipoprotein receptor gene family. Biochem Biophys Res Commun 248:879–888 [DOI] [PubMed] [Google Scholar]
- Dausset J, Cann H, Cohen D, Lathrop M, Lalouel JM, White R (1990) Centre d’Etude du Polymorphisme Humain (CEPH): collaborative genetic mapping of the human genome. Genomics 6:575–577 [DOI] [PubMed] [Google Scholar]
- Del Mastro RG, Lovett M (1997) Isolation of coding sequences from genomic regions using direct selection. Methods Mol Biol 68:183–199 [DOI] [PubMed] [Google Scholar]
- Dietz HC, Cutting GR, Pyeritz RE, Maslen CL, Sakai LY, Corson GM, Puffenberger EG, Hamosh A, Nanthakumar EJ, Curristin SM, Stetten G, Meyers DA, Francomano CA (1991) Marfan syndrome caused by a recurrent de novo missense mutation in the fibrillin gene. Nature 352:337–339 [DOI] [PubMed] [Google Scholar]
- Dong Y, Lathrop W, Weaver D, Qiu Q, Cini J, Bertolini D, Chen D (1998) Molecular cloning and characterization of LR3, a novel LDL receptor family protein with mitogenic activity. Biochem Biophys Res Commun 251:784–790 [DOI] [PubMed] [Google Scholar]
- Frattini A, Orchard PJ, Sobacchi C, Giliani S, Abinun M, Mattsson JP, Keeling DJ, Andersson AK, Wallbrandt P, Zecca L, Notarangelo LD, Vezzoni P, Villa A (2000) Defects in TCIRG1 subunit of the vacuolar proton pump are responsible for a subset of human autosomal recessive osteopetrosis. Nat Genet 25:343–346 [DOI] [PubMed] [Google Scholar]
- Gong Y, Slee RB, Fukai N, Rawadi G, Roman-Roman S, Reginato AM, Wang H, et al (2001) LDL receptor-related protein 5 (LRPS) affects bone accrual and eye development. Cell 107:513–523 [DOI] [PubMed] [Google Scholar]
- Gong Y, Vikkula M, Boon L, Liu J, Beighton P, Ramesar R, Peltonen L, Somer H, Hirose T, Dallapiccola B, De Paepe A, Swoboda W, Zabel B, Superti-Furga A, Steinmann B, Brunner HG, Jans A, Boles RG, Adkins W, van den Boogaard MJ, Olsen BR, Warman ML (1996) Osteoporosis-pseudoglioma syndrome, a disorder affecting skeletal strength and vision, is assigned to chromosome region 11q12–13. Am J Hum Genet 59:146–151 [PMC free article] [PubMed] [Google Scholar]
- Gordon D, Abajian C, Green P (1998) Consed: a graphical tool for sequence finishing. Genome Res 8:195–202 [DOI] [PubMed] [Google Scholar]
- Heaney C, Shalev H, Elbedour K, Carmi R, Staack JB, Sheffield VC, Beier DR (1998) Human autosomal recessive osteopetrosis maps to 11q13, a position predicted by comparative mapping of the murine osteosclerosis (oc) mutation. Hum Mol Genet 7:1407–1410 [DOI] [PubMed] [Google Scholar]
- Hey PJ, Twells RC, Phillips MS, Nakagawa Y, Brown SD, Kawaguchi Y, Cox R, Xie G, Dugan V, Hammond H, Metzker ML, Todd JA, Hess JF (1998) Cloning of a novel member of the low-density lipoprotein receptor family. Gene 216:103–111 [DOI] [PubMed] [Google Scholar]
- Hussain MM, Strickland DK, Bakillah A (1999) The mammalian low-density lipoprotein receptor family. Annu Rev Nutr 19:141–172 [DOI] [PubMed] [Google Scholar]
- Jeon H, Meng W, Takagi J, Eck MJ, Springer TA, Blacklow SC (2001) Implications for familial hypercholesterolemia from the structure of the LDL receptor YWTD-EGF domain pair. Nat Struct Biol 8:499–504 [DOI] [PubMed] [Google Scholar]
- Johnson ML, Gong G, Kimberling W, Recker SM, Kimmel DB, Recker RR (1997) Linkage of a gene causing high bone mass to human chromosome 11 (11q12-13). Am J Hum Genet 60:1326–1332 [DOI] [PMC free article] [PubMed] [Google Scholar]
- Kim DH, Inagaki Y, Suzuki T, Ioka RX, Yoshioka SZ, Magoori K, Kang MJ, Cho Y, Nakano AZ, Liu Q, Fujino T, Suzuki H, Sasano H, Yamamoto TT (1998) A new low density lipoprotein receptor related protein, LRP5, is expressed in hepatocytes and adrenal cortex, and recognizes apolipoprotein. J Biochem 124:1072–1076 [DOI] [PubMed] [Google Scholar]
- Koller DL, Rodriguez LA, Christian JC, Slemenda CW, Econs MJ, Hui SL, Morin P, Conneally PM, Joslyn G, Curran ME, Peacock M, Johnston CC, Foroud T (1998) Linkage of a QTL contributing to normal variation in bone mineral density to chromosome 11q12-13. J Bone Miner Res 13:1903–1908 [DOI] [PubMed] [Google Scholar]
- Levasseur R, Kato M, Patel MS, Chan L, Karsenty G (2001) Low bone mass, low body weight and abnormal eye vascularization in mice deficient in Lrp5, the gene mutated in human osteoporosis pseudoglioma syndrome (OPS). Paper presented at The American Society for Bone and Mineral Research 23rd Annual Meeting, Phoenix, AZ, October 12–16, J Bone Miner Res Suppl 16:S152 [Google Scholar]
- Mao J, Wang J, Liu B, Pan W, Farr GH, Flynn C, Yuan H, Takada S, Kimelman D, Li L, Wu D (2001) Low-density lipoprotein receptor–related protein-5 binds to axin and regulates the canonical wnt signaling pathway. Mol Cell 7:801–809 [DOI] [PubMed] [Google Scholar]
- Marks SC Jr, Hermey DC (1996) The structure and development of bone. In: Bilezikian JP, Raias LG, Rodan GA (eds) Principles of bone biology. Academic Press, San Diego, pp 3–14 [Google Scholar]
- Nickerson DA, Tobe VO, Taylor SL (1997) PolyPhred: automating the detection and genotyping of single nucleotide substitutions using fluorescence-based resequencing. Nucleic Acids Res 25:2745–2751 [DOI] [PMC free article] [PubMed] [Google Scholar]
- Pinson KI, Brennan J, Monkley S, Avery BJ, Skarnes WC (2000) An LDL-receptor-related protein mediates Wnt signalling in mice. Nature 407:535–538 [DOI] [PubMed] [Google Scholar]
- Scimeca JC, Franchi A, Trojani C, Parrinello H, Grosgeorge J, Robert C, Jaillon O, Poirier C, Gaudray P, Carle GF (2000) The gene encoding the mouse homologue of the human osteoclast-specific 116-kDa V-ATPase subunit bears a deletion in osteosclerotic (oc/oc) mutants. Bone 26:207–213 [DOI] [PubMed] [Google Scholar]
- Smith TF, Waterman MS (1981) Identification of common molecular subsequences. J Mol Biol 147:195–197 [DOI] [PubMed] [Google Scholar]
- Soares MB (1994) In: Adams MD, Fields C, Venter JC (eds) Automated DNA sequencing and analysis. Academic Press, New York, pp 110–114 [Google Scholar]
- Sobel E, Lange K (1996) Descent graphs in pedigree analysis: applications to haplotyping, location scores, and marker-sharing statistics. Am J Hum Genet 58:1323–1337 [PMC free article] [PubMed] [Google Scholar]
- Tamai K, Semenov M, Kato Y, Spokony R, Liu C, Katsuyama Y, Hess F, Saint-Jeannet JP, He X (2000) LDL-receptorrelated proteins in Wnt signal transduction. Nature 407:530–535 [DOI] [PubMed] [Google Scholar]
- Twells RC, Metzker ML, Brown SD, Cox R, Garey C, Hammond H, Hey PJ, Levy E, Nakagawa Y, Philips MS, Todd JA, Hess JF (2001) The sequence and gene characterization of a 400-kb candidate region for IDDM4 on chromosome 11q13. Genomics 72:231–242 [DOI] [PubMed] [Google Scholar]
- Wehrli M, Dougan ST, Caldwell K, O'Keefe L, Schwartz S, Vaizel-Ohayon D, Schejter E, Tomlinson A, DiNardo S (2000) Arrow encodes an LDL-receptor-related protein essential for Wingless signaling. Nature 407:527–530 [DOI] [PubMed] [Google Scholar]
- Yamaguchi TP, Bradley A, McMahon AP, Jones S (1999) Wnt5a pathway underlies outgrowth of multiple structures in the vertebrate embryo. Development 126:1211–1223 [DOI] [PubMed] [Google Scholar]
- Zhang MQ (1997) Identification of protein coding regions in the human genome by quadratic discriminant analysis. Proc Natl Acad Sci USA 94:565–568 [DOI] [PMC free article] [PubMed] [Google Scholar]