Ischaemic accumulation of succinate controls reperfusion injury through mitochondrial ROS (original) (raw)
. Author manuscript; available in PMC: 2015 May 20.
Published in final edited form as: Nature. 2014 Nov 5;515(7527):431–435. doi: 10.1038/nature13909
Abstract
Ischaemia-reperfusion (IR) injury occurs when blood supply to an organ is disrupted and then restored, and underlies many disorders, notably heart attack and stroke. While reperfusion of ischaemic tissue is essential for survival, it also initiates oxidative damage, cell death, and aberrant immune responses through generation of mitochondrial reactive oxygen species (ROS)1-5. Although mitochondrial ROS production in IR is established, it has generally been considered a non-specific response to reperfusion1,3. Here, we developed a comparative in vivo metabolomic analysis and unexpectedly identified widely conserved metabolic pathways responsible for mitochondrial ROS production during IR. We showed that selective accumulation of the citric acid cycle (CAC) intermediate succinate is a universal metabolic signature of ischaemia in a range of tissues and is responsible for mitochondrial ROS production during reperfusion. Ischaemic succinate accumulation arises from reversal of succinate dehydrogenase (SDH), which in turn is driven by fumarate overflow from purine nucleotide breakdown and partial reversal of the malate/aspartate shuttle. Upon reperfusion, the accumulated succinate is rapidly re-oxidised by SDH, driving extensive ROS generation by reverse electron transport (RET) at mitochondrial complex I. Decreasing ischaemic succinate accumulation by pharmacological inhibition is sufficient to ameliorate in vivo IR injury in murine models of heart attack and stroke. Thus, we have identified a conserved metabolic response of tissues to ischaemia and reperfusion that unifies many hitherto unconnected aspects of IR injury. Furthermore, these findings reveal a novel pathway for metabolic control of ROS production in vivo, while demonstrating that inhibition of ischaemic succinate accumulation and its oxidation upon subsequent reperfusion is a potential therapeutic target to decrease IR injury in a range of pathologies.
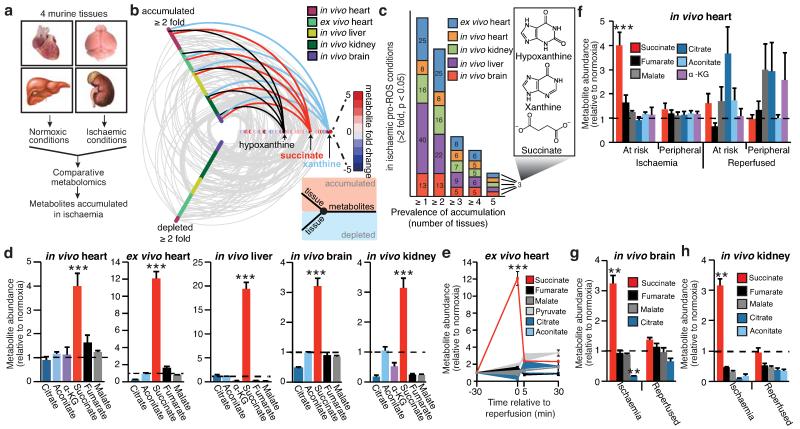
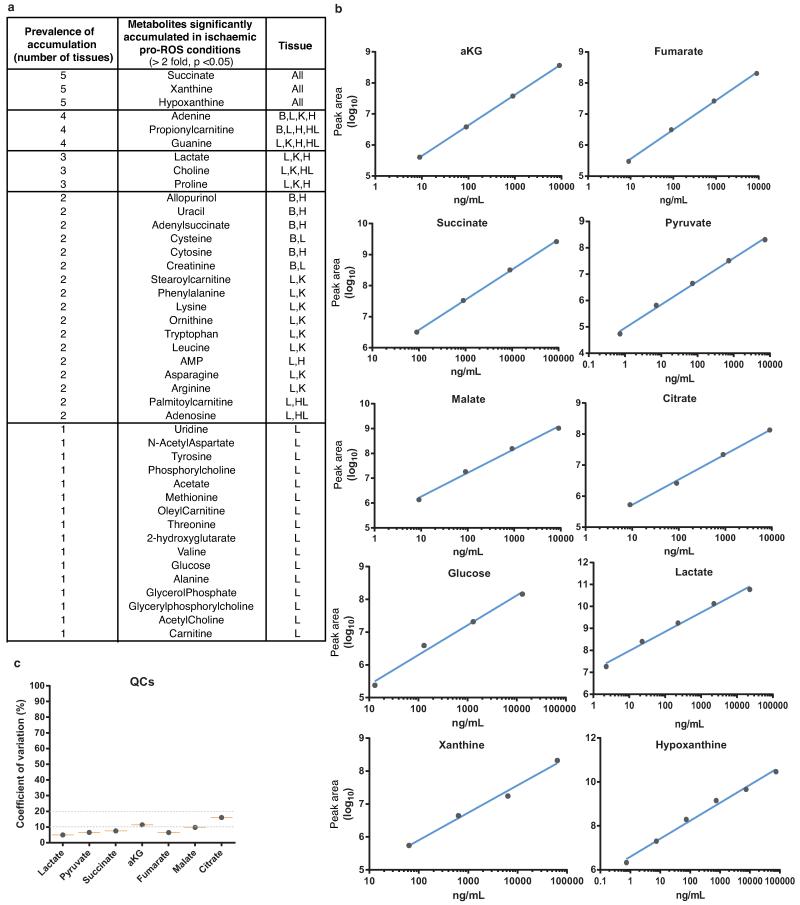
Mitochondrial ROS production is a critical early driver of IR injury, but has been considered a non-specific consequence of the interaction of a dysfunctional respiratory chain with oxygen during reperfusion1-4. Here we investigated an alternative hypothesis: that mitochondrial ROS during IR are generated by a specific metabolic process. To do this we developed a comparative metabolomics approach to identify conserved metabolic signatures in tissues during IR that might indicate the source of mitochondrial ROS (Fig. 1a). Liquid chromatography-mass spectrometry (LC-MS)-based metabolomic analysis of murine brain, kidney, liver and heart subjected to ischaemia in vivo (Fig. 1a) revealed changes in several metabolites (Supplementary Table 1). However, comparative analysis (Supplementary Tables 2 and 3) revealed only three were elevated across all tissues (Fig. 1b, c, and Extended Data Fig. 1a). Two metabolites were well-characterised by-products of ischaemic purine nucleotide breakdown, xanthine and hypoxanthine6, corroborating the validity of our approach. Xanthine and hypoxanthine are metabolised by cytosolic xanthine oxidoreductase and do not contribute to mitochondrial metabolism7. The third metabolite, the mitochondrial CAC intermediate succinate, increased 3- to 19-fold to concentrations of 61-729 ng/mg wet weight across the tested tissues (Fig. 1d, Supplementary Table 4 and Extended Data Fig. 1b,c) and was the sole mitochondrial feature of ischaemia that occurred universally in a range of metabolically diverse tissues. Therefore we focused on the potential role of succinate in mitochondrial ROS production during IR.
Figure 1.
Comparative metabolomics identifies succinate as a potential mitochondrial metabolite that drives reperfusion ROS production. a, Comparative metabolomics strategy. b, HIVE plot comparative analysis. All identified metabolites are identified on the horizontal axis, while those accumulated (top axis) or depleted (bottom axis) in a particular ischaemic tissue are indicated by a connecting arc. Metabolites accumulated commonly across all tissues are highlighted. c, Prevalence of accumulation of metabolites in murine tissues during ischaemia. d, Profile of mitochondrial CAC metabolite levels following ischaemia across five ischaemic tissue conditions. (in vivo heart n = 5; succinate and fumarate n = 9), (ex vivo heart n = 4), (liver n = 4), (brain n = 3), (kidney n = 4). e, Time course of CAC metabolite levels during myocardial ischaemia and reperfusion for 5 min in the ex vivo heart (n = 4). f, CAC metabolite levels during in vivo myocardial IR in at risk and peripheral heart tissue following ischaemia and after 5 min reperfusion. (n = 5; succinate and fumarate n = 9). g, CAC metabolite levels during in vivo brain IR following ischaemia and following 5 min reperfusion (n = 3). h, CAC metabolite levels during in vivo kidney IR following ischaemia and after 5 min reperfusion (n = 4; aconitate n = 3). ** p < 0.01, *** p < 0.001. Data are shown as the mean ± s.e.m of at least three biological replicates.
Since mitochondrial ROS production occurs early in reperfusion1-4,8,9, it follows that metabolites fuelling ROS should be oxidised quickly. Strikingly, the succinate accumulated during ischaemia was restored to normoxic levels by 5 minutes reperfusion ex vivo in the heart (Fig. 1e), and this was also observed in vivo in the heart (Fig. 1f and Extended Data Fig. 2a), brain (Fig. 1g) and kidney (Fig. 1h). Of note, the accumulation of succinate by the in vivo heart was proportional to the duration of ischaemia (Extended Data Fig. 2a). These changes in succinate were localised to areas of the tissues where IR injury occurred in vivo, and took place without accumulation of other CAC metabolites (Fig. 1f-h). These data demonstrate that, uniquely, succinate accumulates dramatically during ischaemia and is then rapidly metabolised upon reperfusion at the same time as mitochondrial ROS production increases.
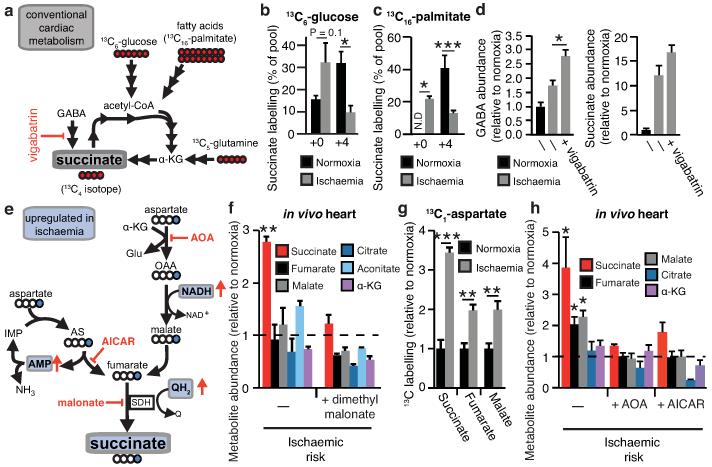
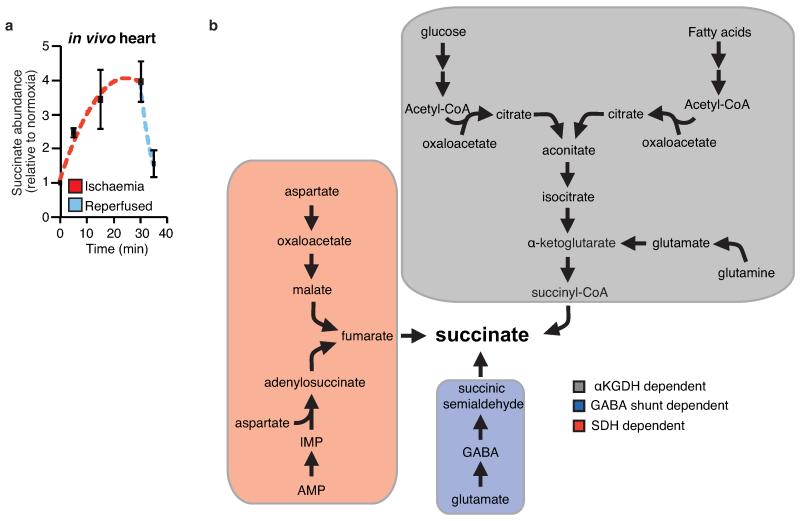
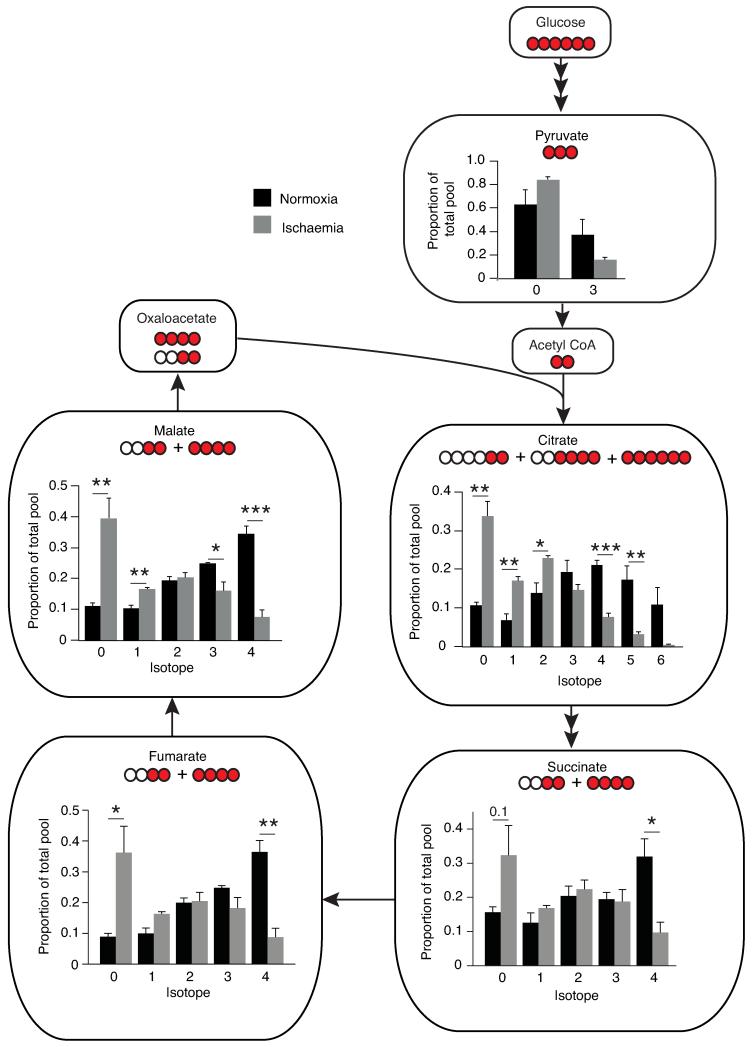
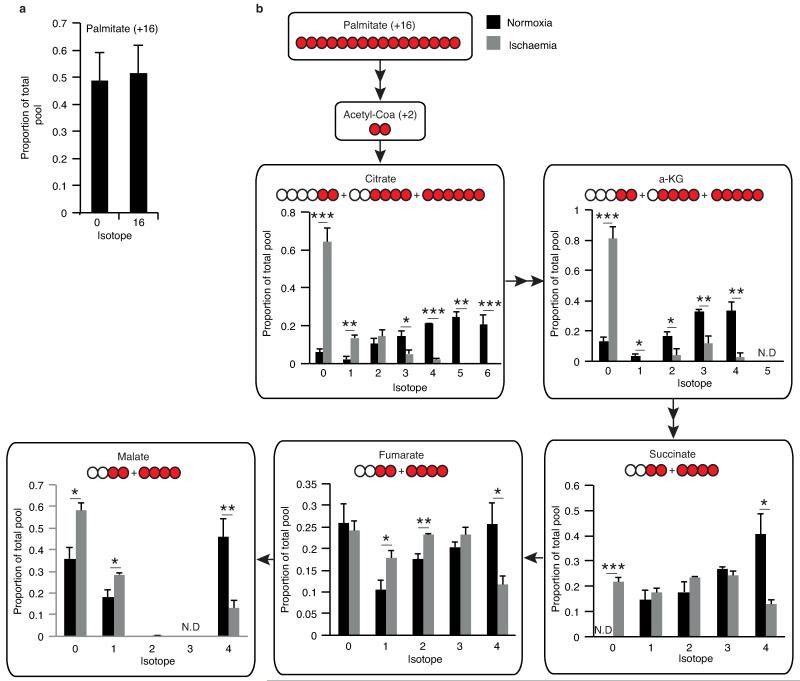
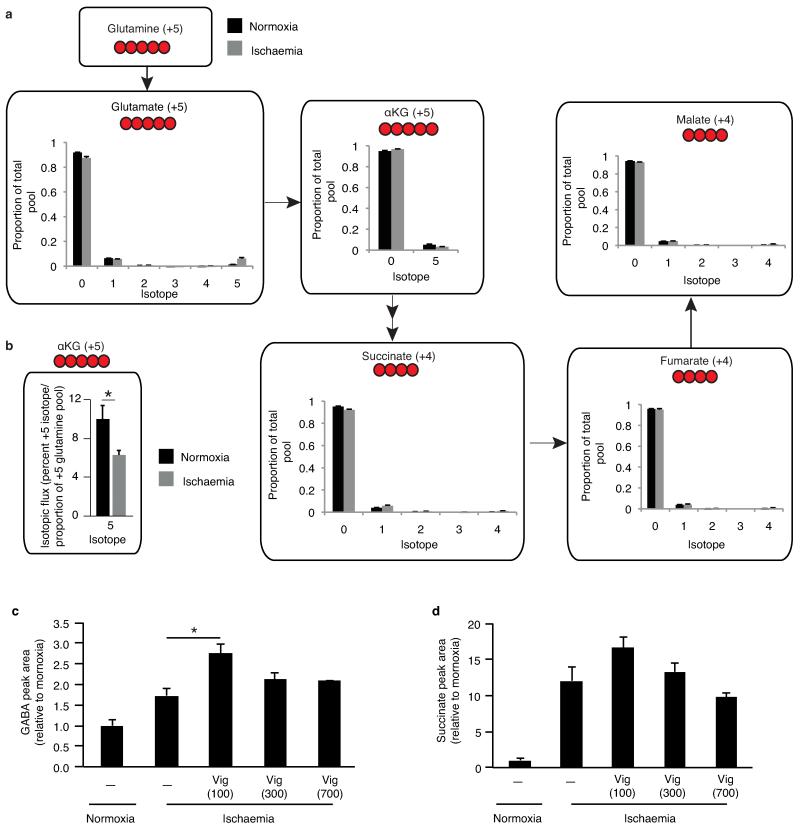
To determine the mechanisms responsible for succinate accumulation during ischaemia and explore its role in IR injury we focused on the heart, because of the many experimental and theoretical resources available. In mammalian tissues succinate is generated by the CAC, via oxidation of carbons from glucose, fatty acids, glutamate, and the γ-aminobutyric acid (GABA) shunt (Fig. 2a, Extended Data Fig. 2b)10,11. To assess the contribution of these carbon sources to the build-up of ischaemic succinate we performed an array of 13C-isotopologue labeling experiments in the ex vivo perfused heart followed by LC-MS analyses. Glucose is a major carbon source for the CAC therefore ischaemic CAC flux to succinate was first investigated by measuring its isotopologue distribution following infusion with 13C-labelled glucose (Fig. 2a). As expected, 13C-glucose was quickly oxidised via the CAC under normoxia, as indicated by the diagnostic m+2 and m+4 isotopologues of the CAC intermediates (Fig. 2b and Extended Data Fig. 3). However, the contribution of 13C-glucose to succinate was significantly reduced in ischaemic hearts (Fig. 2b and Extended Data Fig. 3). We then assessed the contribution of fatty acid oxidation to the CAC activity by perfusing hearts with 13C-palmitate (Fig. 2a and Extended Data Fig. 4a). The CAC was readily enriched in 13C-carbons derived from palmitate oxidation (Extended Data Fig. 4b). However, the contribution of 13C-palmitate to succinate was strikingly decreased during ischaemia (Fig. 2c and Extended Data Fig. 4b). Glutamine was not a major carbon source for CAC metabolites in normoxia or ischaemia (Extended Data Fig. 5a) and the minimal 13C-glutamine incorporation to α-ketoglutarate was decreased in ischaemia (Extended Data Fig. 5b). Finally, inhibition of the GABA shunt with vigabatrin (Fig. 2a)10 did not decrease ischaemic succinate accumulation (Fig. 2d and Extended Data Fig. 5c,d). Together, these data demonstrate that the major carbon sources for the CAC under normoxia do not significantly contribute to the buildup of succinate during ischaemia, indicating that succinate accumulation is not caused by conventional operation of cardiac metabolism.
Figure 2.
Reverse SDH activity drives ischaemic succinate accumulation by the reduction of fumarate. a, Potential inputs to succinate-directed flux by conventional cardiac metabolism and 13C-metabolite labelling strategy. b, c, 13C isotopologue profile of succinate in the normoxic and ischaemic myocardium following infusion of (b) 13C-glucose and (c) 13C-palmitate (n = 4). d, Effect of inhibition of GABA shunt with vigabatrin on GABA and succinate levels in the ischaemic myocardium (n = 4; ischaemia n = 5). e, Summary of in silico metabolic modelling of potential drivers of ischaemic succinate accumulation, and 13C-aspartate metabolic labelling strategy. f, Effect of SDH inhibition by dimethyl malonate on CAC metabolite abundance in the ischaemic myocardium in vivo (n = 3). g, Relative incorporation of 13C-aspartate to the indicated CAC metabolites in the normoxic and ischaemic myocardium (n = 4). h, Effect on CAC metabolite abundance in the ischaemic myocardium in vivo of blocking aspartate entry into the CAC through AOA-mediated inhibition of aspartate aminotransferase, or blocking PNC by inhibition of adenylosuccinate lyase with AICAR (n = 3). * p < 0.05, ** p < 0.01, *** p < 0.001. Data are shown as the mean ± s.e.m of at least three biological replicates.
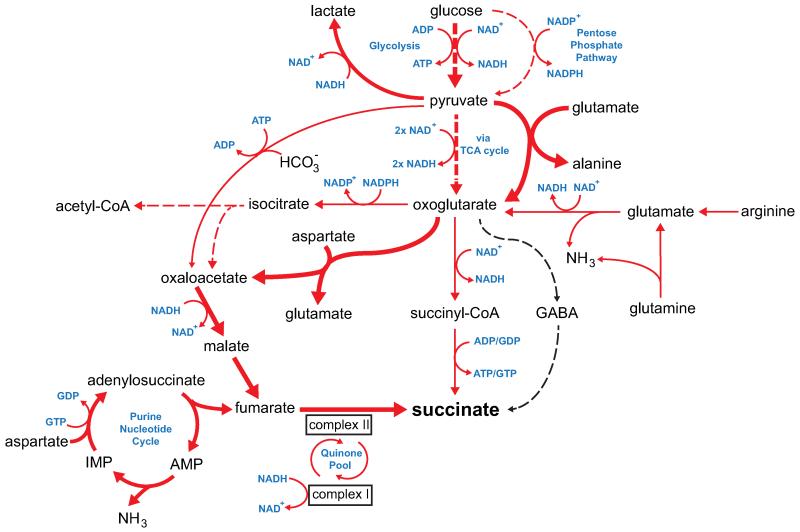
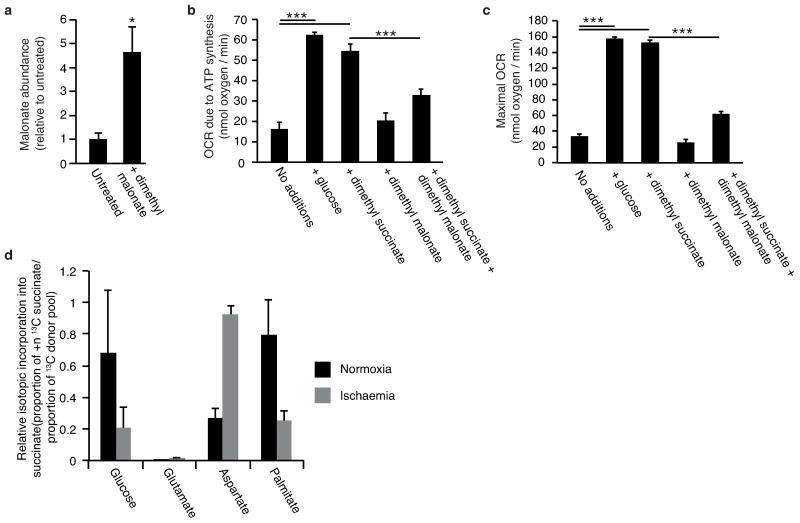
To explore other mechanisms that could lead to succinate accumulation during ischaemia, we considered earlier speculations that during anaerobic metabolism SDH might act in reverse to reduce fumarate to succinate12-14. While SDH reversal has not been demonstrated in ischaemic tissues, in silico flux analysis determined succinate production by SDH reversal during ischaemia as the best solution to sustain proton pumping and ATP production when metabolites including fumarate, aspartate and malate were available (Fig. 2e, Extended Data Fig. 6, and Supplementary Tables 5 and 6). The model predicted that fumarate supply to SDH came from two converging pathways: the malate/aspartate shuttle (MAS), where the high NADH/NAD ratio during ischaemia drives malate formation that is converted to fumarate14-16; and AMP-dependent activation of the purine nucleotide cycle (PNC) that drives fumarate production17,18 (Fig. 2e and Extended Data Fig. 6). To test this prediction experimentally, we infused mice with dimethyl malonate, a membrane-permeable precursor of the SDH competitive inhibitor malonate (Extended Data Fig. 7a-c)19,20. Dimethyl malonate infusion strikingly decreased succinate accumulation in the ischaemic myocardium (Fig. 2f). This result indicates that SDH operates in reverse in the ischaemic heart, as inhibition of SDH operating in its conventional direction would have further increased succinate (Fig. 2a, Extended Data Fig. 6 and Supplementary Tables 5 and 6). Therefore succinate accumulates during ischaemia from fumarate reduction by the reversal of SDH.
Since aspartate is a common carbon source for fumarate in both the PNC and the MAS pathways (Fig. 2e), we used 13C-labelled aspartate to evaluate the contribution of these pathways to succinate production during ischaemia. 13C-aspartate infusion significantly increased 13C-succinate content of the ischaemic myocardium compared to normoxia (Fig. 2g). In fact, 13C-aspartate was the only 13C-carbon donor that incorporated substantially into succinate during ischaemia (Extended Data Fig. 7d). To characterise the relative contributions of the MAS and PNC to ischaemic succinate accumulation we used aminooxyacetate (AOA), which inhibits aspartate aminotransferase in the MAS21 (Fig. 2e) and 5-amino-1-β-D-ribofuranosyl-imidazole-4-carboxamide (AICAR), which inhibits adenylosuccinate lyase in the PNC18,22 (Fig. 2e). Both inhibitors decreased ischaemic succinate levels (Fig. 2h). Therefore, our results suggest that during ischaemia both the MAS and PNC pathways increase fumarate production, which is then converted to succinate by SDH reversal.
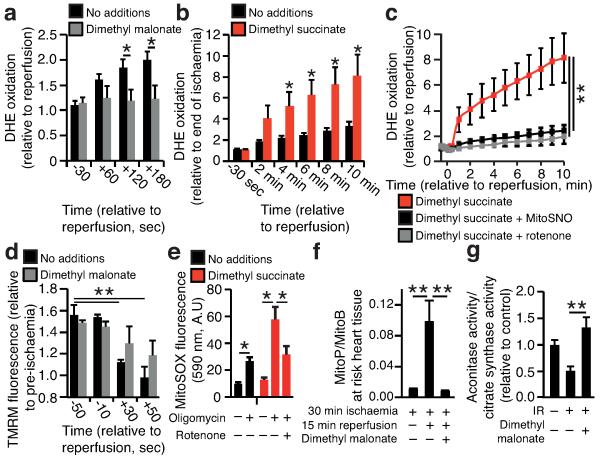
To investigate the potential mechanisms underlying succinate-driven mitochondrial ROS production we modelled in silico changes in ischaemic cardiac metabolism upon reperfusion. The simulations predicted that SDH oxidises the accumulated succinate and, with complex III and IV at full capacity, drives reverse electron transport (RET) through mitochondrial complex I23-26 (Extended Data Fig. 8a-c). Intriguingly, succinate drives extensive superoxide formation from complex I by RET in vitro, making it a compelling potential source of mitochondrial ROS during IR26. However, the role of complex I RET in IR injury has never been demonstrated. To test whether the succinate accumulated during ischaemia could drive complex I RET upon reperfusion, we tracked mitochondrial ROS with the fluorescent probe dihydroethidine (DHE), and mitochondrial membrane potential from the potential-sensitive fluorescence of tetramethylrhodamine methyl ester (TMRM), in a primary cardiomyocyte model of IR injury27. DHE was rapidly oxidised upon reperfusion, consistent with increased superoxide production (Fig. 3a)27. Inhibition of SDH-mediated ischaemic succinate accumulation with dimethyl malonate reduced DHE oxidation upon reperfusion (Fig. 3a). To further assess the role of succinate in driving ROS production, we employed a cell permeable derivative of succinate, dimethyl succinate, which is readily taken up by cells, where it is then hydrolysed thereby increasing succinate levels (Extended Data Fig. 7b,c). Addition of dimethyl succinate to ischaemic primary cardiomyocytes significantly amplified reperfusion DHE oxidation, suggesting that succinate levels controlled the extent of reperfusion ROS (Fig. 3b). Importantly, selective inhibition of complex I RET with rotenone (Fig. 3c and Extended Data Fig. 9a) or MitoSNO (Fig. 3c) abolished both ischaemic succinate and dimethyl succinate-driven DHE oxidation upon reperfusion, indicating that ischaemic succinate levels drove superoxide production through complex I RET. Succinate-dependent RET was further supported by the observation that NAD(P)H oxidation at reperfusion was suppressed by increasing succinate levels with dimethyl succinate (Extended Data Fig. 9 b,c). Tracking the mitochondrial membrane potential revealed that inhibition of ischaemic succinate accumulation with dimethyl malonate slowed the rate of mitochondrial repolarisation upon reperfusion (Fig. 3d and Extended Data Fig. 9d-f), consistent with accelerated repolarisation through RET at complex I driven by succinate upon reperfusion. Elevating succinate in C2C12 mouse myoblast cells with dimethyl succinate while hyperpolarising mitochondria with oligomycin increased MitoSOX oxidation independently of IR (Fig. 3e), suggesting that combining high succinate levels with a large protonmotive force is sufficient to drive complex I ROS production by RET.
Figure 3.
Ischaemic succinate levels control ROS production in adult primary cardiomyocytes and in the heart in vivo. a, b, DHE oxidation during late ischaemia and early reperfusion ± (a) inhibition of ischaemic succinate accumulation (no additions n = 6; dimethyl malonate n = 5) or (b) addition of dimethyl succinate during ischaemia (n = 6). c, Inhibition of mitochondrial complex I RET reduces DHE oxidation on reperfusion following addition of dimethyl succinate. Ischaemia (Isch). (n = 5; dimethyl succinate n = 6). d, Effect of dimethyl malonate on mitochondrial repolarisation at reperfusion as determined by the rate of TMRM quenching (n = 3). e, Effect of dimethyl succinate and oligomycin on mitochondrial ROS in aerobic C2C12 myoblasts (n = 4). f, g. Effect of inhibition of ischaemic succinate accumulation by dimethyl malonate on mitochondrial ROS during IR injury in vivo assessed by (f) MitoB oxidation (n = 5; dimethyl malonate n = 6), and by (g) aconitase inactivation (n = 4). * p < 0.05, ** p < 0.01. Data are shown as the mean ± s.e.m of at least three biological replicates. For cell data replicates represent separate experiments on independent cell preparations.
We next investigated whether succinate-driven complex I RET leads to ROS production in the heart in vivo, during IR injury. To do this we used the ratiometric mass spectrometric mitochondria-targeted ROS probe MitoB8. This probe is rapidly taken up by mitochondria in the heart in vivo and then oxidised to MitoP by the ROS hydrogen peroxide and peroxynitrite. Consequently measuring the MitoP/MitoB ratio by LC-MS/MS indicates changes in mitochondrial ROS in vivo8. At the onset of cardiac reperfusion there was an increase in the MitoP/MitoB ratio and this increase was prevented by blocking the accumulation of ischaemic succinate with dimethyl malonate (Fig 3f). Furthermore, the activity of the mitochondrial superoxide-sensitive CAC enzyme aconitase was decreased in the first minutes of reperfusion and this oxidative damage was also prevented by infusing dimethyl malonate during ischaemia to prevent succinate accumulation (Fig 3g). Together these data indicate that succinate oxidation upon reperfusion drives a burst of mitochondrial ROS production from complex I by RET during cardiac IR injury in vivo, and that this ROS production is prevented by dimethyl malonate.
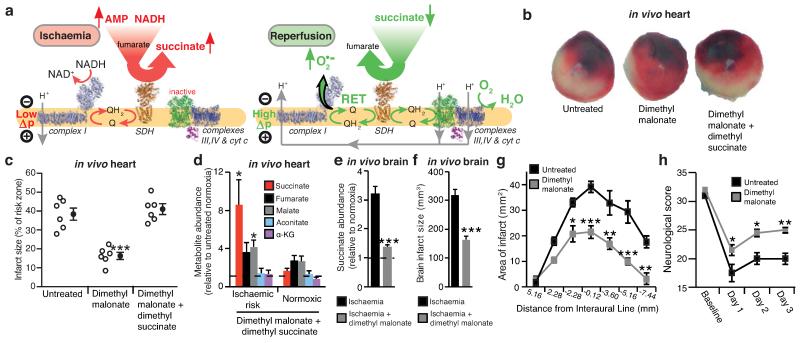
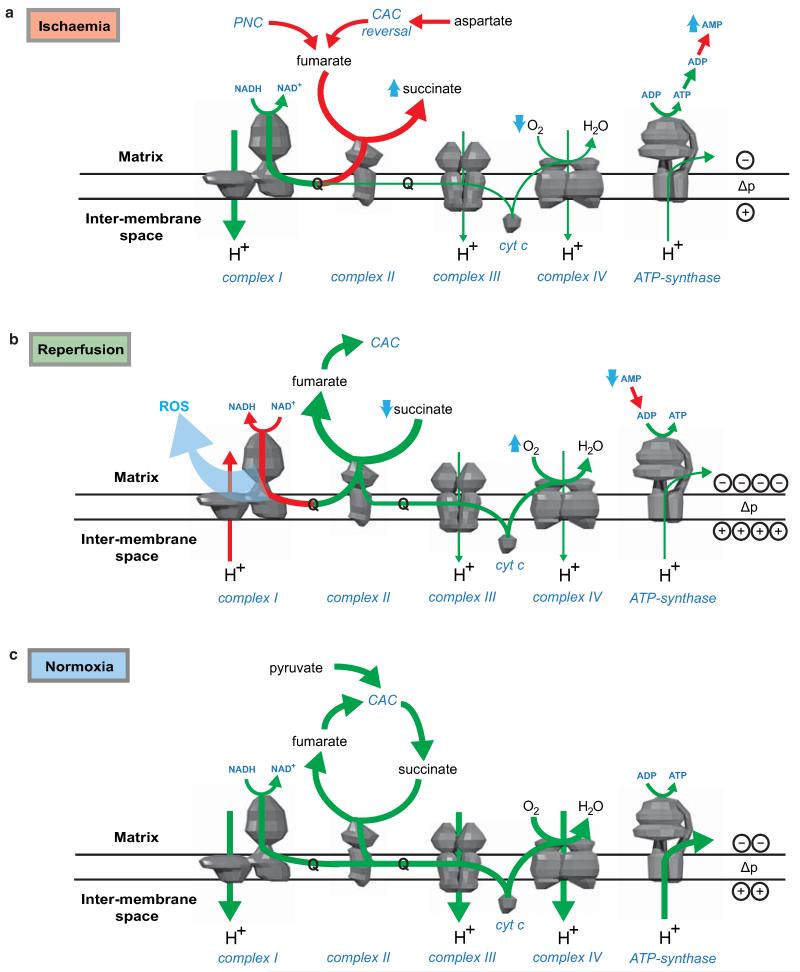
Our findings suggest the following model (Fig. 4a): during ischaemia fumarate production increases, through activation of the MAS and PNC, and is then reduced to succinate by SDH reversal. Upon reperfusion, the accumulated succinate is rapidly oxidised to maintain the Q pool reduced, thereby sustaining a large protonmotive force by conventional electron transport through complexes III and IV to oxygen, while also driving RET at complex I to produce the mitochondrial ROS that initiate IR injury26. This model provides a unifying framework for many hitherto unconnected aspects of IR injury, such as the requirement for time-dependent priming during ischaemia to induce ROS upon reperfusion, protection against IR injury by the inhibition of complexes I8 and II28, and by mild uncoupling29.
Figure 4.
NADH and AMP sensing pathways drive ischaemic succinate accumulation to control reperfusion pathologies in vivo through mitochondrial ROS production. a, Model of succinate accumulation during ischaemia and superoxide formation by RET during reperfusion. b, Representative cross-sections from mouse hearts following myocardial infarction ± inhibition of ischaemic succinate accumulation and reintroduction of ischaemic succinate. Infarcted tissue is white, the rest of the area at risk is red, and non-risk tissue is dark blue. c, Quantification of myocardial infarct size as described in (b). (n = 6). d, Effect of i.v infusion of dimethyl succinate in combination with SDH inhibition by dimethyl malonate on CAC metabolite abundance in the ischaemic myocardium in vivo (n = 4). e, Effect of i.v infusion of dimethyl malonate on succinate accumulation in the ischaemic brain in vivo (n = 4). f-h, Protection by dimethyl malonate against brain IR injury in vivo. Quantification of brain infarct volume (f) and rostro-caudal infarct distribution (g) ± dimethyl malonate following brain IR injury by tMCAO in vivo (untreated n = 6; dimethyl malonate n = 4). (h) Neurological scores for rats following tMCAO ± dimethyl malonate (untreated n = 6; dimethyl malonate n = 4). * p < 0.05, ** p < 0.01, *** p < 0.001. Data are shown as the mean ± s.e.m of at least three biological replicates, except for h, for which data are median ± C.I.
Intriguingly, our model also generates an unexpected, but testable, prediction. Manipulation of the pathways that increase succinate during ischaemia and oxidise it upon reperfusion should determine the extent of IR injury. Since the reversible inhibition of SDH blocks both succinate accumulation during ischaemia (Fig. 2f) and its oxidation upon reperfusion, it should protect against IR injury in vivo. Intravenous (i.v.) infusion of dimethyl malonate, a precursor of the SDH inhibitor malonate, during an in vivo model of cardiac IR injury was protective (Fig. 4b,c). Importantly, this cardioprotection was suppressed by adding back dimethyl succinate (Fig. 4b,c and Extended data Fig 10a), which restored elevated levels of ischaemic succinate (Fig. 4d) indicating that protection by dimethyl malonate resulted solely from blunting succinate accumulation. Finally, i.v. infusion of dimethyl malonate during rat transient middle cerebral artery occlusion (tMCAO), an in vivo model of brain IR injury during stroke, also suppressed ischaemic accumulation of succinate (Fig. 4e and Extended Data Fig. 10b) and was protective, reducing the pyknotic nuclear morphology and vacuolation of the neuropil (Extended Data Fig. 10c), decreasing the volume of infarcted brain tissue caused by IR injury (Fig. 4f,g) and preventing the decline in neurological function and sensorimotor function associated with stroke (Fig. 4h and Extended Data Fig. 10d). These findings support our model of succinate-driven IR injury, demonstrating that succinate accumulation underlies IR injury in the heart and brain and suggests decreasing succinate accumulation and oxidation as a new therapeutic approach for IR injury.
We have demonstrated that accumulation of succinate, via fumarate production and reversal of SDH, is a universal metabolic signature of ischaemia in vivo. In turn, succinate is a primary driver of the mitochondrial ROS production upon reperfusion that underlies IR injury in a range of tissues. Ischaemic accumulation of succinate may be of further relevance via its role in inflammatory and hypoxic signalling10. Thus succinate could contribute to both the acute pathogenesis of IR injury by mitochondrial ROS, and then upon secretion also trigger inflammation and neovascularisation30. This further suggests that mitochondrial ROS produced by RET at complex I may normally act as a redox signal from mitochondria that responds to changes in electron supply to the Q pool and ATP demand, but is grossly over-activated in IR injury. Besides elucidating the metabolic responses that underlie IR injury, these data demonstrate that preventing succinate accumulation during ischaemia is protective against IR injury in vivo, suggesting novel therapeutic targets for IR injury in pathologies such as heart attack and stroke.
METHODS
Animal procedures and ethics statement
All animal experiments described were carried out in accordance with the UK Home Office Guide on the Operation of Animal (Scientific Procedures) Act of 1986. The mice used were C57BL/6J. The following project licences were used**:** Krieg (PPL 80/2374), Shattock (PPL 70/7491), Work (PPL 60/4286) and Saeb-Parsy (PPL 80/2638).
In vivo mouse myocardial experiments
For the in vivo heart IR model an open-chest, in situ heart model was used31,32. Male mice (8–10 weeks; Charles River Laboratories, UK) were anaesthetised with sodium pentobarbital (70 mg/kg intraperitoneally (i.p.)), intubated endotracheally and ventilated with 3 cm H2O positive-end expiratory pressure. Adequacy of anaesthesia was monitored using corneal and withdrawal reflexes. Ventilation frequency was kept at 110 breaths per minute with tidal volume between 125 - 150 μL. A thoracotomy was performed and the heart exposed by stripping the pericardium. A prominent branch of the left anterior descending coronary artery (LAD) was surrounded by a 7-0 Prolene suture that was then passed through a small plastic tube. Ischaemia was induced by tightening the tubing against the heart surface. To assess metabolites during IR in vivo, mice were divided into four groups: 5 min ischaemia, 30 min ischaemia, 30 min ischaemia plus 5 min reperfusion and 30 min sham-operation in which the suture was placed but the LAD was not occluded. At the end of each protocol tissue was removed from the at risk and peripheral areas of the heart, selected visually by comparing white versus red tissue, and snap-frozen in liquid nitrogen. Sham-operated tissue was removed from the presumed risk zone.
Infarct size was assessed after 30 min of ischaemia followed by 120 min reperfusion using 2% triphenyltetrazolium chloride staining and is expressed as a percentage of the risk zone33. Metabolic inhibitors (all from Sigma) in sterile saline were infused i.v. via a tail vein 10 min prior to and throughout ischaemia at the following doses: dimethyl malonate (4 mg/kg/min), AOA (50 μg/kg/min; Fluorochem) and AICAR 10 mg/kg/min). Dimethyl succinate (8 mg/kg/min) was infused in combination with dimethyl malonate. Control mice were infused with sterile saline. The total volume administered never exceeded 200 μL/mouse.
Mitochondrial ROS during cardiac IR were assessed by iv injection of 50 nmol of MitoB immediately prior to dimethyl malonate or saline infusion as described previously. Hearts were snap-frozen in liquid nitrogen following 30 mins ischaemia and 15 mins reperfusion. For mice subjected to ischaemia only MitoB was administered at an earlier time-point so that probe incubation was time-matched for all groups. ROS was then assessed by determination of the MitoP/MitoB ratio by LC-MS/MS relative to deuterated internal standards8.
Ex vivo Langendorff heart experiments for metabolomic analysis
Mice were heparinised (200 U i.p.) and anaesthetised with sodium pentobarbital (100 mg/kg i.p.). The chest was then opened and the heart rapidly excised and arrested in cold Krebs-Henseleit (KH) buffer (0.5 mM EDTA, 118 mM NaCl, 4.7 mM KCl, 25 mM NaHCO3, 11 mM glucose, 1.2 mM MgSO4, 1.2 mM KH2PO4 and 2 mM CaCl2) at pH 7.4. The aorta was then cannulated with a 22 G blunt needle and transferred to a perfusion apparatus. The heart was perfused with 37°C KH buffer (95% O2/5% CO2) at a constant pressure of 80 mm Hg. After 20 min equilibration hearts were separated into four groups: 60 min normoxic perfusion; 30 min global ischaemia; 30 min global ischaemia plus 5 min reperfusion; and 30 min global ischaemia plus 30 mins reperfusion. Metabolic inhibitors were infused for 10 min prior to ischaemia through a side port above the aortic cannula at 1% of coronary flow. At the end of the experiments the hearts were snap-frozen in liquid nitrogen and stored at −80°C.
13C metabolite labelling in ex vivo Langendorff heart experiments
Mice were anaesthetised with sodium pentobarbital (~140 mg/kg). Hearts were rapidly excised, cannulated and perfused in the isovolumic Langendorff mode at 80 mm Hg perfusion pressure, at 37°C with KH buffer continuously gassed with 95% O2/5% CO2 (pH 7.4)34. Cardiac function was assessed using a fluid-filled balloon inserted into the left ventricle (LV), and connected to a pressure transducer and a PowerLab system (ADInstruments, UK). Balloon volume was adjusted to an initial LV diastolic pressure of 4 - 9 mm Hg34 and all hearts were paced at 550 bpm. Left ventricular developed pressure (LVDP) was calculated from the difference between systolic (SP) and diastolic pressures (DP). Functional parameters (SP, end diastolic pressure, heart rate, LVDP, coronary flow, perfusion pressure) were recorded continuously using LabChart software v.7 (ADInstruments, UK).
After 20 min equilibration with standard KH buffer, hearts were divided into the following groups: perfused with KH buffer containing 11 mM U-13C Glucose followed by 30 min normoxic respiration (n=4/group); perfused for 10 min with glucose-free KH buffer containing 11 mM U-13C glucose and then subjected to 30 min global normothermic ischaemia (n=4/group); perfused with KH buffer containing 0.3 mM U-13C potassium palmitate for 10 min followed by: continued perfusion for 30 min normoxic respiration (n=4/group), or 30 min global normothermic ischaemia (n=4/group); perfusion of KH buffer containing 1 mM 5-13C L-glutamine for 10 min followed by standard normoxic perfusion for 30 min with unlabeled KH buffer (n=4);10 min perfusion with 1 mM 13C5 L-glutamine, followed by 30 min global ischaemia (n=4); 10 min perfusion of 1mM 1-13C L-aspartic acid, followed by normoxic perfusion for 30 min with unlabeled KH buffer; 10 min perfusion with 1mM 1-13C L-aspartic acid, followed by 30 min global ischaemia. At the end hearts were snap frozen in liquid nitrogen and stored at −80°C.
In vivo rat brain ischaemia and reperfusion
Male spontaneously hypertensive stroke prone (SHRSP) rats from the colony maintained at the University of Glasgow (270–310 g) were anaesthetised with 5% isoflurane in oxygen and were intubated and ventilated throughout surgery (~2.5% isoflurane/oxygen). Body temperature was maintained at 37 ± 0.5°C. Animals underwent pre-stroke burrhole surgery35 before transient middle cerebral artery occlusion (tMCAO, 45 min). Briefly, a silicone-coated monofilament (Doccol Corporation, USA) was advanced through the common carotid artery to block the origin of the MCA36. Animals were maintained under anaesthesia during ischaemia. Immediately following removal of the filament, or after 5 mins of reperfusion, the brain was removed following cervical dislocation and infarct tissue separated from surrounding tissue on the ipsilateral side and snap-frozen in liquid nitrogen for metabolomic analysis. Corresponding regions were taken from the contralateral side. A separate group was infused with dimethyl malonate (6 mg/kg/min) by i.v. infusion 10 min prior to and during tMCAO) or carrier, allowed to recover for 3 days, over which time they were scored for neurological function37 as modified38, and locomotor and sensorimotor activity by the tapered beam walk test, quantifying the average number of footfalls as described previously38. These rats were then sacrificed by transcardiac perfusion fixation and the infarct area was assessed across 7 coronal levels following hematoxylin and eosin staining39.
In vivo mouse renal ischaemia and reperfusion
Under isofluorane general anaesthesia, mice underwent laparotomy and exposure of the renal hilum bilaterally. Vascular clips (8 mm, InterFocus Fine Science Tools, Cambridge, UK) were placed over one renal hila to induce unilateral renal ischaemia. At the end of 45 min ischaemia the clip was removed and reperfusion of the kidney noted as return of blush colour and visualisation of flow from the renal vein. Kidneys were taken at the end of ischaemia, or following 5 min reperfusion and snap-frozen in liquid nitrogen for metabolomic analysis.
In vivo mouse liver warm ischaemia
Mice were killed by cervical dislocation to ensure cessation of blood flow. Liver tissue was maintained in situ in the body cavity for 45 min at 37°C through use of a thermostated heat pad followed by removal and snap-freezing on liquid nitrogen for subsequent metabolomic analysis.
Metabolomic analyses
Equal amounts wet weight murine tissue were lysed in 250 μL extraction solution (ES; 30% acetonitrile, 50% methanol and 20% water) per 10 mg tissue in Precellysis 24 vials, following the manufacturer’s instructions. The suspension was immediately centrifuged (16,000 g, 15 min at 0°C) and the supernatant used for LC-MS analysis. For the LC separation, column A was Sequant Zic-Hilic (150 mm × 4.6 mm, internal diameter 3.5 μm) with a guard column (20 mm × 2.1 mm 3.5 μm) from HiChrom, Reading, UK. Mobile phases. A: 0.1% formic acid (v/v) in water. B: 0.1% formic acid (v/v) in acetonitrile. Flow rate 300 μL/min. Gradient: 0-3 min 80 % B, 25 min 20% B, 26 min 80 % B, 36 min 80% B. Column B was sequant Zic-pHilic (150 mm × 2.1 mm i.d. 3.5 μm) with guard column (20 mm × 2.1 mm i.d. 3.5 μm) from HiChrom, Reading, UK. Mobile phases. C: 20 mM ammonium carbonate plus 0.1% ammonium hydroxide in water. D: acetonitrile. Flow rate 100 μL/min. Gradient: 0 min 80% D, 28 min 20% D, 29 min 80% D, 45 min 80% D. The mass spectrometer (Thermo QExactive Orbitrap) was operated in full MS and polarity switching mode. Samples were randomised in order to avoid machine drifts. Spectra were analysed using both targeted and untargeted approaches. For the targeted approach spectra were analysed using XCalibur Qual Browser and XCalibur Quan Browser softwares (Thermo Scientific) by referencing to an internal library of compounds. For the untargeted approach spectra were processed with Sieve 2.0 software (Thermo Scientific) and spectral peaks were extracted. The arrays of spectra were then statistically analysed using the functions explore.data and univariate of the R package muma40. Statistical analysis of datasets followed established parameters for determination of significance and data distribution for metabolomics datasets40,41. Briefly, Shapiro Wilk’s test for normality was performed for every metabolite in each experimental condition. When the p-value from Shapiro Wilk’s test was greater than 0.05, Welch’s t Test was performed, otherwise Wilcoxon-Mann Whitney Test was performed. P-values were corrected for multiple testing using Benjamini-Hochberg correction. Metabolite abundance differences were considered significant when final corrected p-value was lower than 0.05.
In situ ischaemia and reperfusion of adult rat primary cardiomyocytes
Male Sprague-Dawley rats (300-370 g) were terminally anaesthetised via IP injections of 200 mg/kg sodium pentobarbitone and 330 U/kg heparin. Hearts were excised and retrograde perfused on a Langendorff-perfusion system with 13 mL/min oxygenated KH buffer at 37°C. Cells were isolated by collagenase digestion using standard methods42. Briefly, hearts were perfused for 5 min with KH buffer, then 5 min with Ca2+-free KH buffer containing 100 μM EGTA, followed by 8 min with KH buffer containing 100 μM CaCl2 and 0.5 mg/ml collagenase II (Worthington). The heart was removed from the cannula and ventricles quickly chopped and bathed in 20 mL of the same collagenase buffer for 15 min. Digested tissue was passed through a 100 μm cell filter, and cells were collected by gravity. The supernatant was removed and cells were washed with KH buffers containing first 0.5 mM CaCl2, then 1 mM CaCl2. Typical yields were 2 × 10⁶ cells/heart with 90% viable, rod-shaped cells. The cells were resuspended in Medium 199 (supplemented with 5 mM creatine, 2 mM carnitine, 5 mM taurine, and 100 μg/mL penicillin/streptomycin) and plated onto coverslips coated with laminin (Sigma). After 1 h incubation at 37°C/5% CO2, unattached cells were washed off, and fresh Medium 199 was added to each well for at least 4 h at 37°C/5% CO2.
Cells were imaged within 36 h of plating. Images using a Zeiss LSM 510 META confocal microscope with a Fluar 20×/0.75NA UV objective, or a microscope equipped with an Orca ER cooled CCD camera (Hamamatsu), a monochrometer (Cairn Research) and emission filter wheel (Prior) with a Fluar 20×/0.75NA objective. Cells attached to coverslips, which formed the base of custom built imaging chambers, were placed on a heated stage at 37°C on the microscope with normoxic recording buffer (156 mM NaCl, 3 mM KCl, 2 mM MgSO4, 1.25 mM K2HPO4, 2 mM CaCl2, 10 mM Hepes, 10 mM D-Glucose; pH 7.4). Simulated ischaemia was achieved by replacing the buffer with a pre-gassed, hypoxic recording buffer simulating ischaemia (as above but lacking glucose and containing 10 mM sodium lactate, 14.8 mM KCl; pH 6.4) and by covering the heated stage with a transparent, gas-impermeant lid, forming a small chamber into which argon was forced to maintain hypoxia. pO2 was routinely measured as < 2.0 mm Hg during simulated ischaemia. To simulate reperfusion, the lid was removed from the chamber, and the buffer replaced with normoxic recording buffer.
Mitochondrial membrane potential was measured using tetramethylrhodamine, methyl ester (TMRM, Life Technologies) in dequench mode. In this mode, mitochondrial depolarisation causes redistribution of a high concentration of quenched TMRM from mitochondria to cytosol, where the lower concentration results in dequenching and an increase in fluorescence27. Cells were loaded at room temperature with normoxic recording buffer containing 3 μM TMRM for 30 min. Prior to imaging, loading buffer was removed and replaced with normoxic recording buffer. TMRM fluorescence was excited at 543 nm and emission was collected using a LP 560 filter.
ROS production was estimated by oxidation of DHE and ratiometric assessment. For this cells were loaded with 5 μM dihydroethidium (DHE, Invitrogen), which remained present throughout normoxic and ischaemic conditions. DHE was excited at 351 nm and the emitted signal was acquired with a BP 435-485 IR filter. Oxidised DHE was excited at 543 nm and emission was collected with a LP 560 filter. NADH autofluorescence was excited at 351 nm and the emitted signal was collected using a BP 435-485IR filter. All measured cell parameters were analysed with Fiji image processing software.
Assessment of succinate-dependent mitochondrial superoxide production in myoblasts
C2C12 myoblasts were seeded in 35 mm glass bottom culture dishes (MatTek) and incubated for 24 h in low glucose (1 g/L) DMEM. 2 h prior to imaging DMEM was removed, and replaced with imaging buffer (132 mM NaCl; 10 mM HEPES; 4.2 mM KCl; 1 mM MgCl2 1 mM CaCl2 adjusted to pH 7.4 with Tris base and supplemented with 2-deoxyglucose (25 μM), and sodium pyruvate (10 mg/L or 4 μM oligomycin as indicated). Myoblasts were pre-incubated with 2 μM MitoSOX for 15 min prior to imaging. MitoSOX fluorescence was monitored using a Nikon Eclipse Ti confocal microscope at 37°C on a temperature controlled stage for 30 min. MitoSOX was excited at 510 nm and the emitted signal collected with a LP 560 filter following the indicated additions.
In silico analysis of metabolic flux during ischaemia and reperfusion
Simulations were performed using an expanded version of the myocardial mitochondrial metabolic model _i_AS25311. The model was expanded to include additional mitochondrial reactions by using the latest version of MitoMiner, a mitochondrial proteomics database43. MitoMiner was used to identify new mitochondrial reactions for inclusion by cross-referencing these data with information from BRENDA44, HumanCyc45 and relevant literature to confirm that the new reactions are present in human, expressed in heart tissue and localised to the mitochondrial matrix. In addition, cytosolic reactions were included that could contribute to energy production, such as amino acid degradation and conversion reactions as well as the purine nucleotide cycle. Protonation states of metabolites in the model were calculated by using the Marvin suite of computational chemistry software (ChemAxon Ltd, Budapest, Hungary). Reactions were then charge-balanced according to the protonation state of the major microspecies found at pH 8.05 for the mitochondrial matrix46 and pH 7.30 for the cytosol. In addition directionality constraints were imposed based upon general rules of irreversibility, thermodynamics and information from public resources such as BRENDA and HumanCyc and capacity constraints were taken from the literature11. The final model contained 227 mitochondrial matrix reactions, 76 cytosolic reactions, 91 transport steps between the two compartments and 84 boundary conditions representing inputs and outputs into the system. The expanded model is a manually curated and highly refined model of the mitochondrion, and as with _i_AS253, no metabolite dead ends were present and all reactions were capable of having flux.
Metabolism of the mitochondrial network was simulated using flux balance analysis, a technique that has been described in detail47. The objective function used to optimise the reaction fluxes was maximum ATP production. All the FBA simulations were carried out using MATLAB R2012b (Math Works, Inc, Natick, MA) with the COBRA Toolbox48, and the linear programming solver GLPK (http://www.gnu.org/software/glpk).
To represent ischaemia, the maximum uptake of oxygen was reduced to 20% of its level under normal conditions (4.0 vs. 19.8 μmol/min/gram dry weight). Simulations were run with boundary conditions for metabolites set to either their normoxic values, or with various metabolites in excess to determine if they could contribute to ATP production under ischaemia. To represent reperfusion, the oxygen level was restored to its normal level and simulations were run with the availability of succinate, lactate, pyruvate and NADH increased to various levels to reflect the ischemic accumulation of these metabolites. The flux capacity of ATP synthase was reduced by up to 50% to represent the delay in generating ADP from AMP required for ATP synthase to function and also to model hyper-polarisation of the mitochondrial membrane, in effect by constraining the efficiency of the other proton pumping complexes of the electron transport chain.
Assessment of mitochondrial aconitase inactivation in mouse heart tissue
Aconitase activity was measured as described previously49. Briefly, following the relevant in vivo intervention (normal respiration, or 30 min ischaemia and 15 min reperfusion ± dimethyl malonate), mouse hearts were rapidly excised and homogenised in mitochondrial isolation buffer (250 mM sucrose, 2 mM EDTA, 10 mM sodium citrate, 0.6 mM MnCl2, 100 mM Tric-HCl, pH 7.4) followed by mitochondrial isolation by differential centrifugation. Samples (10 μL; 1-2μg mitochondrial protein) were added to a 96 well plate and 190 μl assay buffer (50 mM Tris-Cl (pH 7.4), 0.6 mM MnCl2, 5 mM sodium citrate, 0.2 mM NADP+, 0.1% (v/v) Triton X-100, 0.4UmL−1 ICDH). Absorbance was measured at 340 nm for 7 min at 37 °C. To determine the background rate of NADPH reduction, 100 μM fluorocitrate was added in a parallel experiment. In all cases the background NADPH reduction was <10% of the observed rate. In parallel, we determined the citrate synthase activity of each sample50. To control for mitochondrial content we normalised aconitase activity to the citrate synthase activity and expressed the result as a percentage of control levels.
Statistics and experimental design
Data were expressed as mean ± s.e.m and P values were calculated using two-tailed Student’s t-test for pairwise comparisons, and one way ANOVA followed by Bonferroni’s test for multiple comparisons, unless otherwise stated. Experimenters analysing samples from metabolomics, histological, and neurological animal experiments were blinded to the experimental interventions.
Extended Data
Extended Data Figure 1.
Comparative analysis of metabolites significantly accumulated in ischaemic conditions. a, Various murine tissues exposed to sufficient periods of ischaemia to prime for reperfusion ROS production were subjected to targeted LC-MS metabolomics analysis and comparison of metabolites that accumulated significantly when compared to normoxic levels. Following this, metabolites were scored according to the prevalence of their accumulation across five ischaemic tissue conditions. B = brain, H = whole heart ischaemia ex vivo, HL = LAD ischaemia in vivo, K = kidney, L = liver. b, Determination of linearity of the relationship between LC-MS metabolite peak intensity and concentration for CAC and related metabolites. c, Quality control determination of coefficient of variation for LC-MS quantification of CAC and related metabolites.
Extended Data Figure 2.
Timecourse of succinate levels in the in vivo heart during ischaemia and reperfusion and potential metabolic inputs for succinate. a, Time course of succinate levels during myocardial ischaemia and reperfusion for the in vivo heart (5 min and 15 min ischaemia n = 4; 30 min ischaemia n = 9; 5 min reperfused n = 5). b, Summary of the three potential metabolic inputs for succinate-directed ischaemic flux. To understand the metabolic pathways that could contribute to succinate production under ischaemia, an updated version of the iAS253 model of cardiac metabolism was employed to simulate ischaemia using flux balance analysis. The model showed three possible mechanisms for producing succinate: from α-ketoglutarate produced by the CAC, derived from glycolysis, fatty acid oxidation, and glutaminolysis (grey box), from succinic semialdehyde produced from the GABA shunt (blue box), and from fumarate produced from the malate-aspartate shuttle and purine nucleotide cycle (red box) via the reversal of SDH. Data are shown as the mean ± s.e.m of at least four biological replicates.
Extended Data Figure 3.
Metabolic labelling of CAC and proximal metabolites by 13C glucose in the ischaemic and normoxic myocardium. Proportional isotopic labelling profile of CAC and proximal metabolites during normoxic and ischaemic myocardial perfusion. Mouse hearts were perfused with 11 mM 13C glucose for 10 min followed by either 30 min no flow ischaemia or 30 min normoxic perfusion followed by snap-freezing and LC-MS metabolomic analysis (n = 4). * p < 0.05, ** p < 0.01, *** p < 0.001. Data are shown as the mean ± s.e.m of at least four biological replicates.
Extended Data Figure 4.
Metabolic labelling of CAC and proximal metabolites by 13C palmitate in the ischaemic and normoxic myocardium a, Mouse hearts were perfused with 0.3 mM 13C palmitate (+16 labelled) for 10 min resulting in a significant proportion of the endogenous palmitate pool being +16 labelled. Following this, hearts were subjected to either 30 min ischaemia or continued normoxic respiration with 13C palmitate followed by snap-freezing and metabolomic analysis. b, Isotopic flux from palmitate to CAC and proximal metabolites following normoxic and ischaemic myocardial respiration. The isotopic profile for each metabolite is expressed as a proportion of the total pool (n = 4). * p < 0.05, ** p < 0.01, *** p < 0.001. Data are shown as the mean ± s.e.m of at least four biological replicates.
Extended Data Figure 5.
Metabolic labelling of CAC and proximal metabolites by 13C glutamine in the ischaemic and normoxic myocardium, and measurement of the effect of inhibition of GABA transaminase succinate accumulation in the ischaemic myocardium. a, Mouse hearts were perfused with 4 mM 13C glutamine (+5 labelled) for 10 min followed by either 30 min no flow ischaemia or 30 min normoxic respiration followed by snap freezing and metabolomic analysis. The isotopic profile for each metabolite is expressed as a proportion of the total pool (n=4) b, Additionally, flux to α-KG was determined relative to the proportion of the +5 glutamine pool in the heart (n = 4). c, Perfused mouse hearts were subjected to 30 min no flow ischaemia ± continuous infusion of vigabatrin (Vig; 100, 300, and 700 μM) 10 min prior to ischaemia. Heart tissue was snap frozen and c, GABA and d, succinate abundance quantified relative to normoxic levels by LC-MS (n = 4; ischaemia n = 5). * p < 0.05. Data are shown as the mean ± s.e.m of at least four biological replicates.
Extended Data Figure 6.
Unabridged metabolic model identifying pathways that can become activated by tissue ischaemia to drive succinate accumulation. To identify the metabolic pathways that could contribute to succinate production under ischaemia, we simulated these conditions using flux balance analysis in conjunction with an expanded version of the iAS253 mitochondrial model of central cardiac metabolism. The major pathways contributing to succinate accumulation (bold red lines) were via fumarate feeding into the reverse activity of SDH. This was produced by the purine nucleotide cycle (PNC) and the malate-aspartate shuttle (MAS), which consumed glucose and aspartate, and also led to significant production of lactate and alanine. Lesser sources of succinate (thin red lines) included glycolysis and glutaminolysis but this was relatively minor as this route was constrained by the overproduction of NADH. In addition a small amount of fumarate was generated by pyruvate carboxylase activity. The GABA shunt did not contribute (black dashed line).
Extended Data Figure 7.
Effects of dimethyl malonate and dimethyl succinate treatment of cells and in vivo on intracellular accumulation of malonate and succinate, and respiration and comparison of 13C ischaemic metabolite fluxes to succinate relative to isotopic donor pools. a, Intravenous infusion of dimethyl malonate in vivo results in accumulation of malonate in the ischaemic myocardium (n = 4). b,c, C2C12 cells were incubated with: no additions, glucose, 5 mM dimethyl succinate, 5 mM dimethyl malonate, or 5 mM dimethyl malonate and 5 mM dimethyl succinate. Cellular oxygen consumption rate due to (b) ATP synthesis and (c) maximal rates in the presence of FCCP were determined using a Seahorse XF96 analyser (n = 4). d, Mouse hearts were perfused with 13C-glucose (+6 labelled), 13C-glutamine (+5 labelled), 13C-aspartate (+1 labelled), or 13C-palmitate (+16 labelled) for 10 min followed by 30 min no flow ischaemia or 30 min normoxic respiration, followed by snap-freezing and metabolomic analysis. To compare the relative magnitude of metabolite flux from each carbon source, 13C incorporation to succinate during normoxia and ischaemia was determined relative to the proportion of the labelled pool of the relevant infused 13C donor. 13C incorporation into succinate was considered in terms of the proportion of the +4 isotope in the entire succinate pool for 13C-glucose, 13C-glutamine and 13C-palmitate infusions; and the proportion of the +1 isotope in the entire pool for the 13C-aspartate infusion. (n = 4), *, p < 0.05; ***, p < 0.001. Data are shown as the mean ± s.e.m of at least four biological replicates.
Extended Data Figure 8.
Predicted changes in pathways of succinate and OXPHOS metabolism during ischaemia and following reperfusion. To determine possible changes in succinate metabolism during ischaemia, reperfusion and normoxia, cardiac metabolism was simulated in these conditions using an expanded version of the iAS253 model with flux balance analysis. The simulations predicted that: a, under ischaemia, complex II ran in reverse by using ubiquinol produced by complex I to reduce fumarate to succinate, thereby acting as a terminal electron acceptor instead of oxygen. Fumarate was produced from the purine nucleotide cycle (PNC) and reversal of the citric acid cycle (CAC). Flux through the rest of the respiratory chain was diminished and AMP was produced from ADP due to insufficient ATP production. b, With oxygen restored complex II metabolised excess succinate. A delay in regenerating AMP to ADP, as typified in the first minute of reperfusion, limited the flux through ATP-synthase. This in turn prevented complex III consuming all the ubiquinol generated by complex II, as the membrane became hyper-polarised. The excess flux of ubiquinol and protons forced complex I to run in reverse, which would generate ROS by RET. c, Once the flux of succinate was reduced to normal levels, as in the transition from late reperfusion to normoxia, the fluxes through the respiratory chain and citric acid cycle returned to normal.
Extended Data Figure 9.
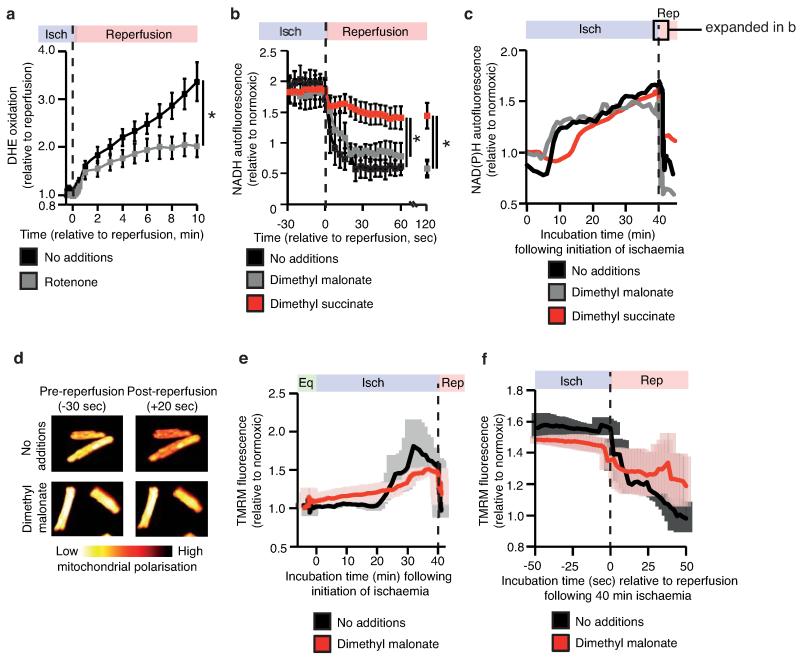
Tracking DHE oxidation, NAD(P)H reduction state, and mitochondrial membrane potential in primary cardiomyocytes during in situ IR. a, Inhibition of mitochondrial complex I RET reduces DHE oxidation on reperfusion (n = 6; rotenone n =4). b,c Effect of manipulation of ischaemic succinate levels on NAD(P)H oxidation during early reperfusion (n = 3). Primary rat cardiomyocytes were subjected to 40 min ischaemia followed by reoxygenation and NAD(P)H reduction state was tracked throughout the experiment by measurement of NAD(P)H autofluorescence. Ischaemic buffer contained either no additions, 4 mM dimethyl malonate, or 4 mM dimethyl succinate. Average (b) and representative (c) traces from each condition are shown. The highlighted window in (c) indicates the period of the experiment expanded in detail in (b). d, Effect of inhibition of ischaemic succinate accumulation on mitochondrial membrane potential following late ischaemia (left panels) and early reperfusion (right panels). e,f, Primary rat cardiomyocytes were subjected to 40 min ischaemia and reoxygenation and mitochondrial membrane potential was tracked throughout the experiment by measurement of tetramethylrhoadmine (TMRM) fluorescence. Ischaemic buffer contained either no additions or 4 mM dimethyl malonate. (e), TMRM signal throughout the entire experiment. (f) TMRM signal during the transition from ischaemia to reoxygenation (n = 3). Data are shown as the mean ± s.e.m of at least three biological replicates. Replicates represent separate experiments on independent cell preparations.
Extended Data Figure 10.
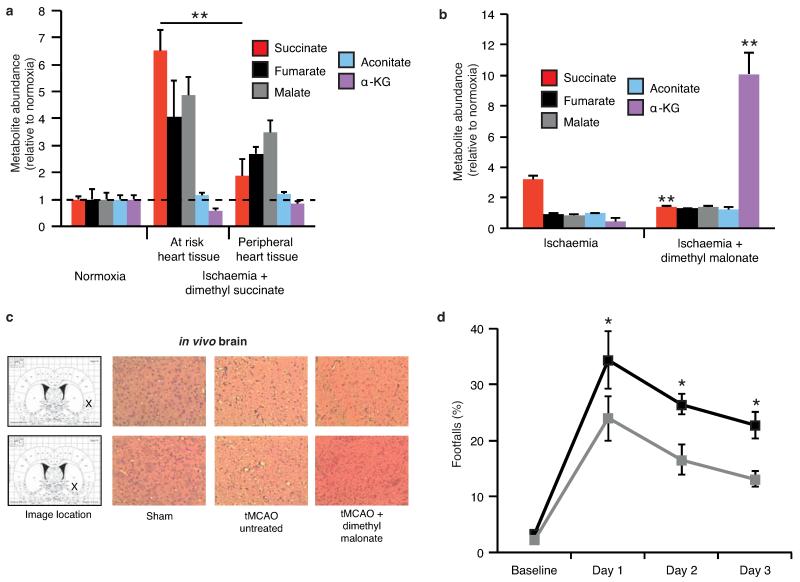
Quantification of CAC intermediates in the heart following infusion of dimethyl succinate and in the brain following infusion of dimethyl malonate, and extended summary cytoprotection and neurological scores of rats subjected to tMCAO IR in vivo ± dimethyl malonate infusion. a, Effect of intravenous infusion of dimethyl succinate on CAC metabolite abundance in the ischaemic and non-ischaemic myocardium(normoxia and peripheral heart tissue + dimethyl succinate n = 3; ischaemia + dimethyl succinate n = 4; α-KG and aconitate in peripheral heart tissue n = 2). b, Profile of mitochondrial CAC metabolite levels following tMCAO ischaemia ± dimethyl malonate (n = 4). c, Representative images of cross-sections from rat brains after undergoing tMCAO in vivo ± treatment with dimethyl malonate. Brains were treated with hematoxylin and eosin to delineate infarcted tissue. d, Locomotor and sensorimotor assessment of rats by quantification of average number of footfalls following tCMAO ± dimethyl malonate (control n = 6; dimethyl malonate n = 4). *, p < 0.05; **, p < 0.01. Data are shown as the mean ± s.e.m of at least three biological replicates, unless otherwise stated.
Supplementary Material
Supp Table 1
Supp Table 2
Supp Table 3
Supp Table 4
Supp Table 5
Supp Table 6
Acknowledgements
Supported by the Medical Research Council (UK) and by grants from Canadian Institutes of Health Research (E.T.C) and the British Heart Foundation (T.K., V.R.P.). We thank Judy Hirst and Guy C. Brown for helpful discussions.
Footnotes
Competing Financial Interests
M.P.M., E.T.C., L. M. W., C. F. and T. K. have applied for a patent on some of the work described here.
References
- 1.Murphy E, Steenbergen C. Mechanisms underlying acute protection from cardiac ischemia-reperfusion injury. Physiol. Rev. 2007;88:581–609. doi: 10.1152/physrev.00024.2007. [DOI] [PMC free article] [PubMed] [Google Scholar]
- 2.Yellon DM, Hausenloy DJ. Myocardial reperfusion injury. N. Engl. J. Med. 2007;357:1121–1135. doi: 10.1056/NEJMra071667. [DOI] [PubMed] [Google Scholar]
- 3.Burwell LS, Nadtochiy SM, Brookes PS. Cardioprotection by metabolic shut-down and gradual wake-up. J. Mol. Cell. Cardiol. 2009;46:804–810. doi: 10.1016/j.yjmcc.2009.02.026. [DOI] [PMC free article] [PubMed] [Google Scholar]
- 4.Eltzschig HK, Eckle T. Ischemia and reperfusion--from mechanism to translation. Nat. Med. 2011;17:1391–1401. doi: 10.1038/nm.2507. [DOI] [PMC free article] [PubMed] [Google Scholar]
- 5.Timmers L, et al. The innate immune response in reperfused myocardium. Cardiovasc. Res. 2012;94:276–283. doi: 10.1093/cvr/cvs018. [DOI] [PubMed] [Google Scholar]
- 6.Harmsen E, de Jong JW, Serruys PW. Hypoxanthine production by ischemic heart demonstrated by high pressure liquid chromatography of blood purine nucleosides and oxypurines. Clin. Chim. Acta. 1981;115:73–84. doi: 10.1016/0009-8981(81)90108-x. [DOI] [PubMed] [Google Scholar]
- 7.Pacher P, Nivorozhkin A, Szabo C. Therapeutic effects of xanthine oxidase inhibitors: renaissance half a century after the discovery of allopurinol. Pharmacol. Revs. 2006;58:87–114. doi: 10.1124/pr.58.1.6. [DOI] [PMC free article] [PubMed] [Google Scholar]
- 8.Chouchani ET, et al. Cardioprotection by S-nitrosation of a cysteine switch on mitochondrial complex I. Nat. Med. 2013;19:753–759. doi: 10.1038/nm.3212. [DOI] [PMC free article] [PubMed] [Google Scholar]
- 9.Zweier JL, Flaherty JT, Weisfeldt ML. Direct measurement of free radical generation following reperfusion of ischemic myocardium. Proc. Natl. Acad. Sci. USA. 1987;84:1404–1407. doi: 10.1073/pnas.84.5.1404. [DOI] [PMC free article] [PubMed] [Google Scholar]
- 10.Tannahill GM, et al. Succinate is an inflammatory signal that induces IL-1beta through HIF-1alpha. Nature. 2013;496:238–242. doi: 10.1038/nature11986. [DOI] [PMC free article] [PubMed] [Google Scholar]
- 11.Smith AC, Robinson AJ. A metabolic model of the mitochondrion and its use in modelling diseases of the tricarboxylic acid cycle. BMC Syst. Biol. 2011;5:102. doi: 10.1186/1752-0509-5-102. [DOI] [PMC free article] [PubMed] [Google Scholar]
- 12.Niatsetskaya ZV, et al. The oxygen free radicals originating from mitochondrial complex I contribute to oxidative brain injury following hypoxia-ischemia in neonatal mice. J. Neurosci. 2012;32:3235–3244. doi: 10.1523/JNEUROSCI.6303-11.2012. [DOI] [PMC free article] [PubMed] [Google Scholar]
- 13.Taegtmeyer H. Metabolic responses to cardiac hypoxia. Increased production of succinate by rabbit papillary muscles. Circ. Res. 1978;43:808–815. doi: 10.1161/01.res.43.5.808. [DOI] [PubMed] [Google Scholar]
- 14.Hochachka PW, Storey KB. Metabolic consequences of diving in animals and man. Science. 1975;187:613–621. doi: 10.1126/science.163485. [DOI] [PubMed] [Google Scholar]
- 15.Easlon E, Tsang F, Skinner C, Wang C, Lin SJ. The malate-aspartate NADH shuttle components are novel metabolic longevity regulators required for calorie restriction-mediated life span extension in yeast. Genes Dev. 2008;22:931–944. doi: 10.1101/gad.1648308. [DOI] [PMC free article] [PubMed] [Google Scholar]
- 16.Barron JT, Gu L, Parrillo JE. Malate-aspartate shuttle, cytoplasmic NADH redox potential, and energetics in vascular smooth muscle. J. Mol. Cell. Cardiol. 1998;30:1571–1579. doi: 10.1006/jmcc.1998.0722. [DOI] [PubMed] [Google Scholar]
- 17.Van den Berghe G, Vincent MF, Jaeken J. Inborn errors of the purine nucleotide cycle: adenylosuccinase deficiency. J. Inherit. Metab. Dis. 1997;20:193–202. doi: 10.1023/a:1005304722259. [DOI] [PubMed] [Google Scholar]
- 18.Sridharan V, et al. O2-sensing signal cascade: clamping of O2 respiration, reduced ATP utilization, and inducible fumarate respiration. Amer. J. Physiol. 2008;295:C29–37. doi: 10.1152/ajpcell.00466.2007. [DOI] [PMC free article] [PubMed] [Google Scholar]
- 19.Dervartanian DV, Veeger C. Studies on succinate dehydrogenase. I. spectral properties of the purified enzyme and formation of enzyme-competitive inhibitor complexes. Biochim. Biophys. Acta. 1964;92:233–247. [PubMed] [Google Scholar]
- 20.Gutman M. Modulation of mitochondrial succinate dehydrogenase activity, mechanism and function. Mol. Cell. Biochem. 1978;20:41–60. doi: 10.1007/BF00229453. [DOI] [PubMed] [Google Scholar]
- 21.Bunger R, Glanert S, Sommer O, Gerlach E. Inhibition by (aminooxy)acetate of the malate-aspartate cycle in the isolated working guinea pig heart. Hoppe Seylers Z. Physiol. Chem. 1980;361:907–914. doi: 10.1515/bchm2.1980.361.1.907. [DOI] [PubMed] [Google Scholar]
- 22.Swain JL, Hines JJ, Sabina RL, Harbury OL, Holmes EW. Disruption of the purine nucleotide cycle by inhibition of adenylosuccinate lyase produces skeletal muscle dysfunction. J. Clin. Invest. 1984;74:1422–1427. doi: 10.1172/JCI111553. [DOI] [PMC free article] [PubMed] [Google Scholar]
- 23.Hirst J, King MS, Pryde KR. The production of reactive oxygen species by complex I. Biochem. Soc. Trans. 2008;36:976–980. doi: 10.1042/BST0360976. [DOI] [PubMed] [Google Scholar]
- 24.Kussmaul L, Hirst J. The mechanism of superoxide production by NADH:ubiquinone oxidoreductase (complex I) from bovine heart mitochondria. Proc. Natl. Acad. Sci. USA. 2006;103:7607–7612. doi: 10.1073/pnas.0510977103. [DOI] [PMC free article] [PubMed] [Google Scholar]
- 25.Pryde KR, Hirst J. Superoxide is produced by the reduced flavin in mitochondrial complex I: a single, unified mechanism that applies during both forward and reverse electron transfer. J. Biol. Chem. 2011;286:18056–18065. doi: 10.1074/jbc.M110.186841. [DOI] [PMC free article] [PubMed] [Google Scholar]
- 26.Murphy MP. How mitochondria produce reactive oxygen species. Biochem. J. 2009;417:1–13. doi: 10.1042/BJ20081386. [DOI] [PMC free article] [PubMed] [Google Scholar]
- 27.Davidson SM, Yellon D, Duchen MR. Assessing mitochondrial potential, calcium, and redox state in isolated mammalian cells using confocal microscopy. Methods Mol. Biol. 2007;372:421–430. doi: 10.1007/978-1-59745-365-3_30. [DOI] [PubMed] [Google Scholar]
- 28.Wojtovich AP, Smith CO, Haynes CM, Nehrke KW, Brookes PS. Physiological consequences of complex II inhibition for aging, disease, and the mKATP channel. Biochim. Biophys. Acta. 2013;1827:598–611. doi: 10.1016/j.bbabio.2012.12.007. [DOI] [PMC free article] [PubMed] [Google Scholar]
- 29.Brennan JP, et al. Mitochondrial uncoupling, with low concentration FCCP, induces ROS-dependent cardioprotection independent of KATP channel activation. Cardiovas. Res. 2006;72:313–321. doi: 10.1016/j.cardiores.2006.07.019. [DOI] [PubMed] [Google Scholar]
- 30.Hamel D, et al. G-Protein-coupled receptor 91 and succinate are key contributors in neonatal postcerebral hypoxia-ischemia recovery. Arterioscler. Thromb. Vasc. Biol. 2014;34:285–293. doi: 10.1161/ATVBAHA.113.302131. [DOI] [PubMed] [Google Scholar]
- 31.Schmidt K, et al. Cardioprotective effects of mineralocorticoid receptor antagonists at reperfusion. Eur. Heart J. 2010;31:1655–1662. doi: 10.1093/eurheartj/ehp555. [DOI] [PMC free article] [PubMed] [Google Scholar]
- 32.Methner C, et al. Protection through postconditioning or a mitochondria-targeted S-nitrosothiol is unaffected by cardiomyocyte-selective ablation of protein kinase G. Basic Res. Cardiol. 2013;108:337. doi: 10.1007/s00395-013-0337-1. [DOI] [PubMed] [Google Scholar]
- 33.Nadtochiy SM, Redman E, Rahman I, Brookes PS. Lysine deacetylation in ischaemic preconditioning: the role of SIRT1. Cardiovasc. Res. 2011;89:643–649. doi: 10.1093/cvr/cvq287. [DOI] [PMC free article] [PubMed] [Google Scholar]
- 34.Ashrafian H, et al. Fumarate is cardioprotective via activation of the Nrf2 antioxidant pathway. Cell Metab. 2012;15:361–371. doi: 10.1016/j.cmet.2012.01.017. [DOI] [PMC free article] [PubMed] [Google Scholar]
- 35.Ord ENJ, Shirley R, van Kralingen JC, Graves A, McClure JD, Wilkinson M, McCabe C, Macrae IM, Work LM. Positive impact of pre-stroke surgery on survival following transient focal ischemia in hypertensive rats. J. Neurosci. Methods. 2012;211:305–308. doi: 10.1016/j.jneumeth.2012.09.001. [DOI] [PMC free article] [PubMed] [Google Scholar]
- 36.Koizumi J, Yoshida Y, Nakazawa T, Ooneda G. Experimental studies of ischemic brain edema: a new experimental model of cerebral embolism in rats in which recirculation can be introduced in the ischemic area. Jpn. J. Stroke. 1986;8:1–8. [Google Scholar]
- 37.Hunter AJ, et al. Functional assessments in mice and rats after focal stroke. Neuropharmacology. 2000;39:806–816. doi: 10.1016/s0028-3908(99)00262-2. [DOI] [PubMed] [Google Scholar]
- 38.Ord ENJ, et al. Combined antiapoptotic and antioxidant approach to acute neuroprotection for stroke in hypertensive rats. J. Cereb. Blood Flow Metab. 2013;33:1215–1224. doi: 10.1038/jcbfm.2013.70. [DOI] [PMC free article] [PubMed] [Google Scholar]
- 39.Osborne KA, et al. Quantitative assessment of early brain damage in a rat model of focal cerebral ischaemia. J. Neurol. Neurosurg. Psychiatry. 1987;50:402–410. doi: 10.1136/jnnp.50.4.402. [DOI] [PMC free article] [PubMed] [Google Scholar]
- 40.Gaude E, et al. muma, An R Package for metabolomics univariate and multivariate statistical analysis. Current Metabol. 2013;1:180–189. [Google Scholar]
- 41.Goodpaster AM, Romick-Rosendale LE, Kennedy MA. Statistical significance analysis of nuclear magnetic resonance-based metabonomics data. Anal. Biochem. 2010;401:134–143. doi: 10.1016/j.ab.2010.02.005. [DOI] [PubMed] [Google Scholar]
- 42.Davidson SM, Duchen MR. Effects of NO on mitochondrial function in cardiomyocytes: Pathophysiological relevance. Cardiovasc. Res. 2006;71:10–21. doi: 10.1016/j.cardiores.2006.01.019. [DOI] [PubMed] [Google Scholar]
- 43.Smith AC, Blackshaw JA, Robinson AJ. MitoMiner: a data warehouse for mitochondrial proteomics data. Nucleic Acids Res. 2012;40 doi: 10.1093/nar/gkr1101. [DOI] [PMC free article] [PubMed] [Google Scholar]
- 44.Chang A, Scheer M, Grote A, Schomburg I, Schomburg D. BRENDA, AMENDA and FRENDA the enzyme information system: new content and tools in 2009. Nucleic Acids Res. 2009;37:D588–592. doi: 10.1093/nar/gkn820. [DOI] [PMC free article] [PubMed] [Google Scholar]
- 45.Romero P, et al. Computational prediction of human metabolic pathways from the complete human genome. Genome Biol. 2005;6:R2. doi: 10.1186/gb-2004-6-1-r2. [DOI] [PMC free article] [PubMed] [Google Scholar]
- 46.Abad MF, Di Benedetto G, Magalhaes PJ, Filippin L, Pozzan T. Mitochondrial pH monitored by a new engineered green fluorescent protein mutant. J. Biol. Chem. 2004;279:11521–11529. doi: 10.1074/jbc.M306766200. [DOI] [PubMed] [Google Scholar]
- 47.Orth JD, Thiele I, Palsson BO. What is flux balance analysis? Nat. Biotechnol. 2010;28:245–248. doi: 10.1038/nbt.1614. [DOI] [PMC free article] [PubMed] [Google Scholar]
- 48.Becker SA, et al. Quantitative prediction of cellular metabolism with constraint-based models: the COBRA Toolbox. Nat. Prot. 2007;2:727–738. doi: 10.1038/nprot.2007.99. [DOI] [PubMed] [Google Scholar]
- 49.Cochemé HM, Murphy MP. Complex I is the major site of mitochondrial superoxide production by paraquat. J. Biol. Chem. 2008;283:1786–1798. doi: 10.1074/jbc.M708597200. [DOI] [PubMed] [Google Scholar]
- 50.Srere PA. Citrate synthase. Methods Enzymol. 1969;13:3–10. [Google Scholar]
Associated Data
This section collects any data citations, data availability statements, or supplementary materials included in this article.
Supplementary Materials
Supp Table 1
Supp Table 2
Supp Table 3
Supp Table 4
Supp Table 5
Supp Table 6
