Molecular Cloning, Epigenetic Regulation and Functional Characterization of Prkd1 Gene Promoter in Dopaminergic Cell Culture Models of Parkinson’s Disease (original) (raw)
. Author manuscript; available in PMC: 2016 Apr 21.
Published in final edited form as: J Neurochem. 2015 Aug 28;135(2):402–415. doi: 10.1111/jnc.13261
Abstract
We recently identified a compensatory survival role for protein kinase D1 (PKD1) in protecting dopaminergic neurons from oxidative insult. To investigate the molecular mechanism of Prkd1 gene expression, we cloned the 5’-flanking region (1620-bp) of the mouse Prkd1 gene. Deletion analyses revealed that the −250/+113 promoter region contains full promoter activity in MN9D dopaminergic neuronal cells. In silico analysis of the Prkd1 promoter uncovered binding sites for key redox transcription factors including Sp1 and NF-κB. Overexpression of Sp1, Sp3, and NF-κB-p65 proteins stimulated Prkd1 promoter activity. Binding of Sp3 and NF-κB-p65 to the Prkd1 promoter was confirmed using chromatin immunoprecipitation. Treatment with the Sp inhibitor mithramycin-A significantly attenuated Prkd1 promoter activity and PKD1 mRNA and protein expression. Further mechanistic studies revealed that inhibition of histone acetylation and DNA methylation upregulates PKD1 mRNA expression. Importantly, negative modulation of PKD1 signaling by pharmacological inhibition or shRNA knockdown increased dopaminergic neuronal sensitivity to oxidative damage in a human mesencephalic neuronal cell model. Collectively, our findings demonstrate that Sp1, Sp3 and NF-κB-p65 can transactivate the mouse Prkd1 promoter and that epigenetic mechanisms, such as DNA methylation and histone modification, are key regulatory events controlling the expression of pro-survival kinase PKD1 in dopaminergic neuronal cells.
Keywords: PKD1, epigenetic regulation, Parkinson disease, promoter function, redox signaling, neurodegeneration
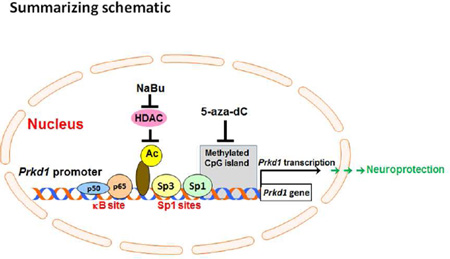
Graphical Abstract
Previously, we demonstrated that protein kinase D1 (PKD1) plays a survival role during the early stage of oxidative stress in dopaminergic neuronal cells. Here, we cloned and characterized the mouse Prkd1 gene promoter. Our results suggest that Sp1, Sp3 and NF-κB-p65 transactivate the mouse Prkd1 promoter and that histone acetylation and DNA methylation play important roles in regulating Prkd1 expression in neuronal cells.
Introduction
Protein kinase D1 (PKD1), encoded by the Prkd1 gene, is a serine/threonine kinase and one of three members of the protein kinase D family, including PKD2 and PKD3, that belong to the calcium/calmodulin-dependent protein kinase (CAMK) superfamily (Manning et al. 2002). PKD1 plays an important role in a number of biological processes, including signal transduction, membrane trafficking, immune function, and cell survival and migration (Jamora et al. 1999, Sidorenko et al. 1996, Rozengurt et al. 2005, Prigozhina & Waterman-Storer 2004). While PKD1 plays important roles in the regulation of neuronal nitric oxide synthase (nNOS) (Sanchez-Ruiloba et al. 2014), in protein trafficking (Bisbal et al. 2008), and as an early response to genotoxic stress (Besirli & Johnson 2006), its function in the brain remains poorly understood. After others reported that PKD1 protects against oxidative stress-induced damage in non-neuronal cells (Storz 2007, Song et al. 2009), we recently showed that PKCδ-mediated PKD1 activation protects dopaminergic neurons during the early stages of oxidative stress (Asaithambi et al. 2011, Asaithambi et al. 2014). We also showed that overexpressing a constitutively active PKD1 mutant in dopaminergic cells significantly protected against oxidative stress, suggesting that further understanding the molecular mechanisms governing the transcriptional regulation of PKD1 may help in developing a neuroprotective strategy against oxidative stress-induced neurodegeneration in Parkinson’s disease (PD).
PKD1 is ubiquitously expressed, and its expression can be induced by various stimuli including growth factors, neuropeptides, G-protein coupled receptors, phorbol esters, genotoxic stress, oxidative stress, and diacylglycerol analogues (Van Lint et al. 1998, Rykx et al. 2003). However, the molecular mechanisms responsible for transcriptional regulation of this gene in mammalian systems are largely unknown (Borges et al. 2013). This prompted us to investigate the structure of the mouse Prkd1 promoter, which is highly GC-rich and does not contain a TATA box. In this study, we analyzed the mouse Prkd1 promoter to identify the molecular mechanisms underlying the transcriptional regulation of Prkd1 in neuronal cells. To our knowledge, this is the first report of molecular cloning and characterization of the mouse Prkd1 gene promoter to delineate the transcriptional regulation of Prkd1 in a dopaminergic neuronal system. Specifically, we cloned the 5’-flanking region of the mouse Prkd1 gene, characterized multiple _cis_-regulatory elements that positively or negatively regulate Prkd1 promoter activity, and demonstrated that NF-κB p65, Sp1, and Sp3 transactivate the mouse Prkd1 promoter. In addition, to fully understand the transcriptional regulation of Prkd1, we investigated whether epigenetic mechanisms contribute to the regulation of the Prkd1 gene and found that histone acetylation and DNA methylation play important roles in regulating Prkd1 expression in neuronal cells.
Materials and Methods
Chemicals
6-hydroxydopamine (6-OHDA), dibutyryl cAMP, poly-L-ornithin, fibronectin, Mithramycin A (MA), trichostatin A (TSA), sodium butyrate (NaBu), and 5-Aza-2’-deoxycytidine were purchased from Sigma-Aldrich. Antibodies against PKD1, p65 and Sp3 were purchased from Santa Cruz Biotechnology (Santa Cruz, CA). Lipofectamine 2000 reagent and all cell culture reagents were obtained from Invitrogen.
Cell Cultures
The mouse dopaminergic MN9D cell line was kindly provided by Dr. Syed Ali (National Center for Toxicological Research, Food and Drug Administration, Jefferson, AR) and cultured as described previously (Jin et al. 2011a, Jin et al. 2014b). Briefly, cells were grown in Dulbecco’s modified Eagle’s medium supplemented with 10% fetal bovine serum (FBS), 2 mM L-glutamine, 50 units penicillin, and 50 µg/ml streptomycin. The Lund human mesencephalic (LUHMES) cells were grown and differentiated, as described previously (Jin et al. 2014b).
Primary Mesencephalic Neuronal Cultures
Primary mesencephalic neuronal cultures were prepared from the ventral mesencephalon of gestational 16- to 18-day-old mouse embryos, as described earlier (Latchoumycandane et al. 2011, Ghosh et al. 2013). Briefly, tissues were dissected from E16 to E18 mouse embryos, maintained in ice cold Ca2+-free Hank’s balanced salt solution, and then dissociated in Hank’s balanced salt solution containing trypsin-0.25% EDTA for 30 min at 37°C. Cultures were maintained in Neurobasal medium supplemented with B27. Half of the culture medium was replaced every 2 days. Approximately 6- to 7-day-old cultures were used for experiments. Primary mesencephalic neuronal cells were exposed to either NaBu (1–5 mM) or MA (1–5 µM) for 24 h.
Cloning of the Mouse Prkd1 Promoter
Genomic DNA was isolated from MN9D cells using the DNeasy Blood & Tissue Kit (Qiagen). The 1.6-kb (−1370/+250) mouse Prkd1 promoter region was amplified by PCR using mouse genomic DNA as a template and the primer set P-1370F / P+250R. PCR conditions were as follows: 95°C for 5 min; 38 cycles of 95°C for 45 sec, 61°C for 30 sec, and 68°C for 2 min; and then 68°C for 7 min. The PCR reaction was performed with the AccuPrime GC-rich DNA polymerase (Invitrogen). DMSO was added to the PCR mixture at a final concentration of 5% (v/v) to increase amplification efficiency. Following double digestion by Kpn1/Nhe1, the 1.6-kb PCR product was cloned into the pGL4.14 luciferase vector (Promega, Madison, WI) and designated as pGL4-1370/+250. Using pGL4-1370/+250 as a template, a set of 5’ and 3’ end-truncated Prkd1 promoter constructs were created by PCR with appropriate primers (Table 1) and then cloned into the pGL4.14 luciferase vector similar to the preparation of pGL4-1370/+250. All reporter constructs were verified by DNA sequencing.
Table 1.
List of primer sequences used in this study.
| Primer | Nucleotide sequence (5’-3’) |
|---|---|
| P-1320F | GTCTATGGTACC CCCATCAACCAGTCCTTGGCTC |
| P-1032F | GTCTATGGTACCGGAACGACACCCCTATCCAGTC |
| P-637F | GTCTATGGTACCTAGGGTCCCTGTACATCTACAG |
| P-222F | GTCTATGGTACCTGGCGTTTCCCGGTCCACTCCTG |
| P-150F | GTCTATGGTACCCTTTAGAGTCCGCCGAGTGGGC |
| P-25F | GTCTATGGTACCTCGCGCGGACCCGCCGTGGTC |
| P-250F | GTCTATGGTACCTTAGGTGGGCTCTACCAGGCTGG |
| P+250R | ATATATGCTAGCCATCGCGCCAGTGAGCCCCAAAGT |
| P+113R | ATATATGCTAGCGCCGCGAAGATGGCCGAGCGGA |
| P+80R | ATATATGCTAGCGCGGGCGGGCAGGCGAGCAG |
| P+43R | ATATATGCTAGCCGGGGGAGGCGCCCAGCTAC |
| P-7R | ATATATGCTAGCCGGGGACCACGGCGGGTCCGC |
| Methylated F | GTGGTTAGGATTGTTTTGAATGGGC |
| Methylated R | GACGAAAAAAACCGAAACCCG |
| Unmethylated F | AGGATTGTTTTGAATGGGTGG |
| Unmethylated R | CCAACAAAAAAAACCAAAACCCAAC |
| PKD κB-F | AACTCGAGGGCTCCCAGAGGGA |
| PKD κB-R | ACTCTAAAGCCGCGGACCCGC |
| PKD Sp3-F | TTGGAAGGGGGTGGTCAGGAC |
| PKD Sp3-R | CCGCGGAGCCGACGAGGGGA |
Transient Transfection and Reporter Gene Assays
Transient transfections of MN9D cells were performed using Lipofectamine 2000 reagent, as described previously (Jin et al. 2011a). Cells were seeded into 12-well plates at a density of 15x104 cells/well one day before transfection. Each transfection was performed with 2 µg of reporter constructs along with 0.2 µg of pcDNA3-LacZ to normalize transfection efficiencies. Cells were harvested 24 h after transfection, lysed in 150 µl of Reporter Lysis Buffer (Promega), and assayed for luciferase activity. The pcDNA3 cloning vector was a generous gift from Dr. Ted Huiatt (Iowa State University, Ames, IA), the CBP expression plasmid pcDNA-CBP was kindly provided by Dr. Xiang-Jiao Yang (McGill University, Canada), and the NF-κB-p65 expression plasmid was a generous gift from Dr. Vivek Rangnekar (University of Kentucky, Lexington, KY). The pN3 cloning vector and the pN3-Sp1, pN3-Sp3, and pN3-Sp4 expression plasmids were generous gifts from Dr. G. Suske (Philipps-Universität Marburg, Germany). For co-transfection assays, different amounts of expression plasmids, as indicated in figures, were added to the reporter plasmids. The total amount of DNA was adjusted by adding an empty vector. In some experiments, mithramycin A was added 4 h post-transfection, and luciferase activity was measured 24 h post-MA treatment.
Quantitative Real-Time RT-PCR
Total RNA was isolated from cells using the Absolutely RNA Miniprep kit (Stratagene, La Jolla, CA), and 1–2 µg RNA was used to generate cDNA using an AffinityScript QPCR cDNA synthesis kit (Stratagene). Real-time PCR was performed in an Mx300P QPCR system (Stratagene) using the Brilliant SYBR Green QPCR Master Mix kit (Stratagene) and QuantiTect Primer Assay kit (Qiagen). All reactions were performed in triplicate, and PKD1 expression was normalized to 18S ribosomal RNA. Validated QuantiTect primers for human PRKD1, human 18S rRNA, mouse Prkd1, and mouse 18S rRNA were used. PCR conditions are available upon request. Dissociation curves were run to verify the singularity of the PCR product. The data were analyzed using the comparative threshold cycle (Ct) method.
Chromatin Immunoprecipitation (ChIP) Assays
ChIP assays were performed with chromatin isolated from MN9D cells using the ChIP-IT Express Enzymatic kit from Active Motif, according to the manufacturer’s protocol with some modifications. Briefly, the nuclei were prepared for enzymatic digestion to generate chromatin fragments after cross-linking. The sheared chromatin was collected by centrifuge, and a 10-µl aliquot was removed to use as positive input. Next, 70-µl aliquots of the sheared chromatin were immunoprecipitated with 3 µg of indicated antibody using protein-G magnetic beads. Equal aliquots of each chromatin sample were also used for no-antibody controls. The immunoprecipitated DNA was analyzed by PCR using appropriate primers specific to the Prkd1 promoter region. PCR conditions were as follows: 94°C for 3 min; 35 cycles of 94°C for 30 sec, 60°C for 30 sec, and 68°C for 20 sec; and 68°C for 7 min. PCR products were resolved by electrophoresis in a 2% agarose gel and visualized after ethidium bromide staining.
5-Aza-2’-deoxycytidine Treatment and Methylation-Specific PCR
MN9D cells were treated with either 3 or 5 µM 5-Aza-2’-deoxycytidine (5-aza-dC) for 48 h. The culture medium containing 5-aza-dC was replaced every 24 h. Genomic DNA was extracted from cells post-treatment using the DNeasy Blood and Tissue kit. Two micrograms of genomic DNA was bisulfite-modified and purified using Active Motif’s MethylDetector Bisulfite Modification kit, following the manufacturer’s protocol. The methylation-specific PCR (MSP) primers were designed using MethPrimer software (Li & Dahiya 2002). Modified DNA was amplified by two different primer pairs specific to the unmethylated (U) and methylated (M) Prkd1 promoter sequences, respectively (Table 1). PCR conditions were as follows: 94°C for 3 min; 36 cycles of 94°C for 30 sec, 60°C for 30 sec, and 68°C for 20 sec; and 68°C for 7 min. Methylation-specific PCR reactions gave a 114-bp product and a 110-bp product for M set and U set primers, respectively. Methylation-specific PCR products were analyzed by a 2% agarose gel and stained with ethidium bromide.
Lentivirus-based shRNA Transductions
HEK 293FT cells were transfected with either the PKD1-targeting shRNA plasmid or the scrambled control shRNA plasmid along with MISSION lentiviral packaging mix (Sigma) using Lipofectamine 2000 reagent according to manufacturer’s protocol. The lentiviral particles were collected from the medium by centrifuging 72 h post-transfection. LUHMES cells were pre-differentiated for 2 days and then infected with lentiviral particles at a multiplicity of infection (MOI) of 2 in the presence of polybrene (8 µg/ml) at differentiation day 2. Three days post-infection, cells were subjected to quantitative real-time RT-PCR or 6-OHDA treatment.
Cell Viability Assays
MTS cell viability assay was performed, as described previously (Jin et al. 2014b). Briefly, differentiated LUHMES cells were seeded onto 96-well plates and treated at differentiation day 5. After treatment, 20 µl of MTS solution was added to each well, and the plates were incubated at 37°C and 5% CO2 for 2 h. Measurements were made at 490 nm using a fluorescence microplate reader (SpectraMax Gemini XS, Molecular Devices).
High Affinity [3H] Dopamine Uptake Assays
Dopamine uptake assay was performed, as described previously (Jin et al. 2014b, Ghosh et al. 2013). Briefly, LUHMES cells were pre-differentiated for 2 days and then infected with human PKD1 shRNA or control shRNA lentiviral particles. Three days post-infection, cells were treated with 6-OHDA. After washing the cells with Krebs Ringer buffer (16 mM Na3PO4, 5.6 mM glucose, 1.8 mM CaCl2, 1.3 mM EDTA, 1.2 mM MgSO4, 4.7 mM KCl, 120 mM NaCl), cells were incubated with 10 µM 3H-DA for 30 min at 37°C in Krebs Ringer buffer. Nonspecific dopamine uptake was determined by adding 1 nM Mazindol, a dopamine reuptake blocker. The uptake was stopped by washing the cultures 3X with fresh ice-cold Krebs Ringer buffer. Afterward, cells were lysed with 1 N NaOH. Radioactivity was measured by liquid scintillation counter (Tri-Carb 4000, Packard Instrument Co.) after adding a 5-ml scintillation cocktail to each vial.
Immunocytochemistry and Quantification of the Length of Tyrosine Hydroxylase (TH)-positive Neuronal Processes
Cells were fixed with 4% paraformaldehyde for 30 min at room temperature. After washing, cells were permeabilized with blocking agent (2% bovine serum albumin, 0.5% Triton X-100, and 0.05% Tween-20 in PBS) for 1 h. Cells were then incubated with anti-TH antibody (1:1200, Millipore) at 4°C overnight. Fluorescently-conjugated secondary antibody (Alexa Fluor 488-conjugated anti-mouse antibody, 1:2000) was used followed by incubation with 10 µg/ml Hoechst 33342 for 5 min at room temperature to stain the nucleus. Cover slips were mounted on glass slides and imaged through a Nikon TE2000 microscope with a SPOT color digital camera (Diagnostic Instruments, Sterling Heights, MI). The length of TH-positive neuronal processes in differentiated LUHMES cells from each coverslip was measured using MetaMorph software (Molecular Devices) as described previously (Harischandra et al. 2015, Ghosh et al. 2013). For measurement of neuronal processes, pictures were taken at 40X magnification, and the lengths of processes were measured using Integrated Morphometry Analysis. TH-positive neuronal processes were counted in six individual cultures for each treatment.
Western Blot Analysis
Cell lysates were prepared as described previously (Kanthasamy et al. 2006, Jin et al. 2011b). Briefly, lysates containing equal amounts of protein were loaded in each lane and separated on a 10–12% SDS-PAGE gel and transferred onto a nitrocellulose membrane. PKD1 polyclonal (1:1000) and β-actin (1:10000) antibodies were used to blot the membranes. Western blot was performed using IRDye 800 anti-rabbit and Alexa Fluor 680 anti-mouse secondary antibodies. Western blot images were captured and analyzed with an Odyssey Infrared Imaging System (LI-COR, Lincoln, NE).
In Silico Sequence Analysis
Putative transcription factor-binding sites in the promoter region of the mouse Prkd1 gene were predicted using MatInspector (Genomatix Software) with a threshold of 0.90 and the vertebrate matrix (Cartharius et al. 2005), as described previously (Jin et al. 2011a, Jin et al. 2011b). The CpG island was predicted by the CpG Plot program in the Prkd1 genomic sequence located within the 1-kb region upstream of the translation start site.
Statistical Analysis
Data analysis was performed using Prism 4.0 (GraphPad Software, San Diego, CA). Data were first analyzed by using one-way ANOVA and then the Tukey multiple comparison test was used for statistical comparisons. Differences with p < 0.05, p < 0.01, and p < 0.001 were considered significant from three independent experiments, each done in triplicate. All data are expressed as mean ± SEM.
Results
Cloning and deletion analysis of the mouse Prkd1 promoter
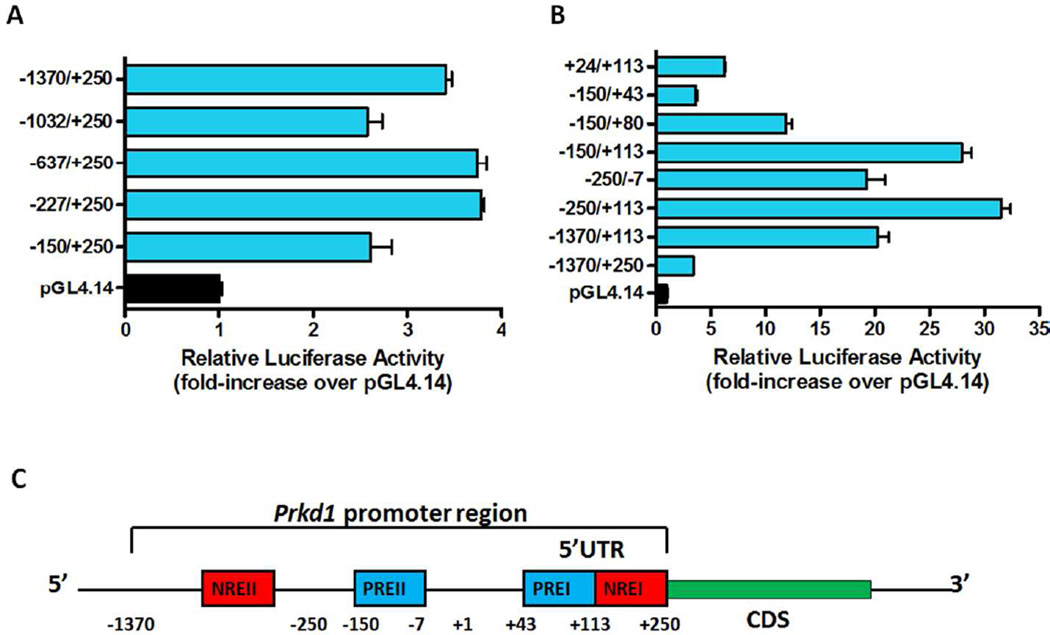
The mouse Prkd1 gene is located on chromosome 12 and contains 19 exons. Sequence analysis revealed that the mouse Prkd1 promoter region lacks a TATA box and contains GC-rich sequences in the proximal promoter region. Furthermore, the Prkd1 promoter lacks an initiator element (Inr) and a downstream promoter element (DPE), which is used by most TATA-less promoters to initiate transcription (Burke & Kadonaga 1996). The 1,620-bp promoter fragment (−1370/+250, where +1 is the transcription start site) containing the entire 250-bp 5’ untranslated region (UTR) of exon 1 was amplified by PCR from MN9D cells and cloned into the pGL4.14 luciferase vector. This sequence has been deposited in the GenBank™ data bank under the accession number GU253394. This promoter construct (pGL4-1370/+250) was transiently transfected into MN9D cells along with the pcDNA3.1-LacZ plasmid to normalize transfection efficiency. Promoter activity analysis revealed low basal activity in MN9D cells (Fig. 1A–B), suggesting some strong repressive elements are located within this promoter region. To uncover the locations of functional elements governing Prkd1 promoter activity, a series of truncated promoter fragments was amplified by PCR and cloned into the pGL4.14 vector. First, serial 5’-deletions of the full-length promoter construct were carried out and the resulting constructs (−1032/+250, −637/+250, −227/+250, −150/+250) were transiently transfected into MN9D cells (Fig. 1A). Deletion of the sequence from nucleotides −1370 to −150 (−1032/+250, −637/+250, −227/+250, −150/+250) didn’t significantly affect promoter activity. Next, various 5’ and 3’ deletions of the Prkd1 promoter region were performed and the resulting promoter constructs (−1370/+113, −250/+113, −250/−7, −150/+113, −150/+80, −150/+43, +24/+113) were transfected into MN9D cells (Fig. 1B). The −250/+113 construct had the strongest promoter activity, a nearly 33-fold increase in luciferase activity compared with the empty pGL4.14 vector. Since promoter activities of the −250/+113 and −150/+113 constructs were comparable and the −250/−7 construct had a 20-fold increase in promoter activity, this suggests that the region between −150 and −7 may contain a positive regulatory element. Deletion of the 5’-fragment of −1370 to −250 from the −1370/+113 construct resulted in a 12-fold increase in promoter activity of construct −250+113, indicating that there is a negative regulatory element between −1370 and −250. In addition, the −1370/+113 construct showed ~18-fold greater activity than did −1370/+250, indicating the presence of a very strong repressive element within the +113 to +250 region. Serial 3’-deletions of the −150/+113 construct from +113 to +80, and to +43, gradually reduced luciferase activity, suggesting the presence of a very strong positive regulatory element within the +43 to +113 region. Taken together, 5’- and 3’-deletions of the Prkd1 promoter region indicated that the Prkd1 promoter contains multiple positive and negative regulatory elements in MN9D cells (Fig. 1C). Deletion analysis revealed that the non-coding part of exon 1 (+1/+250) harbors a very strong repressor (+113/+250) and positive regulatory (+43/+113) elements, while the 1.3-kb 5’ flanking region contains another positive regulatory element (between −150 and −7) and another repressor element (between −1370 and −250).
Figure 1. Deletion analysis of the Prkd1 promoter activity in MN9D dopaminergic neuronal cells.
A, A series of 5’-deleted promoter constructs and B, A series of 5’- and 3’-deleted promoter constructs were transfected into MN9D cells and assayed for luciferase activity. Luciferase activities were normalized to β-galactosidase activity. Data represented as mean ± SEM of three independent experiments. C, Positive and negative regulatory elements (PRE and NRE) identified after deletion studies were mapped within the promoter region of Prkd1, including 5’ untranslated region (5’UTR).
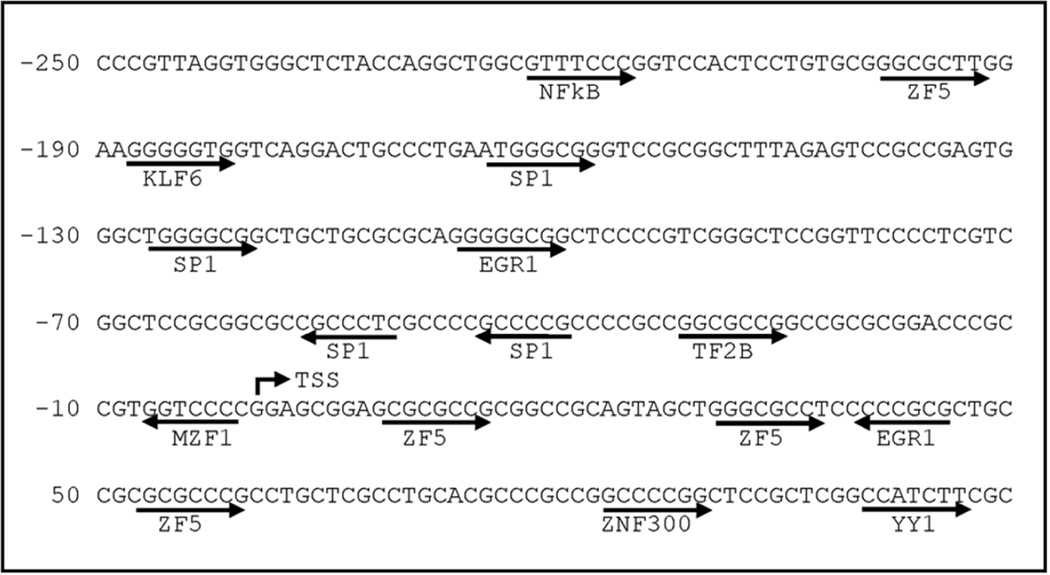
The deletion studies revealed that the −250/+113 region is essential for Prkd1 promoter activity in MN9D cells. Therefore, we performed some computational sequence analyses on the −250/+113 region, which had the highest promoter activity. The −250/+113 region of the mouse Prkd1 promoter was analyzed using Genomatix MatInspector to map the putative transcription factor binding sites and putative binding sites for Sp1, ZF5, ZNF300, NF-κB, KLF6, MZF1, and YY1 were identified within this region (Fig. 2). In silico analysis revealed that four consecutive Sp1 binding sites reside within this proximal promoter region between −165 and −39, suggesting that the Sp-family of transcription factors are likely to play a role in transactivation of Prkd1 promoter.
Figure 2. Putative transcription factor binding sites in the proximal region of the Prkd1 promoter.
Sequence of the promoter region (−250 to +113) with the highest basal promoter activity was analyzed using MatInspector software. Numbering is relative to the transcription start site based on the published Prkd1 cDNA sequence.
Prkd1 promoter expression is stimulated by Sp3 and Sp1, but not Sp4
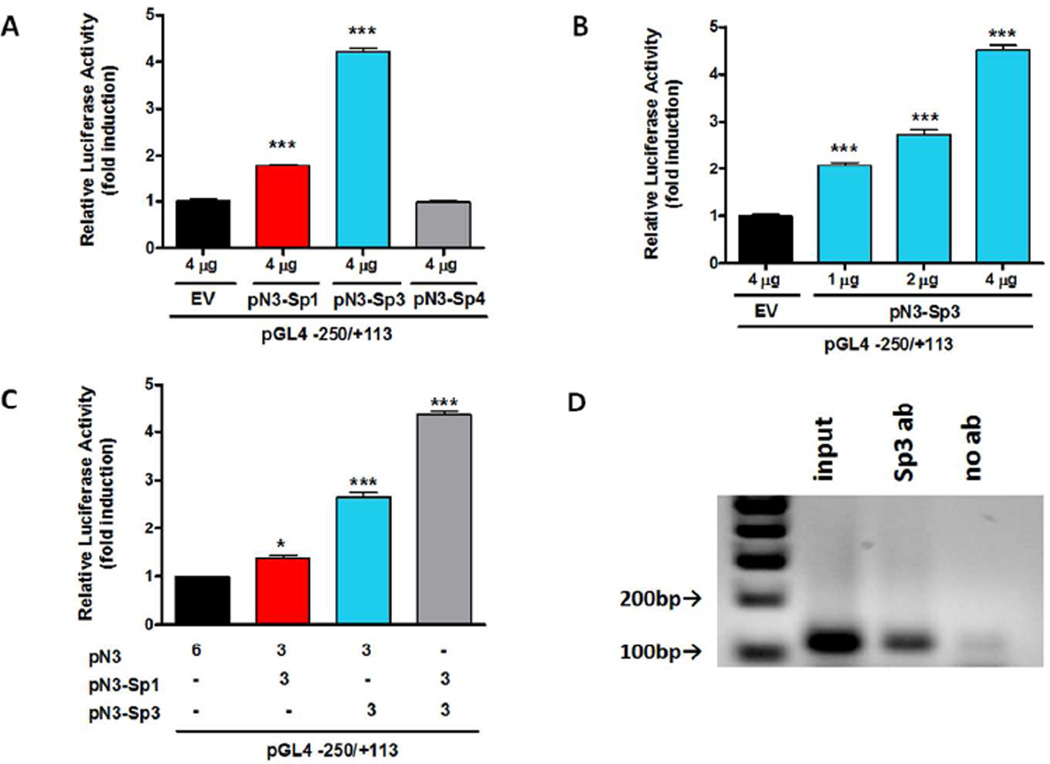
The Sp family members are the major transcription factors binding to the GC box, and other closely related GC-rich motifs with similar binding affinities (Hagen et al. 1994). To investigate the effects of Sp proteins on Prkd1 promoter activity, the Sp1 (pN3-Sp1), Sp3 (pN3-Sp3), and Sp4 (pN3-Sp4) expression vectors were individually cotransfected into MN9D cells with the −250/+113 promoter construct. Overexpression of Sp3 significantly increased Prkd1 promoter activity up to 4.4-fold (Fig. 3A). Additionally, Sp4 overexpression didn’t enhance promoter activity, while Sp1 overexpression increased promoter activity a modest 1.8-fold. Next, MN9D cells were transiently transfected with 1, 2, and 4 µg of the pN3-Sp3 expression plasmid. This overexpression of Sp3 resulted in a dose-dependent increase in the level of Prkd1 promoter activity (Fig. 3B). To investigate how a combination of Sp1 and Sp3 proteins modulates Prkd1 promoter activity, MN9D cells were co-transfected with the −250/+113 promoter construct, 3 µg of the pN3-Sp1 expression plasmid, and 3 µg of the pN3-Sp3 expression plasmid. Co-expression of 3 µg of each pN3-Sp1 and pN3-Sp3 expression vector resulted in 4.4-fold promoter activation (Fig. 3C), which is slightly higher than combined contributions from transfection of individual Sp3 (2.7-fold) and Sp1 (1.4-fold). In addition, chromatin immunoprecipitation assay confirmed that Sp3 binds to the Prkd1 promoter in MN9D cells (Fig. 3D). Collectively, these results suggest that Sp3 is the most potent activator of PKD1 transcription in MN9D cells among these Sp proteins, and that the effects of Sp1 and Sp3 were additive in transactivating the Prkd1 promoter.
Figure 3. Members of the Sp transcription factor family regulate Prkd1 promoter activity in MN9D dopaminergic neuronal cells.
A, MN9D cells were transiently cotransfected with 800 ng of the −250/+113 construct and 4 µg of either pN3-Sp1, pN3-Sp3, pN3-Sp4, or pN3. B, Variable amounts of pN3-Sp3 expression vector were cotransfected with the −250/+113 promoter construct into MN9D cells. C, MN9D cells were transiently cotransfected with the −250/+113 construct and 3 µg of either pN3-Sp1, pN3-Sp3, or both expression plasmids. Luciferase activities were normalized to β-galactosidase activity. Values represent the mean ± SEM of three replicates (*, p<0.05, ***, p<0.001). D, ChIP analysis of Sp3 on PKD1 promoter was performed.
Co-activator CBP stimulates Prkd1 promoter expression
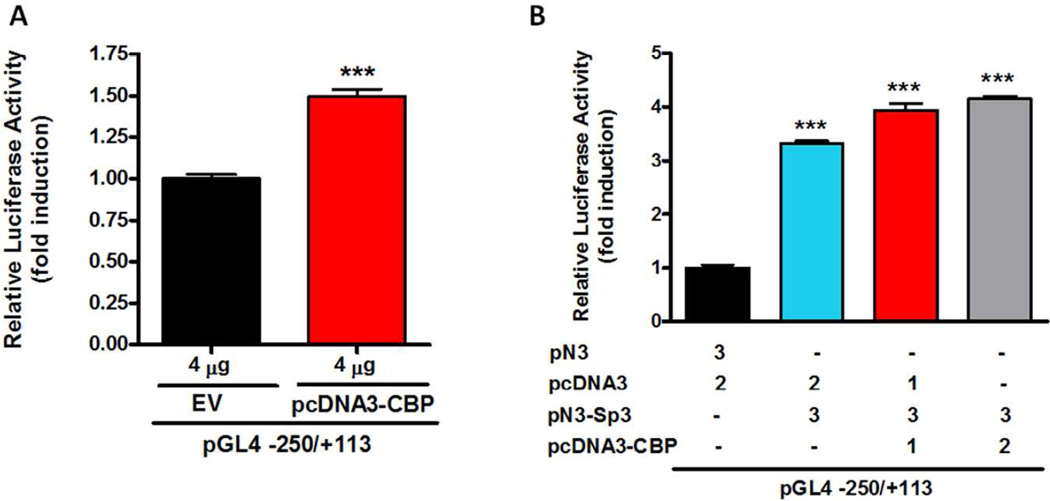
Since CBP can function as a co-activator of Sp transcription factors (Li et al. 2008, Jin et al. 2011a), we analyzed whether it contributes to mouse Prkd1 gene expression. Four micrograms of CBP expression vector (pcDNA3-CBP) was co-transfected into MN9D cells with the −250/+113 promoter construct. CBP overexpression slightly increased (1.5-fold) promoter activity (Fig. 4A). Next, MN9D cells were cotransfected with the −250/+113 construct, with a constant amount of Sp3 (3 µg), and either 1 or 2 µg of the CBP expression plasmid. CBP overexpression enhanced Sp3-mediated transactivation of the Prkd1 promoter (Fig. 4B), suggesting CBP could function as a co-activator of Sp3 in transcriptional regulation of the mouse Prkd1 gene.
Figure 4. CBP enhances Sp3-mediated transactivation of the Prkd1 promoter.
A, MN9D cells were transiently cotransfected with 800 ng of the −250/+113 construct and 4 µg of the pcDNA3-CBP expression vector. B, MN9D cells were transiently cotransfected with 800 ng of the −250/+113 construct, 3 µg of the pN3-Sp3 and varying amounts of the pcDNA3-CBP (0–2 µg) expression vectors. Luciferase activities were normalized to β-galactosidase activity. Values are expressed as the relative fold induction compared with empty vector and represent the mean ± SEM of three replicates (***, p<0.001).
NF-κB-p65 positively regulates the transactivation of Prkd1 promoter activity
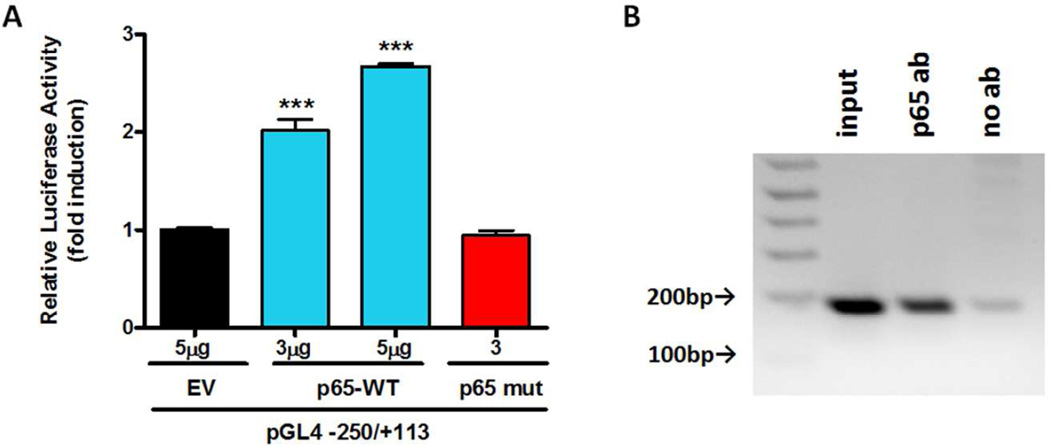
In silico analysis of the Prkd1 promoter revealed a putative NF-κB binding site at the −230 region, which has a high matrix similarity score (0.957). To investigate whether p65 overexpression influences Prkd1 promoter activity, p65 wild-type and mutant expression vectors were individually transfected into MN9D cells with the −250/+113 promoter construct. Overexpression of p65 dose-dependently increased promoter activity by 2- to 2.7-fold (Fig. 5A); however, overexpression of mutant p65 did not affect Prkd1 promoter activity. In addition, ChIP assay confirmed that p65 binds to the Prkd1 promoter for transcriptional activation in MN9D cells (Fig. 5B). Together, these results provide direct evidence that NF-κB is able to transactivate the Prkd1 promoter in MN9D cells.
Figure 5. Effect of p65 overexpression on Prkd1 transcriptional activity.
A, MN9D cells were cotransfected with 800 ng of the −250/+113 construct and 3 and 5 µg of the p65-WT or 3 µg of the p65 mutant expression vectors. Luciferase activities were normalized to β-galactosidase activity. Values represent the mean ± SEM of three replicates (***, p<0.001). B, Binding of NF-κB p65 subunit to the Prkd1 promoter in MN9D cells. Cross-linked chromatin was isolated from MN9D cells. Isolated chromatin was enzymatically digested and immunoprecipitated with anti-NF-κB p65 or antibody-free control. The subsequently purified DNA from immunoprecipitated samples and input was subjected to PCR amplification.
Sp inhibitor Mithramycin A inhibits Prkd1 gene expression
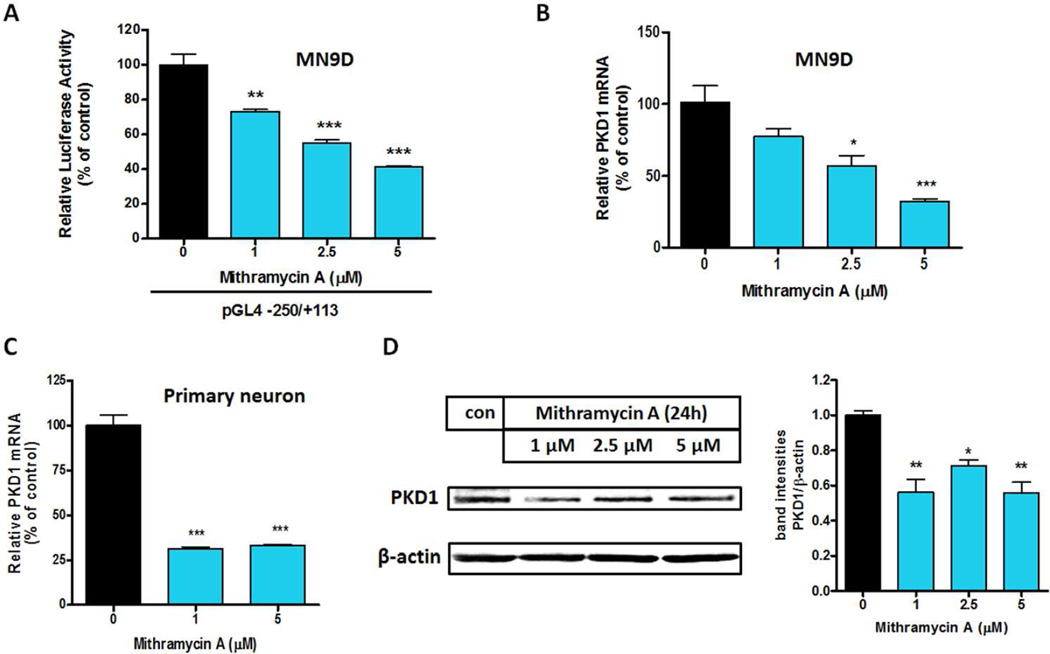
Mithramycin A binds to the GC-rich motif and inhibits the binding of Sp family factors (Shimakura et al. 2005, Cheng et al. 2006) . To substantiate the functional role of Sp transcription factors in Prkd1 gene expression, we explored the effect of Mithramycin A on Prkd1 promoter activity. For this study, MN9D cells were transiently transfected with the −250/+113 promoter construct and treated with non-toxic doses of Mithramycin A. Treatment with Mithramycin A dose-dependently decreased Prkd1 promoter activity, with 5 µM Mithramycin A causing 60% lower promoter activity (Fig. 6A). In addition, quantitative real-time RT-PCR and Western blot analysis were performed to investigate the effects of Mithramycin A on PKD1 mRNA and protein expressions. Treatment with 5 µM Mithramycin A for 24 h significantly reduced PKD1 mRNA expression by ~70% in both MN9D cells (Fig. 6B) and primary mesencephalic neurons (Fig. 6C). Reduced PKD1 protein expression in MN9D cells was also evident by Western blot (Fig. 6D). Again, these results clearly indicate that Sp-factors are important for PKD1 expression.
Figure 6. Sp inhibitor mithramycin A inhibits PKD1 expression.
A, The Prkd1 promoter reporter construct pGL4-250/+113 was transfected into MN9D cells. Six hours post-transfection, MN9D cells were treated with varying concentrations of mithramycin A for 24 hours. Luciferase activities were measured and normalized to β-galactosidase activity. Values represent the mean ± SEM of three replicates (**, p<0.01; ***, p<0.001; between the control and mithramycin A-treated samples). B–C, MN9D cells (B) and primary striatal neurons (C) were treated with varying concentrations of mithramycin A for 24 hours. Real-time RT-PCR analysis of PKD1 mRNA level was performed. Values represent the mean ± SEM of three replicates. D, PKD1 protein expression was analyzed by Western blot.
Up-regulation of Prkd1 gene expression by histone deacetylase inhibitors in MN9D cells
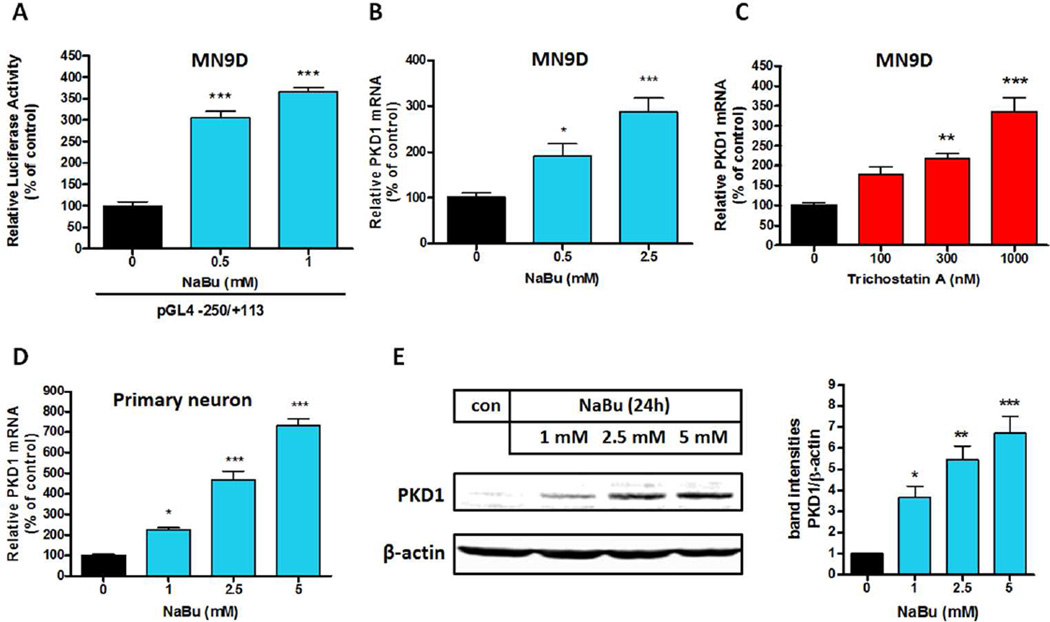
Sodium butyrate (NaBu) and trichostatin A (TSA) regulate the expression of many genes, and they function as histone deacetylase (HDAC) inhibitors (Campanero et al. 2008, Fan et al. 2004, Candido et al. 1978). First, we investigated the effect of NaBu on Prkd1 promoter activity by transiently transfecting MN9D cells with the −250/+113 promoter construct and then treating them with NaBu for 24 h. Treatment with NaBu dose-dependently increased Prkd1 promoter activity (Fig. 7A). We then tested the effects of NaBu and TSA on PKD1 mRNA levels in MN9D cells. NaBu and TSA treatments for 24 h dose-dependently increased PKD1 mRNA expression in MN9D cells and primary mesencephalic neurons (Fig. 7B–D). NaBu treatment also increased PKD1 protein expression in MN9D cells (Fig. 7E). Collectively, these results suggest that HDAC-dependent deacetylation regulates the Prkd1 gene and that the HDAC inhibitors NaBu and TSA can be used to induce PKD1 expression.
Figure 7. Histone deacetylase (HDAC) inhibitors induce PKD1 expression.
A, The Prkd1 promoter reporter construct pGL4-250/+113 was transfected into MN9D cells. After 24 hours post-transfection, MN9D cells were treated with varying concentrations of NaBu for 24 hours. Luciferase activities were measured and normalized to β-galactosidase activity. Values represent the mean ± SEM of three replicates (***, p<0.001; between the control and NaBu-treated samples). B and C, Analysis of PKD1 mRNA expression in MN9D cells treated with varying concentrations of NaBu and TSA for 24 hours. D, Primary neurons were treated with varying concentrations of NaBu for 24 hours. Real-time RT-PCR analysis of PKD1 mRNA level was performed. Values represent the mean ± SEM of three replicates (*, p<0.05, ***, p<0.001; between the control and NaBu-treated samples). E, PKD1 protein expression was analyzed by Western blot.
Methylation status of the mouse Prkd1 promoter region in MN9D cells
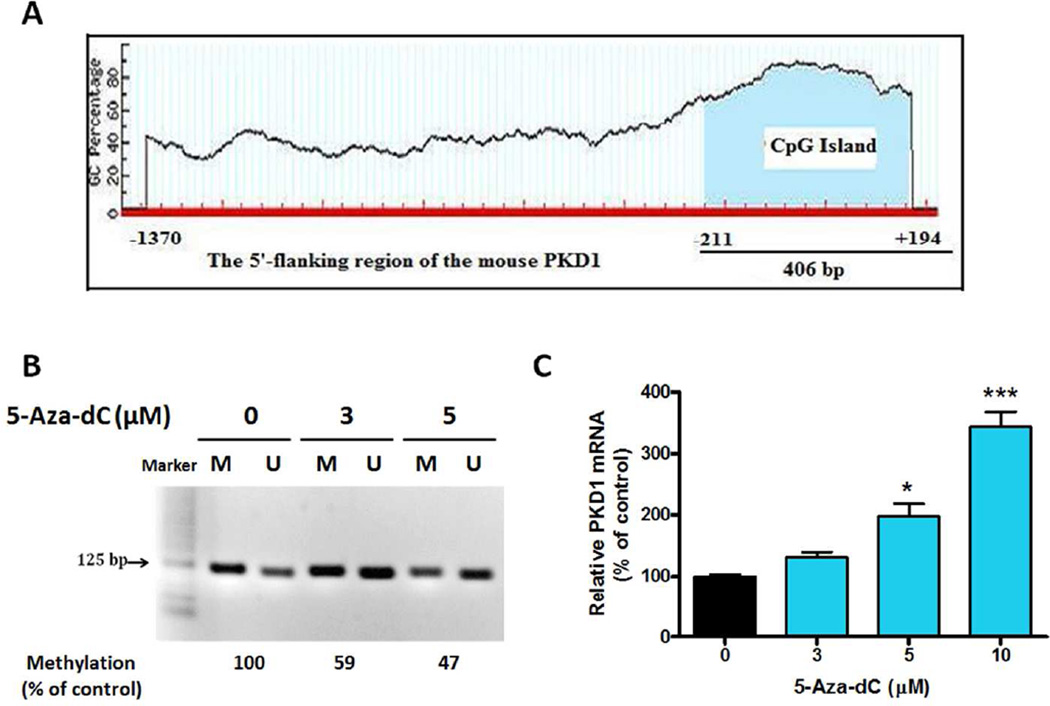
The 5’-flanking region of the mouse Prkd1 was analyzed using the EMBOSS CpGplot program to determine the potential methylation sites. Sequence analysis revealed a putative CpG island spanning positions −211 to +194, fulfilling the criteria for a CpG island with an observed/expected CpG ratio >0.6 and a GC content of more than 50% (Fig. 8A). To further investigate the methylation status of the Prkd1 promoter region in MN9D cells, methylation-specific PCR (MSP) was carried out using specific primer sets for methylated and unmethylated DNA. As shown in Fig. 8B, MSP generated amplicons with the expected size for both primer sets, suggesting that the Prkd1 promoter is in a hemi-methylated state in MN9D cells. After exposure to the DNA methylation inhibitor 5’-aza-dC (5 µM) for 48 h, MSP showed a reduced band intensity corresponding to methylated DNA in contrast to untreated cells, suggesting that 5’-aza-dC can reverse the methylation of the Prkd1 promoter in MN9D cells. Moreover, treatment with nontoxic doses of 5’-aza-dC (Supplemental Fig. 1) for 48 h dose-dependently increased PKD1 mRNA expression (Fig. 8C), further suggesting that DNA methylation down-regulates Prkd1 gene expression in MN9D cells.
Figure 8. 5-Aza-dC induces PKD1 mRNA expression.
A, A putative CpG island, spanning from −211 bp to +194 bp, was found in the promoter region of Prkd1 using the EMBOSS CpGplot program. B, Methylation-specific PCR (MSP) was performed in MN9D cells. Primer sets used for MSP are designated as unmethylated (U) or methylated (M). MN9D cells were treated with either 3 or 5 µM 5-Aza-2’-deoxycytidine (5-Aza-dC) for 48 h. Band intensities were measured using Kodak Image Analyzer. The ratio of methylated to unmethylated band intensities of control samples was arbitrarily set to 100, and other samples were calculated accordingly. C, MN9D cells were treated with varying concentrations of 5-Aza-dC (0–10 µM) for 48 hours. Realtime RT-PCR analysis of PKD1 mRNA level was performed. Values represent the mean ± SEM of three replicates (*, p<0.05; ***, p<0.001; between the control and 5-Aza-dC-treated samples).
Inhibition of PKD1 signaling exacerbates oxidative stress-induced cell death in human dopaminergic neuronal cells
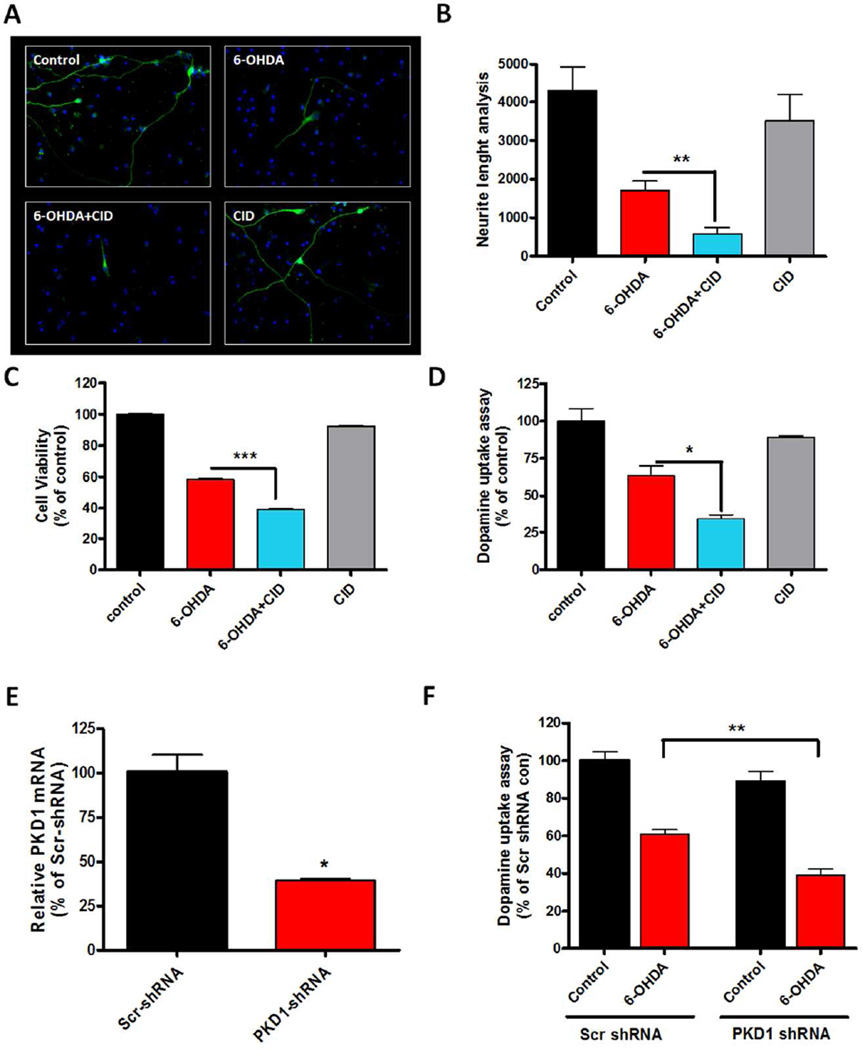
Many neurodegenerative diseases, including PD, have been linked to increased oxidative stress (Tatton et al. 1997, Kitazawa et al. 2002, Yacoubian & Standaert 2009, Jin et al. 2014a, Kanthasamy et al. 2003). In this study, we investigated the role of PKD1 signaling during oxidative stress-induced dopaminergic cell death by pharmacologically inhibiting PKD1 or by shRNA-mediated knockdown of PKD1. First, we used the PKD1 inhibitor CID 755673 to assess the functional significance of PKD1 signaling in oxidative stress induced by the Parkinsonian-specific toxicant 6-OHDA. Differentiated LUHMES cells were exposed to 30 µM 6-OHDA for 24 h with or without CID 755673. First, we measured whether pre- and co-treatment with CID 755673 exacerbated 6-OHDA-induced dopaminergic neurodegeneration by immunocytochemical analysis. Dopaminergic neuronal processes co-treated with 6-OHDA and CID 755673 were significantly shorter than those treated only with 6-OHDA (Fig. 9A–B). We then measured the 6-OHDA-induced neurotoxicity by MTS cell viability and dopamine uptake assays. Treatment with 6-OHDA markedly reduced the cell viability and dopamine uptake activity of TH-positive neurons (Fig. 9C–D). In contrast, pre- and co-treatment with CID 755673 significantly aggravated 6-OHDA-induced neurotoxicity in these assays, whereas CID 755673 alone had no effect on cell viability. Next, we adopted an RNAi-mediated knockdown approach to further substantiate the pro-survival role of PKD1 in dopaminergic neurons. In this study, pre-differentiated LUHMES cells were infected with human PKD1 shRNA lentiviral particles for three days and then treated with 30 µM 6-OHDA for 24 h. PKD1 mRNA was significantly knocked down by PKD1 shRNA lentivirus (Fig. 9E), and knockdown of PKD1 significantly potentiated the 6-OHDA-induced loss of dopamine uptake activity in LUHMES dopaminergic neuronal cells (Fig. 9F). These results collectively suggest that PKD1 plays a pro-survival role during oxidative stress-induced dopaminergic cell death.
Figure 9. Negative modulation of PKD1 signaling exacerbates 6-OHDA-induced oxidative damage in differentiated human dopaminergic LUHMES neuronal cells.
A–D, Differentiated human LUHMES dopaminergic neuronal cells were pre-treated with 20 µM PKD1 inhibitor CID 755673 (CID) for 1 h and then co-treated with 30 µM 6-OHDA for 24 h. For immunocytochemistry, cells were immunostained for TH (green), and the nuclei were counterstained by Hoechst 33342 (blue). Images were taken at 40X magnification. Representative immunofluorescence images are shown (A). The lengths of TH-positive neuronal processes were quantified using MetaMorph (B). 6-OHDA-induced neurotoxicity was measured using the MTS assay (C) and dopamine uptake assay (D). E, LUHMES cells were pre-differentiated for 2 days and then infected with either human PKD1 shRNA or scrambled shRNA lentiviral particles for 3 days. Real-time RT-PCR analysis of PKD1 mRNA level was performed. F, LUHMES cells infected with either PKD1 shRNA or scrambled shRNA lentivirus were treated with 30 µM 6-OHDA for 24 h. Dopaminergic neurotoxicity was assessed by dopamine uptake assay. Data represented as mean ± SEM of two independent experiments performed in triplicate (*, p<0.05; **, p<0.01; ***, p<0.001).
Discussion
Recently, we reported that PKD1 plays a neuroprotective role in dopaminergic neurons during the early stages of oxidative stress (Asaithambi et al. 2011, Asaithambi et al. 2014). Although the mechanisms of PKD1 activation have been investigated in many model systems, very little is known about its transcriptional regulation (Chen et al. 2007, Rykx et al. 2003). Our study is the first to characterize the mouse Prkd1 promoter and its activity. We successfully cloned the 5’-flanking region of the Prkd1 gene and revealed the _cis_-regulatory elements, candidate transcription factors, and potential epigenetic mechanisms involved in the transcriptional regulation of the mouse Prkd1 gene in dopaminergic neuronal cells.
In this study, a roughly 1.6-kb genomic DNA fragment containing the 5’-flanking region and the entire 5’ UTR of the Prkd1 gene were isolated and cloned into a luciferase reporter vector. Deletion analysis of the Prkd1 promoter region suggested the presence of multiple _cis_-regulatory elements that positively or negatively regulate Prkd1 promoter activity (Fig. 1A–B). Interestingly, deletion analysis revealed that the non-coding part of exon 1 harbors very strong repressor and enhancer promoter elements. A strong negative regulatory element (NREI) located between +113 and +250 and a strong positive regulatory element (PREI) located between +43 and +113 were found in the non-coding part of exon 1. These results emphasize the importance of the entire non-coding region of exon 1 for transcriptional regulation of the Prkd1 gene in neuronal cells. Furthermore, another strong positive element (PREII) located between −150 and −7 and a relatively weak negative element (NREII) located between −1370 and −250 were identified within the Prkd1 promoter. Currently, we don’t have any evidence for the role of negative regulatory elements in transcriptional regulation of the Prkd1 gene. Interestingly, our in silico sequence analysis identified multiple binding sites (−968, −478, +165) for the BCL6 transcriptional repressor within the NREI and NREII (data not shown). BCL6 represses the transcription of several genes involved in apoptosis, differentiation and immune responses (Phan & Dalla-Favera 2004, Huang et al. 2014, Sawant et al. 2012). The potential role of BCL6 in transcriptional repression of the Prkd1 gene is yet to be determined. Taken together, transcription of the mouse Prkd1 gene is controlled by multiple positive and negative regulatory _cis_-acting elements.
Our In silico analysis revealed that the Prkd1 promoter is a TATA-less, GC-rich promoter (Fig. 2). Progressive 5’ and 3’ deletion analyses indicated that the promoter region −250/+113 had the strongest promoter activity (~33-fold more than the empty pGL4.14 vector). Further computational analysis of this promoter region identified multiple Sp1 binding sites. The Sp family of transcription factors, including Sp1, Sp2, Sp3, and Sp4, is the most well-characterized GC-rich-motif-binding protein family, and those proteins have been implicated in regulating tissue- and cell-specific gene expression (Lania et al. 1997). Sp1, Sp3, and Sp4 share a high affinity for GC boxes, while Sp2 does not (Hagen et al. 1992). Sp1 and Sp3 are ubiquitously expressed and recognize the same sequence (Han et al. 2001). Although Sp1 primarily functions as a transcriptional activator, Sp3 can function as either a transcriptional activator or repressor (Majello et al. 1997). To investigate the roles of Sp family proteins in the regulation of PKD1 transcription, co-transfection studies using Sp1, Sp3, and Sp4 expression vectors along with the −250/+113 promoter construct were performed. Our results suggested that Sp3 is the strongest transactivator, and both Sp1 and Sp3 are able to transactivate the Prkd1 promoter in MN9D cells (Fig. 3A). Next, we demonstrated how a combination of Sp1 and Sp3 proteins can modulate Prkd1 promoter activity. Co-transfection of Sp1 and Sp3 expression vectors into MN9D cells enhanced promoter activity, suggesting an additive effect of Sp1 and Sp3 in transactivating the mouse Prkd1 promoter. We further confirmed the effects of Sp1 and Sp3 on the Prkd1 promoter by using Mithramycin A to inhibit Sp1/Sp3 binding. Mithramycin A significantly reduced Prkd1 promoter activity as well as mRNA and protein expression in MN9D cells and primary mesencephalic neuronal cultures (Fig. 6A–D). We have previously shown that MN9D dopaminergic cells endogenously express Sp3, but endogenous Sp1 expression couldn’t be detected by Western blot analysis in these cells (Jin et al. 2011a). Therefore, these results suggest that Sp3 plays a more important role than Sp1 in the transcriptional regulation of the mouse Prkd1 gene in MN9D cells.
Sequence analysis also revealed that the Prkd1 promoter harbors a putative NF-kB binding site within the −250/+113 fragment. The active form of NF-κB is a heterodimer mostly composed of p65 and p50 subunits (Baeuerle & Henkel 1994). The transactivation domain of p65 is strong, whereas that of p50 is weak (Schmitz & Baeuerle 1991). Previously, it was shown that PKD1 induces NF-κB activation in HeLa cells exposed to oxidative stress (Storz et al. 2004). In this study, we wanted to investigate whether Prkd1 promoter activity is regulated by NF-κB through a potential feedback mechanism. Since p65 alone can induce transcription, we transiently transfected MN9D cells with the p65 expression vector and the −250/+113 promoter construct. The resulting p65 overexpression significantly increased Prkd1 promoter activity dose-dependently in MN9D cells. These results suggest that, in addition to Sp3, NF-κB binding is also important for basal expression of the Prkd1 gene.
Epigenetic mechanisms, such as DNA methylation and histone modifications, play important roles in gene regulation (Kiela et al. 2001). First, we wanted to study whether histone deacetylases (HDACs) regulate Prkd1 gene expression in MN9D dopaminergic cells because HDACs are important repressors of gene expression (Mariadason et al. 2000). Treating MN9D cells with the HDAC inhibitors NaBu and TSA induced Prkd1 gene expression and also significantly increased Prkd1 promoter activity (Fig. 7A–E). These results suggest that HDACs participate in regulating PKD1 gene expression. However, further investigation is needed to fully characterize the molecular mechanisms underlying HDAC inhibition-mediated activation of the Prkd1 gene. To regulate gene transcription, transcription factors generally interact with co-activators that have histone acetyltransferase (HAT) activity and co-repressors that have histone deacetylase (HDAC) activity (Berger 2002). Acetylation of specific transcription factors has been implicated in both activation and repression of gene expression (Quivy & Van Lint 2004). CREB-binding protein (CBP) is a transcriptional co-activator, which has intrinsic HAT activity and mediates transcriptional activation through acetylation of specific transcription factors (Vo & Goodman 2001). Previously, it was shown that Sp3 is acetylated by the HAT domain of CBP (Braun et al. 2001). In the present study, overexpression of CBP moderately increased Prkd1 promoter activity in MN9D cells. Additionally, co-transfection studies using CBP and Sp3 expression vectors indicated that CBP enhances Sp3-mediated transactivation of the mouse Prkd1 promoter in MN9D cells, suggesting that CBP might play an important role in transcriptional regulation of the mouse Prkd1 gene by cooperating with the Sp3 transcription factor. Next, because of the high GC content of the Prkd1 promoter, we investigated whether DNA methylation plays any role in the transcriptional regulation of Prkd1 in neurons. Sequence analysis revealed the presence of a CpG island within the Prkd1 promoter, and DNA methylation of CpG islands is known to be involved in regulating several genes with GC-rich promoters (Singal & Ginder 1999). Here, we demonstrated the presence of a functionally active CpG island in the Prkd1 promoter region. Methylation-specific PCR clearly showed that the CpG island was partially methylated in MN9D dopaminergic cells. Treatment with the DNA methylation inhibitor 5’-aza-dC reversed the methylation of the Prkd1 promoter and dose-dependently increased PKD1 mRNA expression. These findings revealed that DNA methylation also contributes to Prkd1 gene expression in MN9D dopaminergic cells. Taken together, these results suggest that DNA methylation and histone acetylation are functionally involved in the epigenetic regulation of the mouse Prkd1 gene in MN9D cells. Our subsequent functional studies using a PKD1 inhibitor and shRNA medicated knockdown in a human dopaminergic neuronal model confirmed the pro-survival role of PKD1. It is noteworthy that human PRKD1 and mouse Prkd1 promoters are relatively well conserved (>60% homology, Supplemental Fig. 2).
In summary, we cloned and characterized, for the first time, the mouse Prkd1 promoter. We have identified multiple positive and negative regulatory elements in the promoter of the mouse Prkd1 gene. Maximal promoter activity, elevated ~33-fold over control vector, was obtained between nucleotides −250 and +113, suggesting that the non-coding exon1 plays a crucial role in transcriptional regulation of Prkd1. Our results also clearly indicate that the transcription factors Sp1, Sp3 and NF-κB-p65 can transactivate the mouse Prkd1 promoter in MN9D cells. Importantly, chromatin immunoprecipitation assays confirmed that Sp3 and NF-κB-p65 transcription factors can physically bind to the Prkd1 promoter in MN9D cells. We have also shown that CBP augments Sp3-mediated transactivation of the mouse Prkd1 promoter. Moreover, our results provide evidence for the role of epigenetic mechanisms such as DNA methylation and histone acetylation in regulating the mouse Prkd1 gene in MN9D cells. Furthermore, functional studies with human dopaminergic neuronal cells revealed that negative modulation of PKD1 signaling increases the sensitivity of dopaminergic neuronal cells to oxidative stress. These findings provide a basis for future investigations into the molecular regulation of PKD1 signaling in oxidative damage in Parkinson’s disease models. Our results might also have important implications for the development of novel drugs for PD since PKD1 appears to play a neuroprotective role during the early stages of oxidative stress in dopaminergic neurons.
Supplementary Material
01
Acknowledgments
The authors acknowledge Gary Zenitsky for his assistance in the preparation of this manuscript. This work was supported by National Institutes of Health (NIH) [Grants NS074443, and ES10586]. The W. Eugene and Linda Lloyd Endowed Chair to A.G.K. and the Dean Professorship to AK are also acknowledged. A.G.K. and V.A. are shareholders of PK Biosciences Corporation (Ames, IA), which is interested in translating mechanistic studies into therapies targeting kinases including PKD1.
The abbreviations used are
PKD1
protein kinase D1
PKD2
protein kinase D2
PKD3
protein kinase D3
CAMK
calcium/calmodulin-dependent protein kinase
nNOS
neuronal nitric oxide synthase
6-OHDA
6-hydroxydopamine
MA
mithramycin A
TSA
trichostatin A
NaBu
sodium butyrate
LUHMES
Lund human mesencephalic
ChIP
chromatin immunoprecipitation
5-aza-dC
5-Aza-2’-deoxycytidine
MSP
methylation-specific PCR
MTS
3-(4,5-dimethylthiazol-2-yl)-5-(3-carboxymethoxyphenyl)-2-(4-sulfophenyl)-2H–tetrazolium
TH
tyrosine hydroxylase
Inr
initiator element
DPE
downstream promoter element
UTR
untranslated region
CBP
CREB-binding protein
HDAC
histone deacetylase
NRE
negative regulatory element
PRE
positive regulatory element
HAT
histone acetyltransferase
Footnotes
The other authors have no conflicts of interest.
REFERENCES
- Asaithambi A, Ay M, Jin H, Gosh A, Anantharam V, Kanthasamy A, Kanthasamy AG. Protein kinase D1 (PKD1) phosphorylation promotes dopaminergic neuronal survival during 6-OHDA-induced oxidative stress. PloS one. 2014;9:e96947. doi: 10.1371/journal.pone.0096947. [DOI] [PMC free article] [PubMed] [Google Scholar]
- Asaithambi A, Kanthasamy A, Saminathan H, Anantharam V, Kanthasamy AG. Protein kinase D1 (PKD1) activation mediates a compensatory protective response during early stages of oxidative stress-induced neuronal degeneration. Molecular neurodegeneration. 2011;6:43. doi: 10.1186/1750-1326-6-43. [DOI] [PMC free article] [PubMed] [Google Scholar]
- Baeuerle PA, Henkel T. Function and activation of NF-kappa B in the immune system. Annual review of immunology. 1994;12:141–179. doi: 10.1146/annurev.iy.12.040194.001041. [DOI] [PubMed] [Google Scholar]
- Berger SL. Histone modifications in transcriptional regulation. Current opinion in genetics & development. 2002;12:142–148. doi: 10.1016/s0959-437x(02)00279-4. [DOI] [PubMed] [Google Scholar]
- Besirli CG, Johnson EM., Jr The activation loop phosphorylation of protein kinase D is an early marker of neuronal DNA damage. Journal of neurochemistry. 2006;99:218–225. doi: 10.1111/j.1471-4159.2006.04116.x. [DOI] [PubMed] [Google Scholar]
- Bisbal M, Conde C, Donoso M, et al. Protein kinase d regulates trafficking of dendritic membrane proteins in developing neurons. J Neurosci. 2008;28:9297–9308. doi: 10.1523/JNEUROSCI.1879-08.2008. [DOI] [PMC free article] [PubMed] [Google Scholar]
- Borges S, Doppler H, Perez EA, Andorfer CA, Sun Z, Anastasiadis PZ, Thompson EA, Geiger XJ, Storz P. Pharmacologic reversion of epigenetic silencing of the PRKD1 promoter blocks breast tumor cell invasion and metastasis. Breast Cancer Res. 2013;15:R66. doi: 10.1186/bcr3460. [DOI] [PMC free article] [PubMed] [Google Scholar]
- Braun H, Koop R, Ertmer A, Nacht S, Suske G. Transcription factor Sp3 is regulated by acetylation. Nucleic acids research. 2001;29:4994–5000. doi: 10.1093/nar/29.24.4994. [DOI] [PMC free article] [PubMed] [Google Scholar]
- Burke TW, Kadonaga JT. Drosophila TFIID binds to a conserved downstream basal promoter element that is present in many TATA-box-deficient promoters. Genes & development. 1996;10:711–724. doi: 10.1101/gad.10.6.711. [DOI] [PubMed] [Google Scholar]
- Campanero MR, Herrero A, Calvo V. The histone deacetylase inhibitor trichostatin A induces GADD45 gamma expression via Oct and NF-Y binding sites. Oncogene. 2008;27:1263–1272. doi: 10.1038/sj.onc.1210735. [DOI] [PubMed] [Google Scholar]
- Candido EP, Reeves R, Davie JR. Sodium butyrate inhibits histone deacetylation in cultured cells. Cell. 1978;14:105–113. doi: 10.1016/0092-8674(78)90305-7. [DOI] [PubMed] [Google Scholar]
- Cartharius K, Frech K, Grote K, Klocke B, Haltmeier M, Klingenhoff A, Frisch M, Bayerlein M, Werner T. MatInspector and beyond: promoter analysis based on transcription factor binding sites. Bioinformatics. 2005;21:2933–2942. doi: 10.1093/bioinformatics/bti473. [DOI] [PubMed] [Google Scholar]
- Chen JY, Wei CC, Chiou MJ, Su HY, Kuo CM. Cloning and expression analysis of a protein kinase C gene, PKCmu, and its regulation of the promoter region in zebrafish. DNA and cell biology. 2007;26:415–424. doi: 10.1089/dna.2006.0569. [DOI] [PubMed] [Google Scholar]
- Cheng YH, Imir A, Suzuki T, Fenkci V, Yilmaz B, Sasano H, Bulun SE. SP1 and SP3 mediate progesterone-dependent induction of the 17beta hydroxysteroid dehydrogenase type 2 gene in human endometrium. Biology of reproduction. 2006;75:605–614. doi: 10.1095/biolreprod.106.051912. [DOI] [PubMed] [Google Scholar]
- Fan X, Roy EM, Murphy TC, Nanes MS, Kim S, Pike JW, Rubin J. Regulation of RANKL promoter activity is associated with histone remodeling in murine bone stromal cells. Journal of cellular biochemistry. 2004;93:807–818. doi: 10.1002/jcb.20217. [DOI] [PubMed] [Google Scholar]
- Ghosh A, Saminathan H, Kanthasamy A, et al. The peptidyl-prolyl isomerase Pin1 up-regulation and proapoptotic function in dopaminergic neurons: relevance to the pathogenesis of Parkinson disease. The Journal of biological chemistry. 2013;288:21955–21971. doi: 10.1074/jbc.M112.444224. [DOI] [PMC free article] [PubMed] [Google Scholar]
- Hagen G, Muller S, Beato M, Suske G. Cloning by recognition site screening of two novel GT box binding proteins: a family of Sp1 related genes. Nucleic acids research. 1992;20:5519–5525. doi: 10.1093/nar/20.21.5519. [DOI] [PMC free article] [PubMed] [Google Scholar]
- Hagen G, Muller S, Beato M, Suske G. Sp1-mediated transcriptional activation is repressed by Sp3. The EMBO journal. 1994;13:3843–3851. doi: 10.1002/j.1460-2075.1994.tb06695.x. [DOI] [PMC free article] [PubMed] [Google Scholar]
- Han B, Liu N, Yang X, Sun HB, Yang YC. MRG1 expression in fibroblasts is regulated by Sp1/Sp3 and an Ets transcription factor. The Journal of biological chemistry. 2001;276:7937–7942. doi: 10.1074/jbc.M007470200. [DOI] [PubMed] [Google Scholar]
- Harischandra DS, Jin H, Anantharam V, Kanthasamy A, Kanthasamy AG. alpha-Synuclein Protects Against Manganese Neurotoxic Insult During the Early Stages of Exposure in a Dopaminergic Cell Model of Parkinson’s Disease. Toxicological sciences : an official journal of the Society of Toxicology. 2015;143:454–468. doi: 10.1093/toxsci/kfu247. [DOI] [PMC free article] [PubMed] [Google Scholar]
- Huang C, Geng H, Boss I, Wang L, Melnick A. Cooperative transcriptional repression by BCL6 and BACH2 in germinal center B-cell differentiation. Blood. 2014;123:1012–1020. doi: 10.1182/blood-2013-07-518605. [DOI] [PMC free article] [PubMed] [Google Scholar]
- Jamora C, Yamanouye N, Van Lint J, Laudenslager J, Vandenheede JR, Faulkner DJ, Malhotra V. Gbetagamma-mediated regulation of Golgi organization is through the direct activation of protein kinase D. Cell. 1999;98:59–68. doi: 10.1016/S0092-8674(00)80606-6. [DOI] [PubMed] [Google Scholar]
- Jin H, Kanthasamy A, Anantharam V, Rana A, Kanthasamy AG. Transcriptional regulation of pro-apoptotic protein kinase Cdelta: implications for oxidative stress-induced neuronal cell death. The Journal of biological chemistry. 2011a;286:19840–19859. doi: 10.1074/jbc.M110.203687. [DOI] [PMC free article] [PubMed] [Google Scholar]
- Jin H, Kanthasamy A, Ghosh A, Anantharam V, Kalyanaraman B, Kanthasamy AG. Mitochondria-targeted antioxidants for treatment of Parkinson’s disease: preclinical and clinical outcomes. Biochimica et biophysica acta. 2014a;1842:1282–1294. doi: 10.1016/j.bbadis.2013.09.007. [DOI] [PMC free article] [PubMed] [Google Scholar]
- Jin H, Kanthasamy A, Ghosh A, Yang Y, Anantharam V, Kanthasamy AG. alpha-Synuclein negatively regulates protein kinase Cdelta expression to suppress apoptosis in dopaminergic neurons by reducing p300 histone acetyltransferase activity. J Neurosci. 2011b;31:2035–2051. doi: 10.1523/JNEUROSCI.5634-10.2011. [DOI] [PMC free article] [PubMed] [Google Scholar]
- Jin H, Kanthasamy A, Harischandra DS, Kondru N, Ghosh A, Panicker N, Anantharam V, Rana A, Kanthasamy AG. Histone hyperacetylation up-regulates protein kinase Cdelta in dopaminergic neurons to induce cell death: relevance to epigenetic mechanisms of neurodegeneration in Parkinson disease. The Journal of biological chemistry. 2014b;289:34743–34767. doi: 10.1074/jbc.M114.576702. [DOI] [PMC free article] [PubMed] [Google Scholar]
- Kanthasamy AG, Anantharam V, Zhang D, Latchoumycandane C, Jin H, Kaul S, Kanthasamy A. A novel peptide inhibitor targeted to caspase-3 cleavage site of a proapoptotic kinase protein kinase C delta (PKCdelta) protects against dopaminergic neuronal degeneration in Parkinson’s disease models. Free radical biology & medicine. 2006;41:1578–1589. doi: 10.1016/j.freeradbiomed.2006.08.016. [DOI] [PubMed] [Google Scholar]
- Kanthasamy AG, Kitazawa M, Kanthasamy A, Anantharam V. Role of proteolytic activation of protein kinase Cdelta in oxidative stress-induced apoptosis. Antioxidants & redox signaling. 2003;5:609–620. doi: 10.1089/152308603770310275. [DOI] [PubMed] [Google Scholar]
- Kiela PR, Hines ER, Collins JF, Ghishan FK. Regulation of the rat NHE3 gene promoter by sodium butyrate. American journal of physiology. 2001;281:G947–G956. doi: 10.1152/ajpgi.2001.281.4.G947. [DOI] [PubMed] [Google Scholar]
- Kitazawa M, Wagner JR, Kirby ML, Anantharam V, Kanthasamy AG. Oxidative stress and mitochondrial-mediated apoptosis in dopaminergic cells exposed to methylcyclopentadienyl manganese tricarbonyl. The Journal of pharmacology and experimental therapeutics. 2002;302:26–35. doi: 10.1124/jpet.302.1.26. [DOI] [PubMed] [Google Scholar]
- Lania L, Majello B, De Luca P. Transcriptional regulation by the Sp family proteins. The international journal of biochemistry & cell biology. 1997;29:1313–1323. doi: 10.1016/s1357-2725(97)00094-0. [DOI] [PubMed] [Google Scholar]
- Latchoumycandane C, Anantharam V, Jin H, Kanthasamy A, Kanthasamy A. Dopaminergic neurotoxicant 6-OHDA induces oxidative damage through proteolytic activation of PKCdelta in cell culture and animal models of Parkinson’s disease. Toxicology and applied pharmacology. 2011;256:314–323. doi: 10.1016/j.taap.2011.07.021. [DOI] [PMC free article] [PubMed] [Google Scholar]
- Li LC, Dahiya R. MethPrimer: designing primers for methylation PCRs. Bioinformatics (Oxford, England) 2002;18:1427–1431. doi: 10.1093/bioinformatics/18.11.1427. [DOI] [PubMed] [Google Scholar]
- Li Y, Kimura T, Huyck RW, Laity JH, Andrews GK. Zinc-induced formation of a coactivator complex containing the zinc-sensing transcription factor MTF-1, p300/CBP, and Sp1. Molecular and cellular biology. 2008;28:4275–4284. doi: 10.1128/MCB.00369-08. [DOI] [PMC free article] [PubMed] [Google Scholar]
- Majello B, De Luca P, Lania L. Sp3 is a bifunctional transcription regulator with modular independent activation and repression domains. The Journal of biological chemistry. 1997;272:4021–4026. doi: 10.1074/jbc.272.7.4021. [DOI] [PubMed] [Google Scholar]
- Manning G, Plowman GD, Hunter T, Sudarsanam S. Evolution of protein kinase signaling from yeast to man. Trends in biochemical sciences. 2002;27:514–520. doi: 10.1016/s0968-0004(02)02179-5. [DOI] [PubMed] [Google Scholar]
- Mariadason JM, Corner GA, Augenlicht LH. Genetic reprogramming in pathways of colonic cell maturation induced by short chain fatty acids: comparison with trichostatin A, sulindac, and curcumin and implications for chemoprevention of colon cancer. Cancer research. 2000;60:4561–4572. [PubMed] [Google Scholar]
- Phan RT, Dalla-Favera R. The BCL6 proto-oncogene suppresses p53 expression in germinal-centre B cells. Nature. 2004;432:635–639. doi: 10.1038/nature03147. [DOI] [PubMed] [Google Scholar]
- Prigozhina NL, Waterman-Storer CM. Protein kinase D-mediated anterograde membrane trafficking is required for fibroblast motility. Curr Biol. 2004;14:88–98. doi: 10.1016/j.cub.2004.01.003. [DOI] [PubMed] [Google Scholar]
- Quivy V, Van Lint C. Regulation at multiple levels of NF-kappaB-mediated transactivation by protein acetylation. Biochemical pharmacology. 2004;68:1221–1229. doi: 10.1016/j.bcp.2004.05.039. [DOI] [PubMed] [Google Scholar]
- Rozengurt E, Rey O, Waldron RT. Protein kinase D signaling. The Journal of biological chemistry. 2005;280:13205–13208. doi: 10.1074/jbc.R500002200. [DOI] [PubMed] [Google Scholar]
- Rykx A, De Kimpe L, Mikhalap S, Vantus T, Seufferlein T, Vandenheede JR, Van Lint J. Protein kinase D: a family affair. FEBS letters. 2003;546:81–86. doi: 10.1016/s0014-5793(03)00487-3. [DOI] [PubMed] [Google Scholar]
- Sanchez-Ruiloba L, Aicart-Ramos C, Garcia-Guerra L, Pose-Utrilla J, Rodriguez-Crespo I, Iglesias T. Protein kinase D interacts with neuronal nitric oxide synthase and phosphorylates the activatory residue serine 1412. PloS one. 2014;9:e95191. doi: 10.1371/journal.pone.0095191. [DOI] [PMC free article] [PubMed] [Google Scholar]
- Sawant DV, Sehra S, Nguyen ET, et al. Bcl6 controls the Th2 inflammatory activity of regulatory T cells by repressing Gata3 function. Journal of immunology. 2012;189:4759–4769. doi: 10.4049/jimmunol.1201794. [DOI] [PMC free article] [PubMed] [Google Scholar]
- Schmitz ML, Baeuerle PA. The p65 subunit is responsible for the strong transcription activating potential of NF-kappa B. The EMBO journal. 1991;10:3805–3817. doi: 10.1002/j.1460-2075.1991.tb04950.x. [DOI] [PMC free article] [PubMed] [Google Scholar]
- Shimakura J, Terada T, Katsura T, Inui K. Characterization of the human peptide transporter PEPT1 promoter: Sp1 functions as a basal transcriptional regulator of human PEPT1. American journal of physiology. 2005;289:G471–G477. doi: 10.1152/ajpgi.00025.2005. [DOI] [PubMed] [Google Scholar]
- Sidorenko SP, Law CL, Klaus SJ, Chandran KA, Takata M, Kurosaki T, Clark EA. Protein kinase C mu (PKC mu) associates with the B cell antigen receptor complex and regulates lymphocyte signaling. Immunity. 1996;5:353–363. doi: 10.1016/s1074-7613(00)80261-7. [DOI] [PubMed] [Google Scholar]
- Singal R, Ginder GD. DNA methylation. Blood. 1999;93:4059–4070. [PubMed] [Google Scholar]
- Song J, Li J, Qiao J, Jain S, Mark Evers B, Chung DH. PKD prevents H2O2-induced apoptosis via NF-kappaB and p38 MAPK in RIE-1 cells. Biochemical and biophysical research communications. 2009;378:610–614. doi: 10.1016/j.bbrc.2008.11.106. [DOI] [PMC free article] [PubMed] [Google Scholar]
- Storz P. Mitochondrial ROS--radical detoxification, mediated by protein kinase D. Trends in cell biology. 2007;17:13–18. doi: 10.1016/j.tcb.2006.11.003. [DOI] [PubMed] [Google Scholar]
- Storz P, Doppler H, Toker A. Activation loop phosphorylation controls protein kinase D-dependent activation of nuclear factor kappaB. Molecular pharmacology. 2004;66:870–879. doi: 10.1124/mol.104.000687. [DOI] [PubMed] [Google Scholar]
- Tatton WG, Chalmers-Redman RM, Ju WY, Wadia J, Tatton NA. Apoptosis in neurodegenerative disorders: potential for therapy by modifying gene transcription. Journal of neural transmission. 1997;49:245–268. doi: 10.1007/978-3-7091-6844-8_25. [DOI] [PubMed] [Google Scholar]
- Van Lint J, Ni Y, Valius M, Merlevede W, Vandenheede JR. Platelet-derived growth factor stimulates protein kinase D through the activation of phospholipase Cgamma and protein kinase C. The Journal of biological chemistry. 1998;273:7038–7043. doi: 10.1074/jbc.273.12.7038. [DOI] [PubMed] [Google Scholar]
- Vo N, Goodman RH. CREB-binding protein and p300 in transcriptional regulation. The Journal of biological chemistry. 2001;276:13505–13508. doi: 10.1074/jbc.R000025200. [DOI] [PubMed] [Google Scholar]
- Yacoubian TA, Standaert DG. Targets for neuroprotection in Parkinson’s disease. Biochimica et biophysica acta. 2009;1792:676–687. doi: 10.1016/j.bbadis.2008.09.009. [DOI] [PMC free article] [PubMed] [Google Scholar]
Associated Data
This section collects any data citations, data availability statements, or supplementary materials included in this article.
Supplementary Materials
01
