Visualization of immediate immune responses to pioneer metastatic cells in the lung (original) (raw)
. Author manuscript; available in PMC: 2016 Jun 3.
Published in final edited form as: Nature. 2016 Mar 16;531(7595):513–517. doi: 10.1038/nature16985
Abstract
Lung metastasis is the lethal determinant in many cancers1,2 and a number of lines of evidence point to monocytes and macrophages having key roles in its development3–5. Yet little is known about the immediate fate of incoming tumour cells as they colonize this tissue and even less known about how they make first contact with the immune system. Primary tumours liberate circulating tumour cells (CTCs) into the blood and we have developed a stable intravital two-photon lung imaging model in mice6 for direct observation of the arrival of CTCs and subsequent host interaction. Here we show dynamic generation of tumour microparticles in shear flow in the capillaries within minutes of CTC entry. Rather than dispersing under flow, many of these microparticles remain attached to the lung vasculature or independently migrate along the inner walls of vessels. Using fluorescent lineage reporters and flow cytometry, we observed ‘waves’ of distinct myeloid cell subsets that load differentially and sequentially with this CTC-derived material. Many of these tumour-ingesting myeloid cells collectively accumulated in the lung interstitium along with the successful metastatic cells and, as previously understood, promote the development of successful metastases from surviving tumour cells3. Although the numbers of these cells rise globally in the lung with metastatic exposure and ingesting myeloid cells undergo phenotypic changes associated with microparticle ingestion, a consistently sparse population of resident conventional dendritic cells, among the last cells to interact with CTCs, confer antimetastatic protection. This work reveals that CTC fragmentation generates immune-interacting intermediates, and defines a competitive relationship between phagocyte populations for tumour loading during metastatic cell seeding.
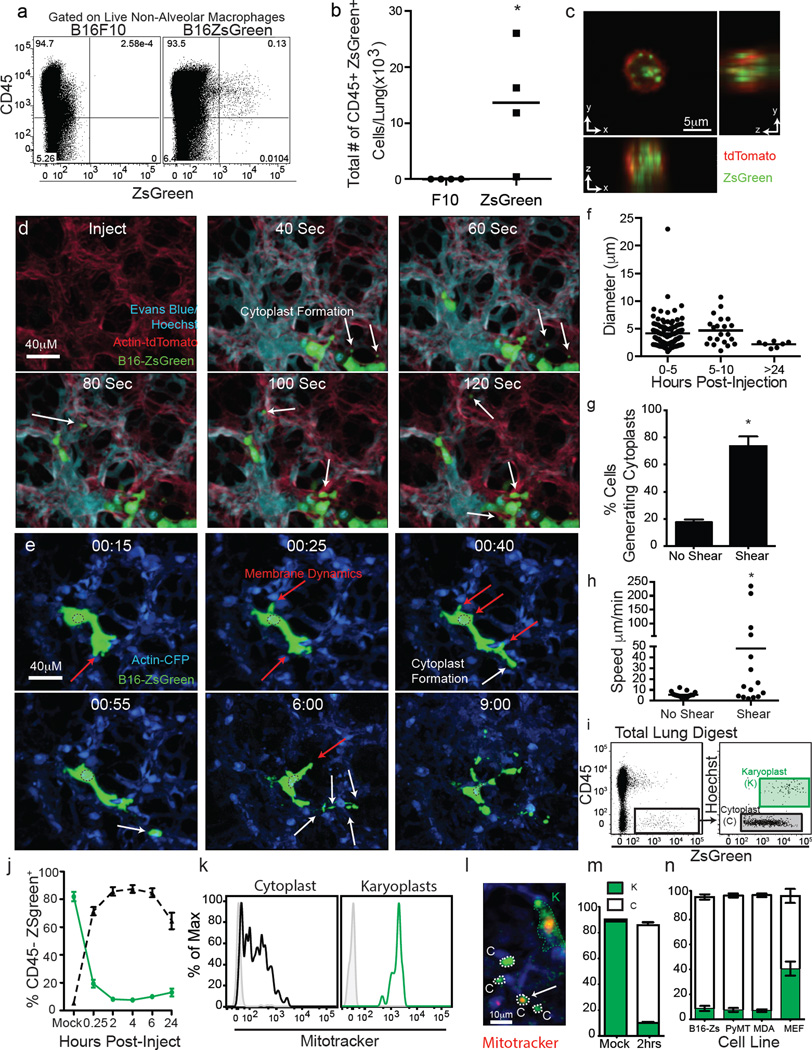
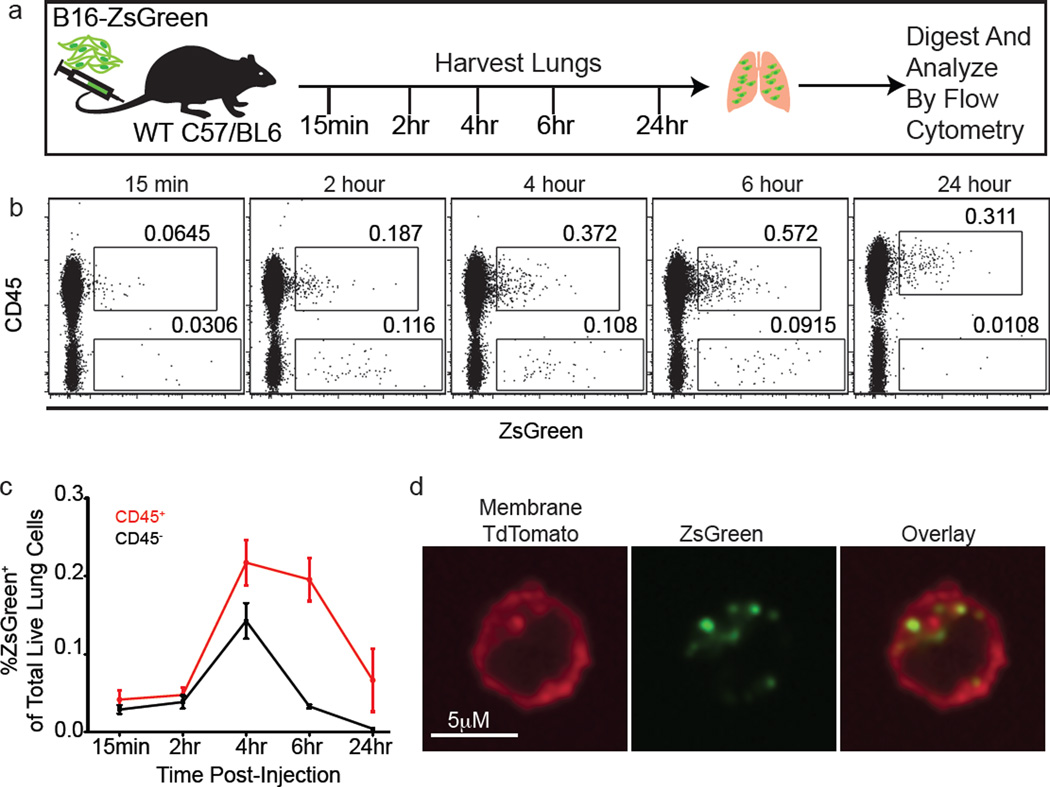
Primary tumours induce distal accumulation of immune cells in the lung that promote metastasis4,5. B16F10 subcutaneous tumours, expressing ZsGreen (hereafter referred to as B16ZsGreen), resulted in CD45+ZsGreen+ (immune) cells in the lung before the appearance of micrometastases (Fig. 1a, b). These cells contained vesicular ZsGreen+ puncta, suggesting ingestion of tumour fragments (Fig. 1c). An experimental metastasis model, intravenous (i.v.) injection of B16ZsGreen cells, revealed similar loading of intracellular vesicles in CD45+ cells over 24 h (Extended Data Fig. 1a–c). Notably, CD45+ZsGreen+ cells increased rapidly within 4 h after injection, and exceeded the initial frequency of the B16ZsGreen cells (Extended Data Fig. 1c), suggesting a cell-fragment origin of ingested tumour material. These CD45+ZsGreen+ cells again had puncta of ingested tumour material (Extended Data Fig. 1d).
Figure 1. Intravital imaging of the first hours of lung seeding by B16 melanoma.
a, Representative plots of CD45+ZSgreen+ cells in lungs of mice bearing 2-week primary B16 melanoma tumours with or without ZsGreen expression. Alveolar macrophages were excluded, as auto-fluorescent signal interfered with ZsGreen discrimination. b, Absolute number of CD45+ZsGreen+ and CD45−ZsGreen+ cells in lungs from a. *P = 0.0421 by unpaired _t_-test, horizontal bars represent mean value. c, Confocal imaging of sorted CD45+ZsGreen+ cells from lungs of mTmG mouse (ubiquitous expression of membrane-bound TdTomato) bearing tumours as per a. Red, TdTomato; green, ZsGreen. d, e, LIVM after i.v. injection of Hoechst-labelled B16ZsGreen cells into mTmG mice with Evan’s Blue labelling vascular flow (see also Supplementary Video 1) (d). LIVM Hoechst-labelled B16ZsGreen cells from 15 min to 9 h after i.v. injection into actin–CFP recipient (see also Supplementary Video 2) (e). White arrows highlight the formation of cytoplasmic blebs (cytoplasts) and red arrows highlight regions of membrane activity (extension or retraction). Representative of at least 10 mice. f, Cytoplast diameter at 0–5 h, 5–10 h and >24 h after injection, horizontal bars are mean values. g, Percent cytoplast producing B16ZsGreen cells from non-shear (slice imaging) or shear (LIVM) (15 cells per group from 3 mice; *P = 0.002 by unpaired _t_-test, error bars are standard deviation). h, Cytoplast speed in non-shear or shear conditions as f (15 cytoplasts per group in 3 mice; *P = 0.036, unpaired _t_-test, horizontal bars are mean values). i, Gating strategy for karyoplast and cytoplast discrimination within lung single-cell suspension. j, In vivo mean cytoplast and karyoplast frequency in lung (n = 6 per group), error bars are standard deviation. k, Mitotracker staining of cytoplasts and karyoplasts. l, LIVM of mitotracker labelled B16ZsGreen cells. m, In vivo cytoplast frequency in lung 2 h after injection of primary-isolated B16ZsGreen cells or mock injected. Green, karyoplasts; white, cytoplasts. n = 4 per group, error bars are standard deviation. n, In vivo cytoplast frequency 2 h after injection of B16ZsGreen, murine breast tumour (PyMT-B), human breast tumour (MDA-MB-231), and non-transformed primary mouse embryonic fibroblasts (n = 3 per group from 2 experiments, error bars are standard deviation.)
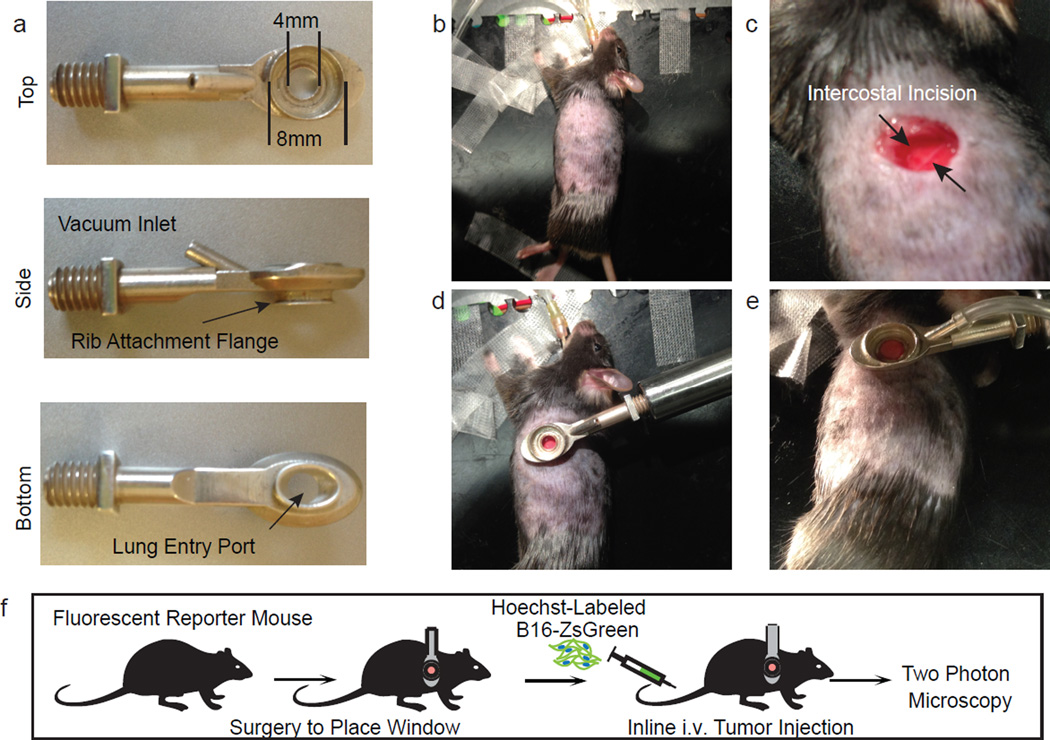
Previous work has established roles for primary tumour-derived exosomes (≤200 nm in diameter) in the lung pre-metastatic niche7. However, the size of inclusions within sorted CD45+ZsGreen+ cells (diameters often ≥1 µm (Fig. 1c and Extended Data Fig. 1d)) suggested that this might occur via a distinct mechanism. As CTCs are detectable in the blood of patients with metastatic disease8, we sought to visualize their fate upon entering the lung vasculature. To image the arrival of injected B16ZsGreen metastatic cells in lung capillaries, we updated our published method for lung intravital microscopy (LIVM)6 using a novel intercostal window (Extended Data Fig. 2a–e) allowing for stable imaging of ≤12 h (Extended Data Fig. 2f). Figure 1d and Supplementary Video 1 show that within seconds of arrival, the incoming CTCs became lodged in capillaries and began to shed microscale blebs (microparticles) into the vasculature.
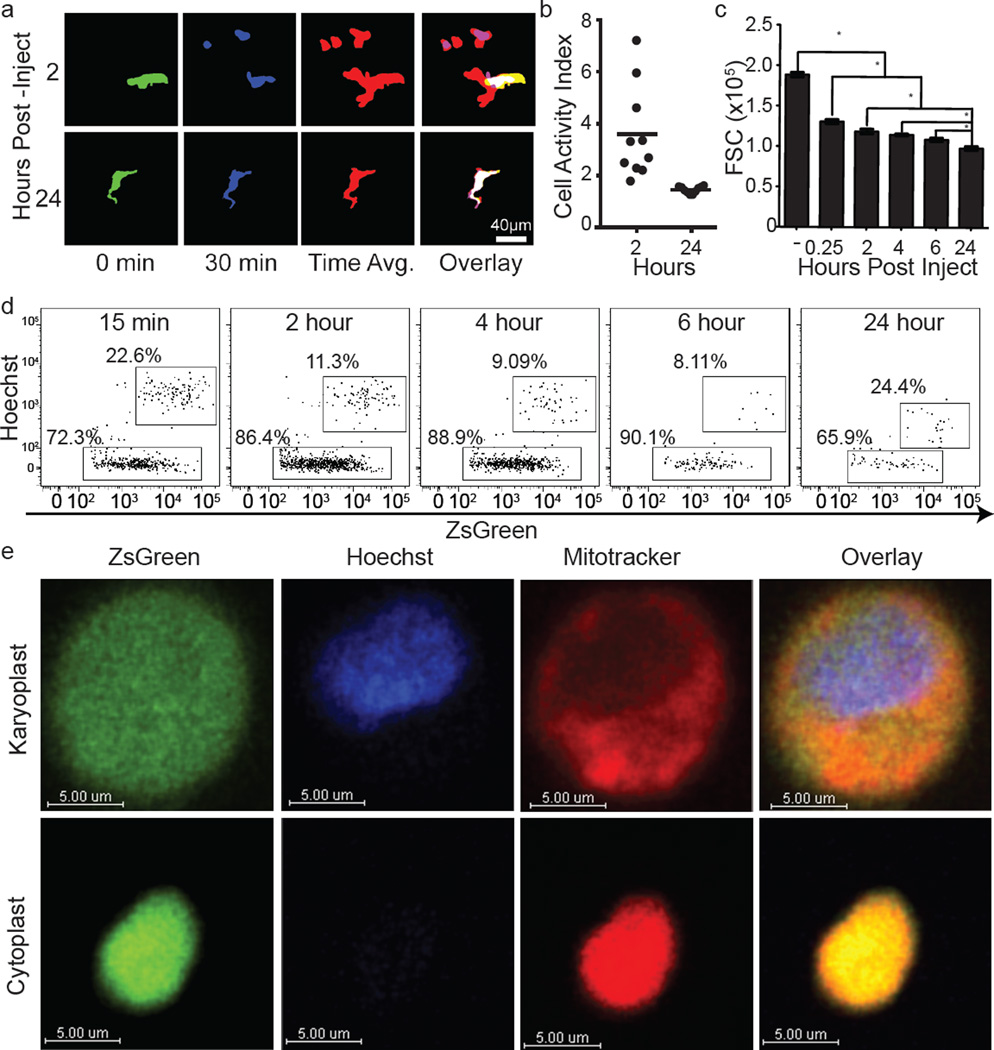
Microparticle generation was observed repeatedly over at least 8 h after injection (Fig. 1e and Supplementary Video 2). These blebs had an average diameter of 5 µm, with a range of 0.5 to >25 µm (Fig. 1f), markedly larger than exosomes and larger than most previously reported microparticles9. Arrested B16ZsGreen cells were also observed to undergo membrane protrusion and retraction (Supplementary Video 2 and Extended Data Fig. 3a). Over time, surviving tumour cells decreased in size and the protrusive activity reduced (Extended Data Fig. 3a–c and Supplementary Video 3). In most instances of microparticle release, the nucleus of the parent cell maintained integrity and the blebs themselves retained the cytoplasmic fluorophore, consistent with non-apoptotic blebbing10. We also observed cells undergoing lysis (Supplementary Video 4), distinguished from apoptosis by a lack of blebbing and rapid loss of the cytoplasmic fluorophore. On the basis of these criteria, we adopted the terminology for parental nucleated cells as ‘karyoplasts’ and the blebs as ‘cytoplasts’.
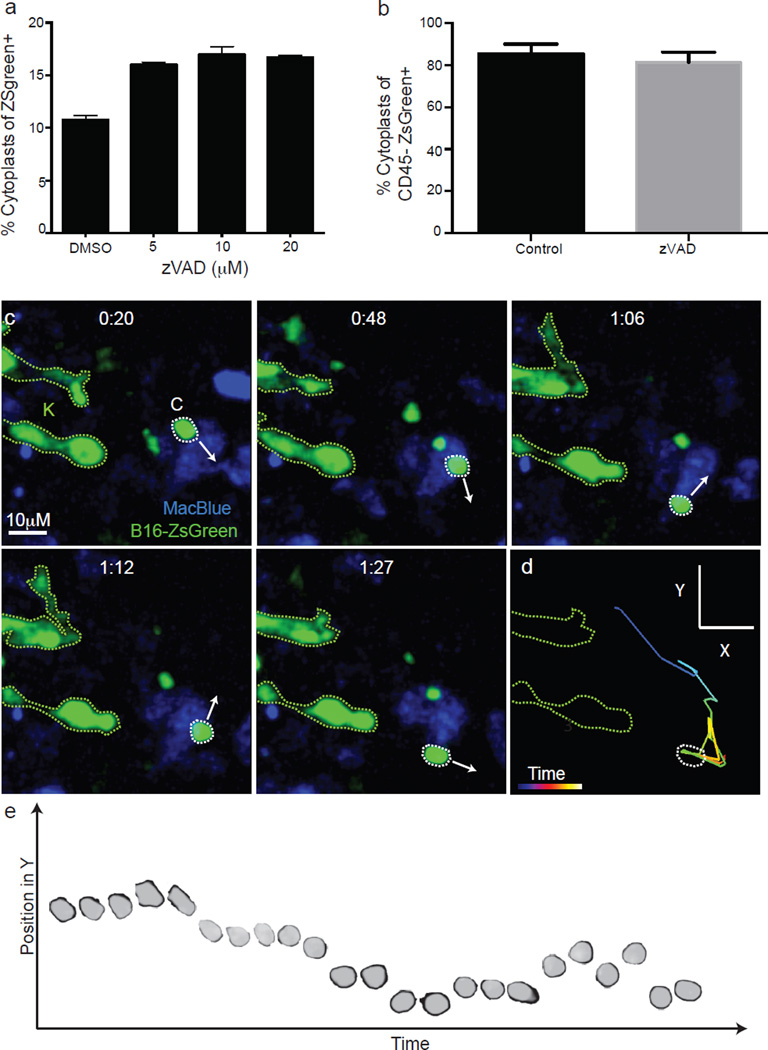
Previous lung explant and slice imaging studies did not reveal the generation of cytoplasts during metastasis11,12; we hypothesized that their formation was dependent on shear forces in intact lungs. We compared the behaviour of tumour cells in LIVM versus slice to test this13. In the non-shear system, the production of cytoplasts was approximately fourfold reduced (Fig. 1g). Further, cytoplast production was unaltered in the presence of the apoptosis inhibitor Z-VAD (Extended Data Fig. 4a, b). This demonstrates that cytoplast formation is driven by physical forces rather than a programmed cell death mechanism. In LIVM, many microparticles also exhibited autonomous motility, with spontaneous arrest and adherence on vascular walls (Supplementary Video 5) and migration against vascular flow (Extended Data Fig. 4c–e and Supplementary Video 6). The speed of these particles was around 10 µm min−1 in the absence of vascular flow, and an order of magnitude faster in LIVM (Fig. 1h).
Having observed the generation process in vivo, we developed a flow cytometric assay to study their formation and fate. Using Hoechst-staining to accurately differentiate karyoplasts from cytoplasts (confirmed by confocal imaging), we found that cytoplasts became the dominant tumour-cell-derived species within the lung within 15 min (Fig. 1i, j and Extended Data Fig. 3d). Cytoplasts contained mitochondria (Fig. 1k, l and Extended Data Fig. 3e), consistent with retention of metabolic potential and motility. The production of these particles was not unique to in vitro passaged B16F10 cells, as robust cytoplast generation was seen with B16ZsGreen cells isolated directly from primary subdermal tumours and re-injected i.v. (Fig. 1m), a mouse breast tumour line (PyMT-B), human MDA-MB231 breast tumour cells, and non-transformed mouse embryonic fibroblasts (Fig. 1n).
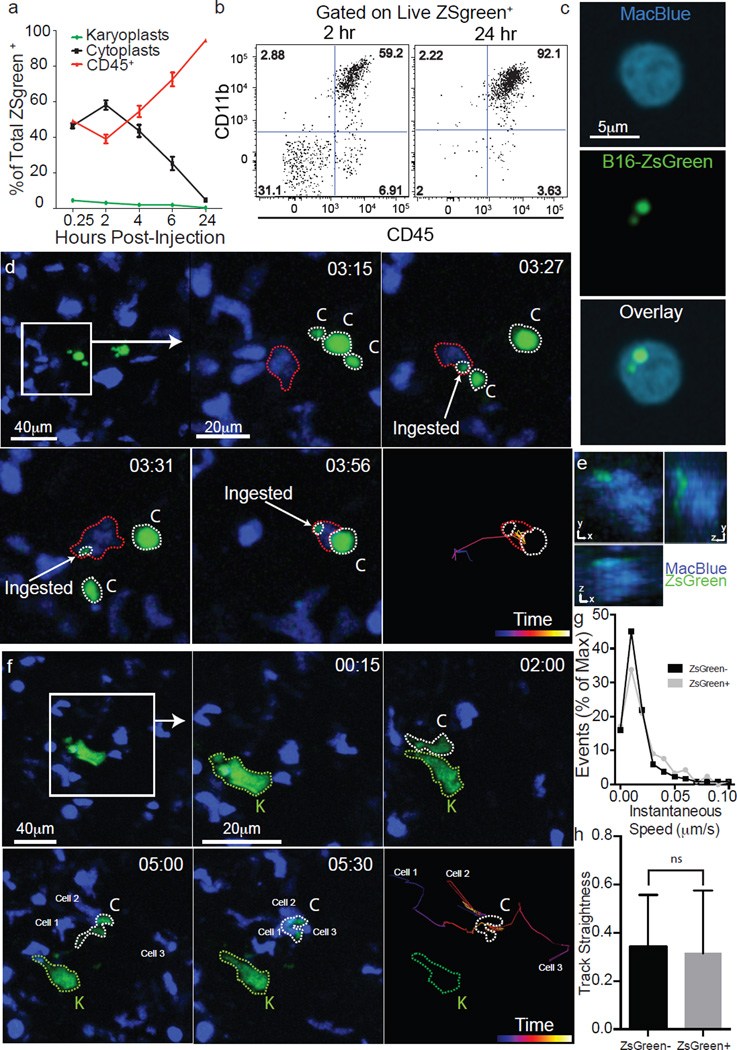
The number of cytoplasts peaked by 4 h with few detectable by 24 h. Meanwhile, karyoplast number declined according to a one-phase exponential decay over the first day with a half-life (_t_1/2) of 6.3 h (Fig. 2a). Comparison of the frequency of immune-associated ZsGreen+ events with that of free cytoplasts and karyoplasts revealed a strong reciprocal relationship between the rise in ZsGreen+ immune cells and loss of free cytoplasts (Fig. 2a). This suggested that cytoplasts represent the source of ingested tumour material in pre-metastatic lungs. Myeloid cells were implicated as the primary phagocytes on the basis of CD11b expression (Fig. 2b). Assessment of the myeloid lineage reporter MacBlue (eCFP, enhanced Cyan Fluorescent Protein, driven by a modified CFMS promoter cassette, labeling monocyte and monocyte-derived cells as well as a small portion of neutrophils)14 further revealed CFP+ZsGreen+ cells containing ingested tumour fragments (≥1um diameter), consistent with cytoplast uptake (Fig. 2c). Importantly, using LIVM, we were able to observe CFP+ cells directly ingesting cytoplasts (Fig. 2d, e and Supplementary Video 7). Additionally, we occasionally observed swarming by CFP+ cells following release of a cytoplast from a parental karyoplast with these cells ignoring the neighbouring viable karyoplast (Fig. 2f and Supplementary Video 8). A bias of phagocytes towards cytoplasts was not universal and CFP+ cells were also frequently found in direct interaction with karyoplasts (Supplementary Video 9), although in hundreds of hours of imaging, we never observed phagocytosis of an intact karyoplast. Evaluation of the behavioural characteristics of cytoplast-ingesting versus non-ingesting myeloid cells revealed no clear differences in either instantaneous speed nor path straightness, although the latter would be heavily dictated by the vasculature (Fig. 2g, h). Taken together, these data support the hypothesis that pioneer CTCs generate cytoplasts within the lung vasculature early on arrival in the lung, leading to loading of local phagocytes.
Figure 2. Encounter and uptake of tumour-derived cytoplasts by lung myeloid cells.
a, Frequencies of cytoplasts, karyoplasts, and CD45+ZsGreen+ cells in the lung over 24 h (n = 6 per group). b, Flow cytometry of CD11b+CD45+ cells in total ZsGreen+ population 2 and 24 h after injection. c, Confocal imaging of CD45+ZsGreen+ cells from MacBlue mice 24 h after injection. d, LIVM of cytoplast phagocytosis by a CFP+ myeloid cell (see also Supplementary Video 7). Green, karyoplasts; white, cytoplasts; red, cytoplast ingesting cell. Rightmost panel shows tracking data for a subset of cells. Representative of 5 mice. e, xy, yz and xz renders of CFP+ from d. f, LIVM of CFP+ cell targeting cytoplast (see also Supplementary Video 8). Colours and tracking as in d. Tracked cells labelled as cell 1, 2 or 3 in f for comparison with tracks. Representative of 5 mice. g, Speed of cytoplast-ingesting and non-ingesting cells. h, Track straightness of cytoplast-ingesting and non-ingesting cells. Data from 75 non-ingesting and 10 ingesting cells from 4 mice, error bars are standard deviation.
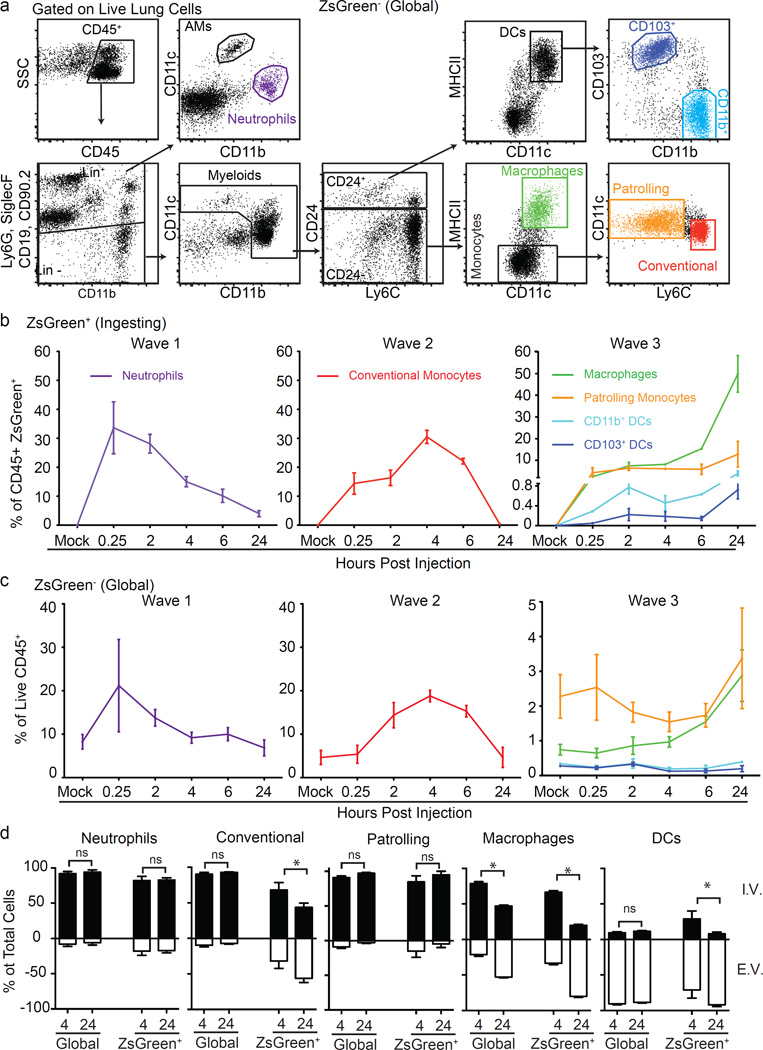
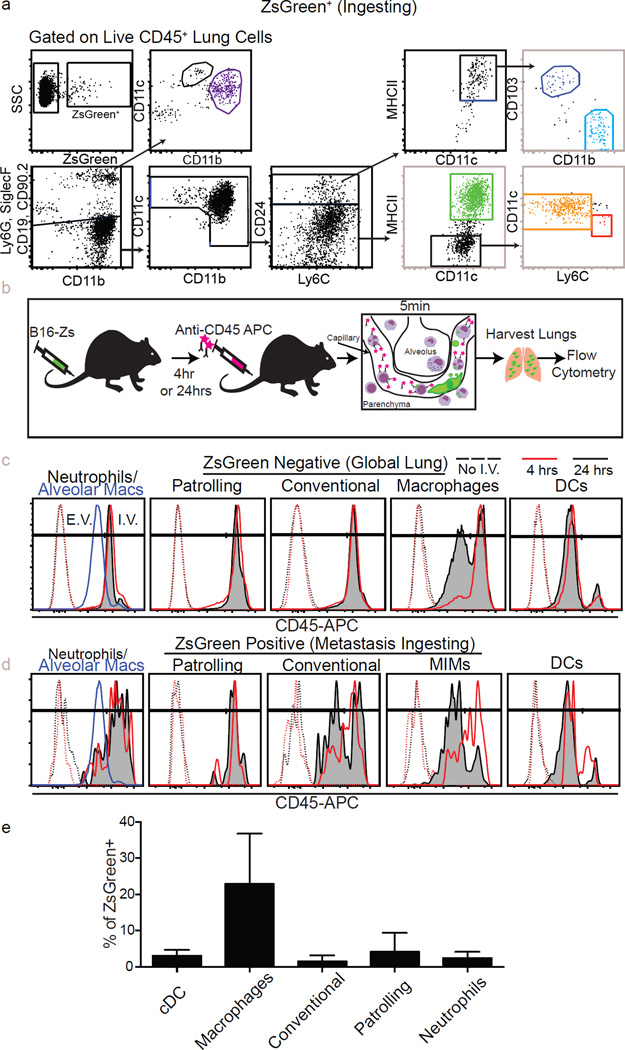
We next characterized the identity of the tumour-ingesting myeloid cells in the early metastatic niche using flow cytometry (Fig. 3a and Extended Data Fig. 5a). Our analysis included specific gating of alveolar macrophages (Siglec-F+, CD11c+, CD11blow), neutrophils (Ly6G+, Ly6C+, CD11b+), conventional monocytes (Ly6C+, CD11b+, MHCII+/−, Ly6G−, CD11c−, CD24−), patrolling monocytes (CD11b+, CD11cmid, Siglec-F−, Ly6G−, MHCII−, CD24−, Ly6Clow/−), non-alveolar macrophages (CD11b+, CD11c+, MHCII+, CD24−, Siglec-F−, Ly6G−) and two populations of lung-resident conventional dendritic cells (cDCs): CD103+ and CD11b+ (CD24+, CD11c+, MHCIIhi, Ly6C−, CD103+ or CD11b+). Both monocyte populations expressed CD115, and macrophages, but not cDCs, expressed CD64 and F4/80, supporting the definitions of these populations (data not shown). Using this strategy, we examined lungs across a 24 h time course, gating on ZsGreen− (Fig. 3a) or ZsGreen+ (Extended Data Fig. 5a) cells to understand the dynamics of total versus cytoplast-loaded myeloid populations. This revealed a progressive wavelike shift in the identity of myeloid cells that contained CTC-derived material (ZsGreen+) (Fig. 3b, c). The first wave was dominated by neutrophil uptake, occurring within 15 min of injection, peaking around 30 min and returning to near-baseline by 24 h. Wave 2 was dominated by loading of conventional monocytes with a peak at 4 h followed by a return to baseline by 24 h. Finally, wave 3 established between 6 and 24 h comprised of non-alveolar macrophages, patrolling monocytes and DCs. Among those, non-alveolar macrophages were the most numerous, representing greater than 60% of total CD45+ZsGreen+ cells at 24 h, followed by patrolling monocytes and both CD103+ DCs and CD11b+ DCs at much lower frequencies (Fig. 3b). These waves were largely mirrored in global (ZsGreen−) populations with the notable exception of the DC populations (Fig. 3c), consistent with uptake frequency being largely a function of cellular frequency.
Figure 3. Discrete waves of cytoplast loaded myeloid cells define the early metastatic niche.
a, Gating strategy for total lung myeloid populations. b, Frequency of tumour-ingesting myeloid cells in the lung over 24 h following i.v. injection with B16ZsGreen (n = 6, error bars are standard deviation). c, Frequency of myeloid cells in total lung cells over 24 h following i.v. injection with B16ZsGreen (n = 6). d, Frequency of intravascular versus extravascular myeloid populations at 4 or 24 h following i.v. injection of B16ZsGreen cells (n = 6 per group; *P < 0.05, two-way ANOVA with multiple comparison between row and column means, error bars are standard deviation).
We next sought to determine how cytoplast-ingesting cells behaved with respect to extravasation. We used i.v. injection of labelled anti-CD45 to localize ZsGreen+ populations relative to the vasculature at 4 and 24 h after injection. Consistent with previous data3, non-alveolar macrophages extravasated over this time period (Fig. 3d and Extended Data Fig. 5b–d). Interestingly, a portion of ZsGreen+ conventional monocytes also extravasated, consistent with recent reports that this population can exit circulation without differentiation into macrophages16. In contrast, tumour-loaded patrolling monocytes and neutrophils remained intravascular throughout. The DC populations that gathered tumour material remained largely extravascular throughout, with the exception of a very small but consistent population of ZsGreen+ DCs, at 4 h, that stained for i.v. CD45, which may reflect intravascular sampling by these DC populations (Fig. 3d).
It is likely that some elements of this wave structure are influenced by the bolus nature of the i.v. injection model in contrast to the more continual release of CTCs expected in spontaneous metastasis. Although it is currently difficult to catch cells arriving from a spontaneous tumour, we hypothesize that these waves would exist as a continuum; indeed, the cytoplast-containing cells in lungs of mice bearing primary tumours were dominated by monocytes and macrophages (Extended Data Fig. 5e). Nonetheless, these data suggest that a dichotomy exists in the behaviour of recruited versus lung-resident myeloid populations during metastasis.
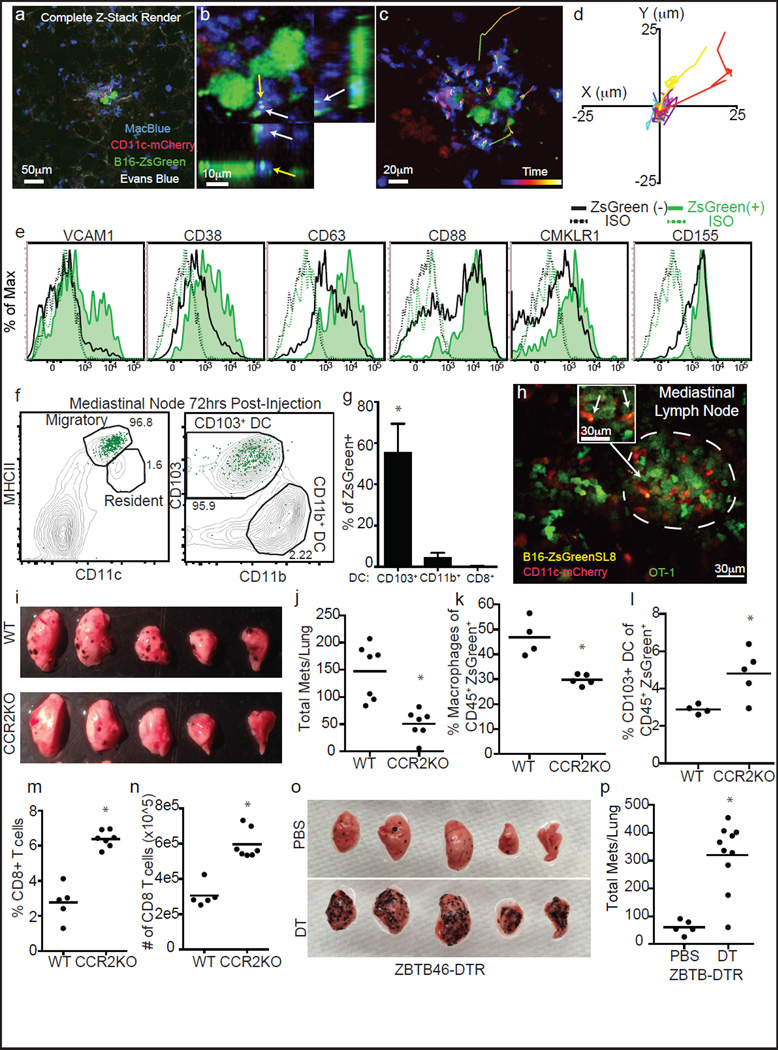
Multicolour imaging at 24 h confirmed previous observations4 that monocyte and monocyte-derived cells (CFP+) and not DCs were dominant in a successful early metastasis (Fig. 4a). Using B16ZsGreen cells, our study extends those observations by showing that these cells contain ingested ZsGreen+ tumour material. This suggests that some originated as cytoplast-ingesting cells (Fig. 4b). Live-imaging of these nascent metastases showed relatively stable and non-motile myeloid cells, although a few underwent directional migration towards micrometastases (Fig. 4c, d). Notably, ZsGreen+ macrophages displayed unique upregulation of a variety of adhesion and chemotactic receptors, relative to ZsGreen− or steady-state macrophages (Fig. 4e). This provides evidence that tumour ingestion and interaction drives these cells down a distinct activation pathway.
Figure 4. Lung-resident dendritic cells inhibit metastasis of B16 melanoma.
a, Maximum intensity projection of LIVM of B16ZsGreen tumour 24 h after injection into CD11c-mCherry, MacBlue host (see also Supplementary Video 9). Representative of 5 mice. b, High magnification showing tumour-loaded MacBlue+ cells in close interaction with B16ZsGreen cell at 24 h after injection. c, Representative image from time-lapse. Track overlays describe motion of tracked MacBlue+ cells over a period of ~1 h. d, Overlay of 10 tracks of MacBlue+ cells from c. e, Staining of ZsGreen+ and ZsGreen− macrophages 24 h after tumour injection (n = 4), ISO represents staining with isotype control antibody. f, Gating of lung-draining mLN 72 h after injection. Contour lines, total LN; green dots, ZsGreen+ cells. g, Frequency of CD8+, CD11b+ and CD103+ DCs in total ZsGreen+ cells in the mLN 72 h after injection. (n = 6; *P < 0.05, one-way ANOVA with Bonferroni post-hoc test, error bars are standard deviation). h, Representative image of ZsGreen+CD11c-mCherry+ APCs interacting with GFP-labelled OT-I T cells in a mLN 72 h after injection with B16ZsGreenSL8 (see also Supplementary Video 10). Inset highlights two ZsGreen-bearing CD11c+ cells in close interaction with OT-I T cells (n = 3 mice). i, Representative images of metastasis-bearing lungs from wild-type (WT) or CCR2-knockout (KO) mice 2 weeks after injection with B16ZsGreen. j, Total number of lung metastases (mets) in wild-type and CCR2-knockout mice 2 weeks after injection with B16ZsGreen (n = 7 per group; *P < 0.05, unpaired _t_-test, horizontal bars are mean values). k, Frequency of ZsGreen+ macrophages in lungs of wild-type and CCR2-knockout mice 24 h after injection with B16ZsGreen (n = 4 per group; *P < 0.05 by unpaired _t_-test, horizontal bars are mean values). l, Frequency of ZsGreen+ CD103+ cDCs in lungs of wild-type and CCR2-knockout mice 24 h after injection with B16ZsGreen (n = 4 per group; *P < 0.05, unpaired _t_-test, horizontal bars are mean values). m, n, Frequency (m) and absolute number (n) of CD8+ T cells in lungs of wild-type or CCR20-knockout mice from k (n = 4 per group; *P < 0.05, unpaired _t_-test, horizontal bars are mean values). o, Representative images of lungs from Zbtb46-DTR bone marrow chimaeras treated with phosphate buffered saline (PBS) or diphtheria toxin (DT). Lungs collected 2 weeks after injection with B16ZsGreen. p, Total number of lung metastases in PBS- or DT-treated Zbtb46-DTR bone marrow chimaeras 2 weeks after injection with B16ZsGreen (n = 5 for PBS and 10 for DT groups, respectively; *P < 0.05, unpaired _t_-test, horizontal bars are mean values).
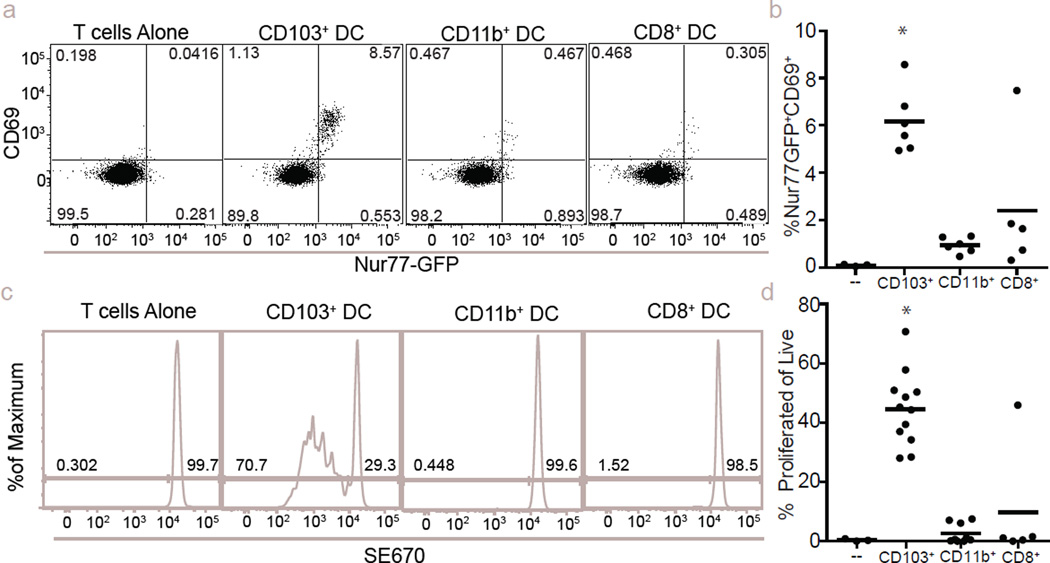
The loaded DC wave at 24 h suggested the potential for an immune-stimulatory fate for some tumour-derived material. Flow-cytometric analysis of antigen-presenting cell (APC) populations in the mediastinal lymph node (mLN) revealed that all ZsGreen+ cells were contained within the migratory CD103+ DC population17 (Fig. 4f–g). We thus imaged live mLN explants from CD11c-mCherry reporter mice (labelling DC and macrophages through expression of mCherry under control of the CD11c promoter), 72 h after injection with B16F10 cells expressing ZsGreen and the ovalbumin peptide SL8 (B16ZsGreenSL8.) We found clusters of mCherry+ APCs with ZsGreen puncta, clustered with transferred ovalbumin-specific CD8+ (OT-I) T cells. The T cells exhibited a blast-like morphology, suggesting in vivo activation of T cells by DCs within the mLN (Fig. 4h and Supplementary Video 10). These data support a model whereby CD103+ DCs acquire tumour material in the lung and subsequently migrate to the mLN to engage with cognate T cells. In vitro, CD103+ DCs (isolated from mLN of metastasis-bearing mice at 72 h) were superior in their ability to activate OT-I T cells (Extended Data Fig. 6a–d). In contrast, neither CD11b+ DCs nor CD8+ DCs were observed to contain ZsGreen and were unable to stimulate OT-I T cells in vitro (Extended Data Fig. 6a–d).
Previous studies have highlighted the importance of the CCR2–CCL2 axis in monocyte recruitment to seed pro-tumour macrophage populations in the lung4. Analysis of CCR2-knockout animals, which recruit significantly fewer monocytes, and consequently macrophages4, at two weeks after injection with B16ZsGreen, confirmed that CCR2-knockout hosts developed significantly fewer metastases (Fig. 4i, j). By characterizing ZsGreen+ cells at 24 h, we observed a shift in cytoplast loading towards the immunostimulatory CD103+ DCs (Fig. 4k, l). Moreover, in CCR2-knockout animals, we found a substantial increase both in the frequency and number of CD8+ T cells in the lung (Fig. 4m, n). We thus considered whether host-protective CD103+ DCs operate in competition with the pro-tumour macrophages.
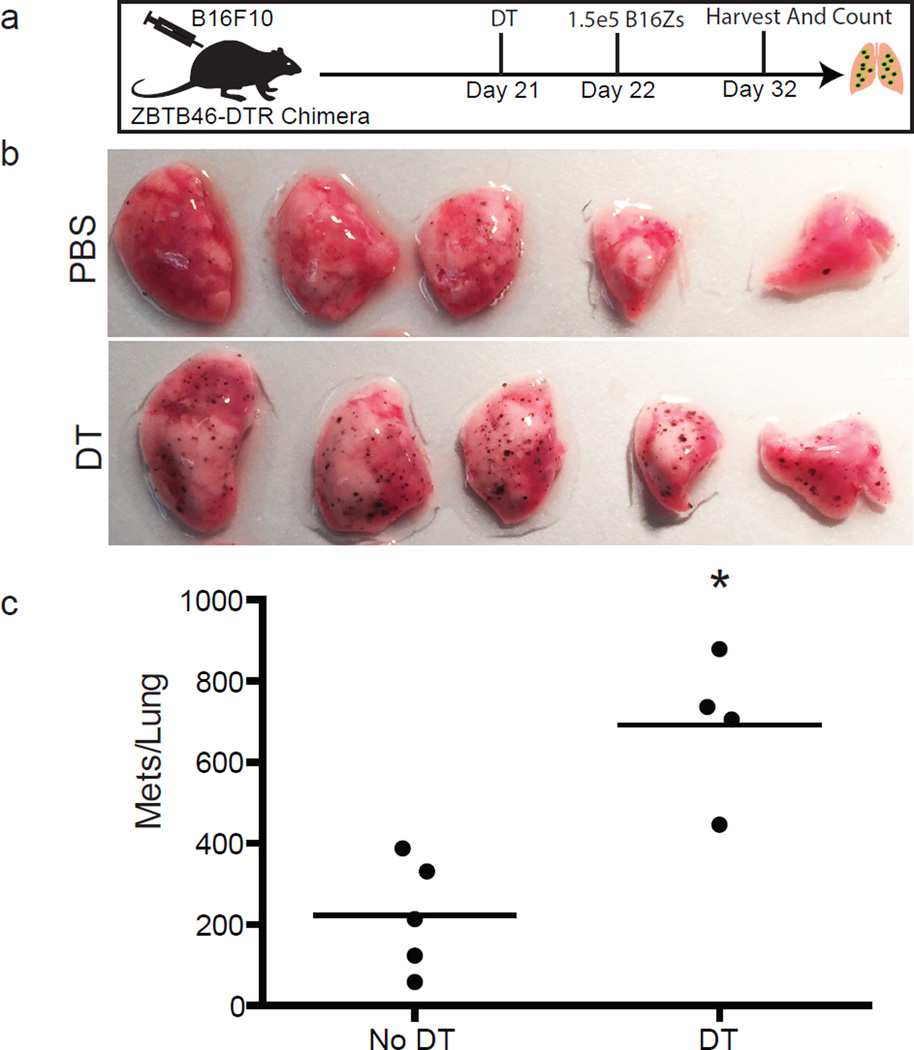
To test the idea that metastatic success is specifically opposed by cDCs, we generated Zbtb46-DTR (expression of diphtheria toxin under control of the cDC-specific Zbtb46 promoter)18 bone marrow chimaeras. This permitted us to specifically and temporally deplete cDCs. We evaluated the metastatic burden in lungs two weeks after injection with B16ZsGreen; cDC-depleted animals developed sixfold more metastases than the non-depleted controls (Fig. 4o, p). We repeated these experiments in the presence of a subdermal primary tumour, mimicking the endogenous state of tumour metastasis with identical results (Extended Data Fig. 7). These data clearly establish that, despite relative rarity in the tumour interacting pool, lung-resident cDCs have a major role in restricting metastasis.
Previous research into how lung immune responses dictate metastatic success has been largely limited to recruited myeloid populations. This is evidenced by a recent review of the literature2 that detailed 28 distinct primary articles focused on the function of recruited immune cells in the lung during metastasis and no references defining a role for resident immune cells. Although our analysis of tumour-interacting myeloid cells strongly supports waves of recruited neutrophils, monocytes and macrophages as populations of interest in the early metastatic niche, it also reveals the presence of rare lung-resident cDC subsets within the early interacting pool that mediate potent antimetastatic effects. A recent study from our lab19 identified a similarly rare CD103+ cDC population acting locally in primary tumours to stimulate CD8+ T cells providing adaptive protection. This suggests that novel immunotherapeutics designed to enhance these DC populations may provide a single strategy to modulate both primary and metastatic responses. This real-time study, like others of its kind, also highlights the value of direct observation as a means to identify how tumours interact with the colonized tissue, in this case by feeding material from the first pioneer cells into specific subsets of local and recruited myeloid populations.
METHODS
Mice
Mice were housed and bred under specific pathogen-free conditions at the University of California, San Francisco Laboratory Animal Research Center and all experiments conformed to ethical principles and guidelines approved by the UCSF Institutional Animal Care and Use Committee. C57/BL6 mice were purchased from Simonsen Laboratories or bred in house, and unless otherwise noted animals used were male between 6–8 weeks of age. Actin–CFP20 mice were obtained from I. Weissman (Stanford University). MacBlue14 mice were a gift from D. Hume (The Roslin Institute). CD11cmCherry21 mice were a gift from L. Lefrancois (University of Connecticut). CCR2-knockout22 mice were a gift from J. Cyster. mTmG23, Nur77-GFP24, and Zbtb46-DTR18 mice were purchased from Jackson Laboratories.
Cell lines
B16F10 (ATCC), PyMT-B25,26 was a gift from J. Massegue and S. Abrams, MDA-MB231-expressing GFP was a gift from Z. Werb, mouse embryonic fibroblasts were prepared from mTmG mice as follows. Day 13.5 embryos were collected from pregnant mTmG females. Following removal of fetal liver embryos, were minced and subjected to Trypsin digestion. The retrieved cells were washed and resuspended in DMEM (GIBCO) and 10% heat-inactivated FCS and l-glutamate with penicillin and streptomycin. Cells were plated and passaged overnight. Media was aspirated after 24 h to remove any cells remaining in suspension and replaced with fresh media. Cells were then grown to 70%–80% confluency and cryopreserved. For experimental use, a vial of mouse embryonic fibroblasts were thawed and grown to 80% confluency in fresh media and used immediately for experiments. ZsGreen- and DsRed-expressing cells lines were generated by retroviral transduction with empty pSiren–ZsGreen (Clontech) or pSiren–DsRED(Clontech). Retrovirus was generated in Phoenix packaging cells (as previously described27) and applied to sub-confluent B16F10 or PyMT-B cells. Transduced cells were sorted for fluorescent-protein-positive cells on day 2 after infection on a FACSAria III sorter. Following an additional week of culture, cells were sorted a second time to ensure faithful expression of the reporter. Cell lines were subsequently tested and confirmed to be mycoplasma free by PCR.
Metastasis induction
For intravital imaging, flow cytometry and T cell activation assay sorting experiments, cultured B16ZsGreen cells were collected with Trypsin/EDTA and cultured for 30 min at 37 °C in complete media with or without Hoechst-3342 (Molecular Probes) at 1 µg ml−1 to stain for nuclei and/or recover cells after collection. Cells were subsequently washed ×2 in PBS and 5 × 10⁵ cells were injected via Tail Vein into mice. For metastasis quantification experiments between 1 × 10⁵ and 2.5 × 10⁵ B16ZsGreen cells, prepared in the same fashion, were injected via tail vein.
Intravital imaging of pulmonary metastasis via intercostal insertion window
This is a modified version of our previously published method of stabilized lung imaging6, modifications are as follows. Mice were anaesthetized with 2.5% Avertin at a dose of 10 µl g−1 and secured with tape to a custom heated microscope stage. Tracheostomy was performed to insert a small tracheal cannula, which was sutured into place and attached to a MiniVent mouse ventilator (Harvard Apparatus). Mice were ventilated with a stroke volume of 10 µl of compressed air (20–22% O2) per gram of mouse weight, a respiratory rate of 130–140 breaths per minute, and a positive-end expiratory pressure of 2.5–3 cm H2O. Isoflurane was continuously delivered at 1.5% to maintain anaesthesia and mice were given i.v. Lactated Ringers Solution (Baxter Health Care) at a rate of 0.8–1.6 µl min−1 continuously during imaging. The mice were then placed in the right lateral decubitus position and a small surgical incision was made to expose the rib cage. A second incision was then made into the intercostal space between ribs 4 and 5, through the parietal pleura, to expose the surface of the left lung lobe. A flanged thoracic suction window with 8 mm coverslip (Extended Data Fig. 2) was then inserted between the two ribs and secured to the stage using a set of two optical posts and a 90° angle post clamp (Thor Labs). 20–25 mm Hg of suction was applied (Amvex Corporation) to gently immobilize the lung. The two-photon microscope objective was then lowered into place over the thoracic suction window. For imaging of the arrival of metastatic tumour cells, 5 × 10⁵ B16F10 cells expressing ZsGreen were injected inline through the i.v. line during imaging. In experiments where metastatic cells were imaged at later time points (6–24 h), cells were instead injected i.v. through a tail vein injection at the appropriate time point before performing the intravital imaging surgery.
Two-photon microscopy
Intravital imaging was performed using a custom-built two-photon setup equipped with two infrared lasers (MaiTai, Spectra Physics; Chameleon, Coherent). The MaiTai laser was tuned to 810 nm for excitation of CFP. Chameleon laser excitation was tuned to 980 nm for simultaneous excitation of TdTomato or mCherry and ZsGreen and/or GFP. Emitted light was detected using a 25× 1.2NA water lens (Zeiss) coupled to a 6-colour detector array (custom; using Hamamatsu H9433MOD detectors). Emission filters used were: blue 475/23, green 510/42, yellow 542/27, red 607/70, far red 675/67. The microscope was controlled by the MicroManager software suite, _z_-stack images were acquired with fourfold averaging and _z_-depths of 3 µm Data analysis was performed using the Imaris software suite (Bitplane).
Non-shear lung slice imaging
Slice imaging was performed as previously described13. In brief, mice were injected with 5 × 10⁵ B16ZsGreen cells by tail vein. After 1 h mice were euthanized by anaesthetic overdose (1 ml of 2.5% Avertin), mice were then intubated by tracheotomy with the sheath from an 18-gauge i.v. catheter. Lungs were subsequently inflated with 1 ml of 2% low melting temp agarose (BMA) in sterile PBS at 37 °C. Agarose was then solidified by flooding the chest cavity with 4 °C PBS. Inflated lungs were excised and the left lobe was cut into ~300-µm sections using a vibratome. Sections were mounted on plastic coverslips and imaged by two-photon microscopy at 37 °C in carbogen (5% CO2:95% O2)-perfused RPMI-1640 media (Gibco, without Phenol Red).
Lymphnode explant imaging
Explant imaging was performed as previously described28. In brief, 2 million GFP-expressing OT-I T cells were transferred in CD11c-mCherry mice 1 day before injection with 5 × 10⁵ B16ZsGreenSL8 cells via tail vein. Mediastinal lymph node was removed, cleaned of fat, and immobilized on a plastic coverslip with the hilum facing away from the objective. Lymph nodes were imaged in 30-min intervals with 810 nm excitation on a two-photon microscope, as above.
Tissue digests for flow cytometry and sorting
Lungs were collected from mice following euthanasia by overdose with 2.5% Avertin. Lungs were placed in 5 ml of DMEM (GIBCO) with 0.26 U ml−1 LiberaseTM (Roche) and 0.25 mg ml−1 DNaseI (Roche). Samples were placed in C-Tubes (Miltenyi) and briefly processed with a GentleMACS Dissociator (Miltenyi). Samples were then incubated at 37 °C for 30 min and processed a second time via GentleMACS. Tissue homogenate was then passed through a 100 µm Nytex Filter. Red blood cells were lysed with 3 ml of 175 mM NH4Cl per lung for 5 min at 37 °C. Samples were then filtered through a 40 µm Nytex filter and resuspended for subsequent FACS staining. For experiments where vascular localization was assessed, mice were injected with i.v. 10 µg CD45–APC (allophycocyanin; eBioscience Clone 30-F11) 5 min before collection and prepared as per the previously published protocol15. Lymph nodes were prepared by placing in 1 ml of digestion buffer and puncturing with sharp forceps. Samples were incubated for 15 min at 37 °C and then pipetted up and down ~20 times with a P1000 pipette to dissociate. Samples were returned to 37 °C for 15 min. Cell suspension was then filtered through a 40 µm Nytex filter and prepared for subsequent FACS staining.
Flow cytometry
For surface staining, cells were incubated with anti-Fc receptor antibody (clone 2.4G2) and stained with antibodies in PBS and 2% fetal calf serum for 30 min on ice. Viability was assessed by staining with fixable Live/Dead Zombie NIR (Biolegend) or 4′,6-diamidino-2-phenylindole (Molecular Probes). All flow cytometry was performed on a BD Fortessa flow cytometer. Analysis of flow cytometry data was performed using Flowjo (Treestar). Cell sorting was performed using a BD FACS Aria II or a BD FACS Aria III.
Antibody clones used in these studies: CD45-Alexa 700 (eBioscience clone 30-F11), MHCII Brilliant Violet 421 (Biolegend clone M5/114.15.2), CD11c Brilliant Violet 510 (Biolegend clone N418), CD11b Brilliant Violet 605 or PerCPCy5.5 (Biolegend clone M1/70), Ly6C Brilliant Violet 711 (Biolegend clone HK1.4), CD24 PeCy7 (Biolegend clone M1/69), CD103 PE (Biolegend clone 2E7), CD69 PeCy7 (H1.2F3) Ly6G A647 (Biolegend 1A8), Siglec-F A647 (BD Bioscience clone E50-2440), CD19 A647 (Biolegend clone 6D5), CD90.2 A647 (Biolegend clone 30.H12), VCAM-1 PE (Biolegend clone 429), CD88 PE (Biolegend clone 20/70), CD155 PE (Biolegend clone 4.24.1), CMKLR1 PE (Biolegend clone BZ194), CD38 PE (Biolegend clone 14.27), CD63 PE (Biolegend clone NVG-2) was performed in FACS buffer for 20 min at 4 °C. Live/Dead discrimination was performed using either Propidium Iodide or Zombie NIR Fixable Live/Dead Stain (Biolegend). Samples were analysed on a LSRFortessa (BD Biosciences) in the UCSF Flow Cytometry Core.
T-cell activation assay
Assays were performed as previously published19. In brief, lymph node cells from OT-I TCR transgenic mice were isolated and were enriched for naive CD8+ T cells by StemSep CD8 enrichment (Stemcell Technologies). Naive OT-I CD8 cells or labelled with 2 µM succinimidyl ester eFluor 670 (SE670, eBioscience) and mixed with APC at a 10:1 ratio (1,0000 T cells: 1,000 APC) with unpulsed mLN antigen-presenting cells (sorted from the lymph node 72 h following injection with either B16ZsGreenSL8 or B78mCherryOVA) in 96-well V-bottom plates for either 24 or 72 h at 37 °C in 5% CO2, at which point activation was measured by CD69 and Nur77-GFP upregulation and SE670 dilution using flow cytometry.
Zbtb46-DTR bone marrow chimaeras
In order to avoid mortality associated with diphtheria-toxin-mediated depletion of Zbtb46-DTR expressing cells in intact animals18, we generated bone marrow chimaeras. Bone marrow cells (3 × 10⁶) from Zbtb46-DTR mice were adoptively transferred retro-orbitally into lethally irradiated recipients. Animals were allowed to recover and repopulate the haematopoietic compartment for 8 weeks. On day 1, animals were injected with 20 ng of diphtheria toxin in PBS or an equivalent volume of PBS alone. On day 0, animals were injected with 150,000 B16ZsGreen cells via tail vein injection. On day +1, animals were injected with a second dose of 20 ng of diphtheria toxin or PBS. Metastases were then allowed to develop for 2 weeks before quantification, as described elsewhere in these methods. In alternate experiments, mice were first injected with 1 × 10⁵ B16F10 cells in growth factor reduced Matrigel (Corning, 50 µl of 50% Matrigel diluted in PBS) 3 weeks before diphtheria toxin and metastasis injection injection as per the above protocol. Primary tumours were not allowed to exceed 2 cm before euthanasia in accordance with University of California, San Francisco Institutional Animal Care and Use Committee protocol, as such in these experiments metastases were collected at 1 week to fit within bounds of primary tumour endpoint criteria.
Assessment of cell activity
Data for tumour cells of interest collected from intravital imaging of lung was used for these analyses. Tumour cells were assessed for a 30 min interval at either 2 h or 24 h after injection. Data were first subjected to a maximum intensity projection and output data was binarized at each time point to reveal the maximum boundaries of the cell at any given time point. Data was then projected over time to yield an image depicting the total area occupied by the cell over the 30 min window. Areas were then calculated for the total area of the time projection, as well as the common area colocalized between the initial time point (T0), the final time point (T30) and the time projection (T-Project) to yield the parameter T-Overlap. The cell activity index was then calculated as Cell Activity Index = T-Project/T-Overlap.
Image and statistical analysis
All image analysis was performed using Imaris (Bitplane) in conjuction with Matlab (Mathworks). For statistical analysis, unless otherwise noted, all data were expressed as mean ± s.d. Comparisons between groups were analysed with by _t_-test, multi-group comparisons were performed using a one-way ANOVA test and Bonferroni post-hoc test, using Graphpad Prism software. In all cases where statistical significance is provided, variance was not statistically different between groups with the exception of Fig. 1h. Sample sizes were chosen on the basis of previous experience in the lab with respect to inherent variability in i.v. metastatic models and intravital imaging. Animals within each cohort were randomly assigned to treatment groups. In cases where wild-type mice (Simonsen) were used, entire cages were randomly assigned into treatment groups. Blinded analysis was not performed in these studies. Data were considered as statistically significant when P values were <0.05, indicated by ‘*’ in figures, unless otherwise noted. _t_1/2 value was calculated as the half-life (ln(2)/(K); where K is the rate constant of the regression) of a one-phase exponential decay nonlinear regression.
Extended Data
Extended Data Figure 1. Loading of lung immune cells by prospective metastatic B16 melanoma.
a, Schema for assessing immune cell loading by i.v.-injected B16ZsGreen cells. b, Representative plots of ZsGreen+ populations in the lungs of mice injected with B16ZsGreen over the first 24 h following injection. Data are gated on the basis of expression of the immune cell marker CD45. c, Quantification of b with n = 6 per group, error bars are standard deviation. d, Confocal imaging of CD45+ZsGreen+ cells sorted from a lung digest from a ubiquitous membrane-bound TdTomato fluorescent mouse 24 h after i.v. injection with B16ZsGreen.
Extended Data Figure 2. Intercostal insertion window for lung intravital microscopy.
a, Top, side, and bottom views of the intercostal insertion window. The window accommodates an 8 mm coverslip and allows for visualization of a 4 mm field of the left lung lobe. b–e, Images detailing surgical insertion of the intercostal window. b, Mouse is intubated, attached to ventilator, and placed in right lateral decubitis position and surgical field is shaved. c, An ~6 mm incision is made immediately above ribs 4 and 5 over the anterior surface of left lung lobe. d, The intercostal window is slipped between ribs 4 and 5, and attached to a rigid support. e, Around 20 mm Hg of vacuum suction is applied to the window to secure a small portion of lung to the coverglass. f, Schema showing approach for two-photon intravital microscopy of lung seeding by B16ZsGreen cells.
Extended Data Figure 3. Assessment of tumour cell activity and cytoplast characterization.
a, Binarized maximum intensity projections of representative cells at 2 or 24 h after injection. Cells were time-projected over a 30 min window to assess overall cellular activity during the interval. Images show the beginning time point (0 min), the ending time point (30 min), the time projection, and the overlay. White-filled space in the overlay represents the region of the cell that was stable during the analysed interval. These data are associated with Supplementary Video 3. These data are representative from imaging performed in 3 mice. b, Quantification of the cell activity index (defined as the area calculated from the projection of all positions over time as a ratio of the common area over all time (for example, area of overlap)) from analysis in d (n = 10 cells per group, horizontal bars are mean value). c, Flow cytometric quantification of FSC for tumour cells isolated from lung via digestion at 15 min, 2 h, 4 h, 6 h, and 24 h after injection. *P < 0.05, one-way ANOVA with Bonferroni post-hoc test, error bars are standard deviation. d, Representative data from flow cytometric discrimination of nucleated karyoplasts and anucleate cytoplasts derived from B16ZsGreen tumour cells in the lung in vivo over a 24 h time course, full data set quantified in Fig. 1e. e, confocal analysis of Hoechst and Mitotracker-labelled B16ZsGreen karyoplasts and cytoplasts sorted from in vitro culture of B16ZsGreen cells.
Extended Data Figure 4. Autonomous motility of cytoplasts in vivo.
a. Flow cytometric quantification of cytoplasts in vitro following 24 h treatment with Z-VAD at indicated concentrations. b. Flow cytometric quantification of cytoplasts in vivo from lung digests of mice treated with 10 µg Z-VAD i.v at the time of injection with 2.5 × 10⁵ B15ZsGreen cells (a and b n = 4 per group; no significant difference detected between groups, unpaired _t_-test, error bars are standard deviation). c, Image series for B16ZsGreen cytoplast migrating autonomously through the lung microvasculature of a MacBlue host. Arrows represent the direction of the trajectory of the cytoplast at indicated time point. These data are associated with Supplementary Video 6. These data are representative of imaging collected from at least 12 mice. d, Representative tracking of a cytoplast from Supplementary Video 6 (and Extended Data Fig. 4c). e, A superposition image of 23 consecutive time points of a cytoplast migrating through lung microvasculature. Image shows the change in position in the Y-axis of direction as defined in d at each subsequent timepoint as the cytoplast migrates up and down the vessel.
Extended Data Figure 5. Characterization of tumour-interacting myeloid cell waves.
a, Representative gating for total lung myeloid populations. b, Schema detailing method for discrimination of intravascular versus extravascular localization of lung myeloid populations. c, d, Representative histograms of intravascular CD45 staining used to discriminate between intravascular and extravascular localization of lung myeloid cells at 4 and 24 h after injection with B16ZsGreen. Data quantified in Fig. 3d. In the leftmost panels, alveolar macrophages at 24 h after tumour injection are shown as a known control for extravascular staining. c, Total lung myeloids. d, ZsGreen+ myeloid cells. e, Quantification ZsGreen+ myeloid populations by flow cytometry in lungs of mice bearing 2-week subdermal B16ZsGreen tumours, _n_=4 per group, error bars are standard deviation.
Extended Data Figure 6. Stimulatory capacity of CD103+ DCs in lung-draining lymph node.
a, CD69 vs Nur77-GFP expression 24 h after culture from ex vivo coculture of OT-I TCR transgenic CD8+ T cells with sorted APCs from mLNs, where the latter were isolated 72 h post-injection with B16ZsGreenSL8. b, Quantification of a. c, Dilution of SE670 as an index of proliferation 72 h after culture with indicated APC populations. d, Quantification of c. n = 6 (b) or 6–12 (d) per group from 2 experiments; *P < 0.05, one-way ANOVA with Bonferroni post-hoc test, horizontal bars are mean value.
Extended Data Figure 7. cDCs confer anti-metastatic activity in the presence of a primary tumour.
a, Experimental schema for evaluation of role of cDCs in lung metastasis in the presence of a primary tumour. b, Representative images of lungs from Zbtb46-DTR bone marrow chimaeras treated with PBS or DT after implantation of a primary subdermal tumour (1 × 10⁵ B16F10 in matrigel) and i.v. metastases (1.5 × 10⁵ B16ZsGreen). Metastases were assessed one week after i.v. injection. c, Quantification of total number of visible ZsGreen+ lung metastases in PBS- or DT-treated Zbtb46-DTR bone marrow chimaeras. n = 4–5 per group, representative of 2 experiments; *P < 0.05, unpaired _t_-test, horizontal bars are mean value.
Supplementary Material
Supplementary Video S1
Supplementary Video S2
Supplementary Video S3
Supplementary Video S4
Supplementary Video S5
Supplementary Video S6
Supplementary Video S7
Supplementary Video S8
Supplementary Video S9
Supplementary Video S10
Acknowledgments
We thank D. Hume for providing MacBlue mice; Z. Werb for providing MDAMB231 GFP cells; J. Massegue and S. Abrams for providing PyMT-B cells; J. Cyster for providing us with CCR2-knockout mice. We would also like to thank E. Thornton for her initial work in developing lung intravital imaging. M. Werner for early technical assistance in this project. All members of the Krummel Lab, BIDC, and M Koch for discussion, support, and guidance while developing this work. This work was supported in part by a Department of Defense post-doctoral fellowship to M.B.H. (W81XWH-13-1-0009) and NIH grants U54 CA163123, P01 HL024136 and R21CA167601
Footnotes
Supplementary Information is available in the online version of the paper.
Author Contributions M.B.H. designed and conducted most of the experiments, data analysis, and drafted the manuscript; A.B. developed the Intercostal Imaging Window; A.N. generated B16ZsGreen cell line and discussed data; E.W.R. generated mTmG mouse embryonic fibroblasts and provided editorial support on manuscript; M.L.R. participated in development and troubleshooting of LIVM method, discussed data and project direction; A.G. participated in intravital LN experiments and provided editorial support on manuscript. M.F.K. designed experiments, interpreted data, and with other authors, developed the completed manuscript.
The authors declare no competing financial interests.
References
- 1.Nguyen DX, Bos PD, Massague J. Metastasis: from dissemination to organ-specific colonization. Nature Rev. Cancer. 2009;9:274–284. doi: 10.1038/nrc2622. [DOI] [PubMed] [Google Scholar]
- 2.Kitamura T, Qian BZ, Pollard JW. Immune cell promotion of metastasis. Nature Rev. Immunol. 2015;15:73–86. doi: 10.1038/nri3789. [DOI] [PMC free article] [PubMed] [Google Scholar]
- 3.Qian B, et al. A distinct macrophage population mediates metastatic breast cancer cell extravasation, establishment and growth. PLoS ONE. 2009;4:e6562. doi: 10.1371/journal.pone.0006562. [DOI] [PMC free article] [PubMed] [Google Scholar]
- 4.Qian BZ, et al. CCL2 recruits inflammatory monocytes to facilitate breast-tumour metastasis. Nature. 2011;475:222–225. doi: 10.1038/nature10138. [DOI] [PMC free article] [PubMed] [Google Scholar]
- 5.Kaplan RN, et al. VEGFR1-positive haematopoietic bone marrow progenitors initiate the pre-metastatic niche. Nature. 2005;438:820–827. doi: 10.1038/nature04186. [DOI] [PMC free article] [PubMed] [Google Scholar]
- 6.Looney MR, et al. Stabilized imaging of immune surveillance in the mouse lung. Nature Methods. 2011;8:91–96. doi: 10.1038/nmeth.1543. [DOI] [PMC free article] [PubMed] [Google Scholar]
- 7.Peinado H, et al. Melanoma exosomes educate bone marrow progenitor cells toward a pro-metastatic phenotype through MET. Nature Med. 2012;18:883–891. doi: 10.1038/nm.2753. [DOI] [PMC free article] [PubMed] [Google Scholar]
- 8.Joyce JA, Pollard JW. Microenvironmental regulation of metastasis. Nature Rev. Cancer. 2009;9:239–252. doi: 10.1038/nrc2618. [DOI] [PMC free article] [PubMed] [Google Scholar]
- 9.Raposo G, Stoorvogel W. Extracellular vesicles: exosomes, microvesicles, and friends. J. Cell Biol. 2013;200:373–383. doi: 10.1083/jcb.201211138. [DOI] [PMC free article] [PubMed] [Google Scholar]
- 10.Di Vizio D, et al. Oncosome formation in prostate cancer: association with a region of frequent chromosomal deletion in metastatic disease. Cancer Res. 2009;69:5601–5609. doi: 10.1158/0008-5472.CAN-08-3860. [DOI] [PMC free article] [PubMed] [Google Scholar]
- 11.Mendoza A, et al. Modeling metastasis biology and therapy in real time in the mouse lung. J. Clin. Invest. 2010;120:2979–2988. doi: 10.1172/JCI40252. [DOI] [PMC free article] [PubMed] [Google Scholar]
- 12.Al-Mehdi AB, et al. Intravascular origin of metastasis from the proliferation of endothelium-attached tumor cells: a new model for metastasis. Nature Med. 2000;6:100–102. doi: 10.1038/71429. [DOI] [PubMed] [Google Scholar]
- 13.Thornton EE, et al. Spatiotemporally separated antigen uptake by alveolar dendritic cells and airway presentation to T cells in the lung. J. Exp. Med. 2012;209:1183–1199. doi: 10.1084/jem.20112667. [DOI] [PMC free article] [PubMed] [Google Scholar]
- 14.Ovchinnikov DA, et al. Expression of Gal4-dependent transgenes in cells of the mononuclear phagocyte system labeled with enhanced cyan fluorescent protein using Csf1r-Gal4VP16/UAS-ECFP double-transgenic mice. J. Leukoc. Biol. 2008;83:430–433. doi: 10.1189/jlb.0807585. [DOI] [PubMed] [Google Scholar]
- 15.Anderson KG, et al. Intravascular staining for discrimination of vascular and tissue leukocytes. Nature Protocols. 2014;9:209–222. doi: 10.1038/nprot.2014.005. [DOI] [PMC free article] [PubMed] [Google Scholar]
- 16.Jakubzick C, et al. Minimal differentiation of classical monocytes as they survey steady-state tissues and transport antigen to lymph nodes. Immunity. 2013;39:599–610. doi: 10.1016/j.immuni.2013.08.007. [DOI] [PMC free article] [PubMed] [Google Scholar]
- 17.Idoyaga J, et al. Specialized role of migratory dendritic cells in peripheral tolerance induction. J. Clin. Invest. 2013;123:844–854. doi: 10.1172/JCI65260. [DOI] [PMC free article] [PubMed] [Google Scholar]
- 18.Meredith MM, et al. Expression of the zinc finger transcription factor zDC (Zbtb46, Btbd4) defines the classical dendritic cell lineage. J. Exp. Med. 2012;209:1153–1165. doi: 10.1084/jem.20112675. [DOI] [PMC free article] [PubMed] [Google Scholar]
- 19.Broz ML, et al. Dissecting the tumor myeloid compartment reveals rare activating antigen-presenting cells critical for T cell immunity. Cancer Cell. 2014;26:638–652. doi: 10.1016/j.ccell.2014.09.007. [DOI] [PMC free article] [PubMed] [Google Scholar]
- 20.Hadjantonakis AK, Macmaster S, Nagy A. Embryonic stem cells and mice expressing different GFP variants for multiple non-invasive reporter usage within a single animal. BMC Biotechnol. 2002;2:11. doi: 10.1186/1472-6750-2-11. [DOI] [PMC free article] [PubMed] [Google Scholar]
- 21.Khanna KM, et al. T cell and APC dynamics in situ control the outcome of vaccination. J. Immunol. 2010;185:239–252. doi: 10.4049/jimmunol.0901047. [DOI] [PMC free article] [PubMed] [Google Scholar]
- 22.Boring L, et al. Impaired monocyte migration and reduced type 1 (Th1) cytokine responses in C–C chemokine receptor 2 knockout mice. J. Clin. Invest. 1997;100:2552–2561. doi: 10.1172/JCI119798. [DOI] [PMC free article] [PubMed] [Google Scholar]
- 23.Muzumdar MD, Tasic B, Miyamichi K, Li L, Luo L. A global double-fluorescent Cre reporter mouse. Genesis. 2007;45:593–605. doi: 10.1002/dvg.20335. [DOI] [PubMed] [Google Scholar]
- 24.Moran AE, et al. T cell receptor signal strength in Treg and iNKT cell development demonstrated by a novel fluorescent reporter mouse. J. Exp. Med. 2011;208:1279–1289. doi: 10.1084/jem.20110308. [DOI] [PMC free article] [PubMed] [Google Scholar]
- 25.Stewart TJ, Abrams SI. Altered immune function during long-term host-tumor interactions can be modulated to retard autochthonous neoplastic growth. J. Immunol. 2007;179:2851–2859. doi: 10.4049/jimmunol.179.5.2851. [DOI] [PubMed] [Google Scholar]
- 26.Acharyya S, et al. A CXCL1 paracrine network links cancer chemoresistance and metastasis. Cell. 2012;150:165–178. doi: 10.1016/j.cell.2012.04.042. [DOI] [PMC free article] [PubMed] [Google Scholar]
- 27.Friedman RS, Jacobelli J, Krummel MF. Surface-bound chemokines capture and prime T cells for synapse formation. Nature Immunol. 2006;7:1101–1108. doi: 10.1038/ni1384. [DOI] [PubMed] [Google Scholar]
- 28.Gérard A, et al. Secondary T cell–T cell synaptic interactions drive the differentiation of protective CD8+ T cells. Nature Immunol. 2013;14:356–363. doi: 10.1038/ni.2547. [DOI] [PMC free article] [PubMed] [Google Scholar]
Associated Data
This section collects any data citations, data availability statements, or supplementary materials included in this article.
Supplementary Materials
Supplementary Video S1
Supplementary Video S2
Supplementary Video S3
Supplementary Video S4
Supplementary Video S5
Supplementary Video S6
Supplementary Video S7
Supplementary Video S8
Supplementary Video S9
Supplementary Video S10
