Magnetic Resonance Elastography for Staging Liver Fibrosis in Non-alcoholic Fatty Liver Disease: A Diagnostic Accuracy Systematic Review and Individual Participant Data Pooled Analysis (original) (raw)
. Author manuscript; available in PMC: 2016 Oct 5.
Published in final edited form as: Eur Radiol. 2015 Aug 28;26(5):1431–1440. doi: 10.1007/s00330-015-3949-z
Abstract
Objectives
We conducted an individual participant data (IPD) pooled analysis on the diagnostic accuracy of magnetic resonance elastography (MRE) to detect fibrosis stage in patients with NAFLD.
Methods
Through a systematic literature search, we identified studies of MRE (at 60–62.5Hz) for staging fibrosis in patients with NAFLD, using liver biopsy as gold standard and contacted study authors for IPD. Through pooled analysis, we calculated the cluster-adjusted AUROC, sensitivity and specificity of MRE for any (≥stage 1), significant (≥stage 2) and advanced fibrosis (≥stage 3) and cirrhosis (stage 4).
Results
We included 9 studies reporting on 232 patients with NAFLD (mean age, 51±13y; 37.5% males; mean BMI, 33.5±6.7 kg/m2; interval between MRE and biopsy <1 year, 98.3%). Fibrosis stage distribution (stage 0/1/2/3/4) was 33.6%, 32.3%, 10.8%, 12.9% and 10.4%, respectively. Mean AUROC (and 95% confidence intervals) for diagnosis of any (≥stage 1), significant (≥stage 2) or advanced fibrosis (≥stage 3) and cirrhosis was 0.86 (0.82–0.90), 0.87 (0.82–0.93), 0.90 (0.84–0.94) and 0.91 (0.76–0.95), respectively. Similar diagnostic performance was observed in stratified analysis based on sex, obesity, and degree of inflammation.
Conclusions
Based on pooled IPD analysis, MRE has high diagnostic accuracy for detection of fibrosis in NAFLD, independent of BMI and degree of inflammation.
Keywords: Fibrosis, non-invasive, elastography, diagnostic performance, pooled analysis, cirrhosis, biomarker
INTRODUCTION
Non-alcoholic fatty liver disease (NAFLD) is the most common liver disease in the United States, and is likely to become the leading cause of liver transplantation in the next 10–20 years.[1–4] With emerging therapeutic modalities for management of NAFLD, early detection and non-invasive monitoring of patients at highest risk of fibrosis progression is important.
The current gold standard for staging of fibrosis is liver biopsy. However, this procedure is invasive, prone to sampling error, with considerable intra- and inter-observer variability in interpretation of histology.[5; 6] Several non-invasive ultrasound-based imaging tests have been developed, including transient elastography (TE) and acoustic radiation force impulse imaging (ARFI).[7] While ultrasound-based tests are low cost, they have high technical failure rate in obese patients.[8; 9] Additionally, these tests evaluate only a limited portion of the liver, and findings may be influenced by necroinflammatory activity, hepatic congestion and cholestasis.[7]
In contrast, magnetic resonance elastography (MRE), using a modified phase-contrast imaging sequence to detect propagating shear waves within the liver, provides a highly accurate, non-invasive measure of liver stiffness, evaluating a larger portion of the liver with the option of choosing the region of interest, and overcomes limitations in interpretations due to obesity or ascites making it more applicable, especially in NAFLD.[10; 11] The overall failure rate of MRE is 4.3%, with the majority of failures due to iron overload.[11]
We have recently reported a high diagnostic accuracy of MRE in patients with chronic liver diseases, but had a limited sample size of NAFLD patients and were limited in ability to perform subgroup analysis.[12; 13] Hence, in this systematic review, we sought to comprehensively evaluate the diagnostic performance of MRE for staging liver fibrosis focusing specifically on patients with NAFLD, through a pooled analysis of individual participant data (IPD). We performed a priori stratified analysis to assess whether sex, obesity and degree of necroinflammation influence the diagnostic performance of MRE. Through IPD, we were able to obtain relevant data on NAFLD from heterogeneous cohorts from multiple collaborators globally.
METHODS
This IPD pooled analysis was conducted and reported according to the Preferred Reporting Items for Systematic Reviews and Meta-Analyses (PRISMA) guidelines and recommendations from Riley et al.[14; 15] The process followed an a priori established protocol. This was exempt from ethical approval as the analysis involved only de-identified data, and all individual studies had received local ethics approval.
Selection Criteria and Search Strategy
We included all studies that met the following inclusion criteria: (a) evaluated the diagnostic performance of MRE as the index test, (b) used liver biopsy as the gold standard, (c) reported fibrosis using a comparable liver biopsy staging system (Brunt, NASH CRN Histologic Scoring System, Metavir, NAS fibrosis score, Desmet), (d) included adult patients with NAFLD in native livers, and (e) investigators were able to share IPD. Inclusion was not otherwise restricted by study size, language or publication type. We excluded studies in which MRE was not the diagnostic test, liver biopsy was not the gold standard, transplanted livers were studied, non-NAFLD etiology of liver disease existed, or sufficient IPD could not be obtained despite two attempts to contact study investigators. Details of the search strategy and method of obtained IPD are reported in the Supplementary Appendix. The last date of search was October 31, 2014.
Data Abstraction and Quality Assessment
The following IPD from each study was requested on patients with NAFLD – age at time of MRE, sex, body mass index (BMI), technique and reported liver stiffness on MRE, fibrosis stage on liver biopsy (and classification system used), degree of inflammation on liver biopsy (based on METAVIR activity grading – A0, no histologic necroinflammatory activity; A1, minimal activity, A2, moderate activity, A3, severe activity),[16] and interval between MRE and liver biopsy. To allow homogeneous comparison of liver fibrosis staging, we asked all groups to transform their reporting of fibrosis stage in accordance with a simplified 5-stage fibrosis scoring system, as reported in Supplementary Table 1.
The quality of included studies was assessed using the quality assessment of diagnostic accuracy studies (QUADAS) questionnaire.[17] Details of quality assessment are reported in the Supplementary Appendix.
Outcomes Assessed
The primary outcome of interest was the diagnostic performance of MRE for the diagnosis of any (≥stage 1), significant (≥stage 2) and advanced fibrosis (≥stage 3) and cirrhosis (stage 4) in patients with NAFLD, compared with the reference standard of liver biopsy. Results were reported as sensitivity, specificity, area under receiver-operating curve (AUROC) with corresponding MRE stiffness cut-offs.
We performed several pre-planned subgroup and stratified analysis based on sex (males v. females), presence of obesity (BMI≥30kg/m2 v. <30kg/m2) and degree of necroinflammatory activity (none-mild [A0–A1] v. moderate-severe [A2–A3]). In addition, we performed a sensitivity analysis restricting only to studies in which the interval between MRE and liver biopsy was ≤1 year, to minimize risk of disease progression bias.
Statistical Analysis
We performed descriptive analyses, reporting mean (standard deviation) or median (interquartile range) for continuous variables. To investigate the association between age, sex, necroinflammatory activity, and MRE, we constructed simple linear regression models while clustering was used to account for difference between studies. In case of multiple studies from the same center, after excluding overlapping patients, these studies were included as a single cohort.
We then calculated the AUROC by pooling IPD across the included studies using the non-parametric two-stage model proposed by Pepe et al.[18] The correlation within each study was adjusted through clustering. We estimated the 95% confidence interval (95% CI) using bootstrapping with replacement in 10,000 replications. Sensitivity and specificity of MRE and corresponding cut-offs were estimated using Youden index.[19] From pooled sensitivity and specificity, we estimated the positive and negative likelihood ratios (LR), with a positive LR higher than 5 and a negative LR less than 0.2 suggesting strong diagnostic evidence.[20] To compare the difference of AUROCs between subgroups, we used the interaction test proposed by Altman and Bland for comparisons with two estimates and one-way ANOVA for comparisons with more than two estimates.[21]
All statistical analyses were conducted using STATA version 12.1 (StataCorp LP, College Station, TX).
RESULTS
From 549 unique studies identified using our search strategy, 9 studies met our inclusion criteria.[13; 22–29] Seventeen studies were excluded after review of full text – 14 studies which did not include patients with NAFLD;[30–43] two studies from overlapping cohorts;[12; 44] and one study evaluating the role of MRE in pediatric NAFLD.[45] Only data from studies in which MRE was performed at 60–62.5Hz were included in this pooled analysis.
Characteristics and Quality of Included Studies
We analyzed IPD from 9 studies from 6 cohorts, with 232 unique patients with NAFLD (Table 1);[13; 22–29] one study was prospective.[13] Eight studies were conducted in USA at 5 centers and one study was conducted in Europe. All the studies used 1.5T MRI scanners, with shear waves generated at 60–62.5Hz.
Table. 1.
Characteristics of 9 included studies (6 independent cohorts).
| Study;Study Design | TimePeriod | Total numberof patients withNAFLD incohort | Patient characteristics | Standard Test | Index Test | ||
|---|---|---|---|---|---|---|---|
| Age, mean;Sex (%males) | BMI, mean(SD) | Fibrosisstagingsystem | Distribution offibrosis stage(stage 0/1/2/3/4) | Interval betweenMRE and liverbiopsy (days) | |||
| Rochester, Minnesota, U.S.A. – MRE Scanner – GE Medical Systems, WI, USA | |||||||
| Yin, 2007[29];Chen, 2011[24];Retrospective | 2005–2007,2007–2010 | 15, 58 | 53 (13); 23% | 36.3 (7.9) | Brunt | Stage 0/1/2/3/4 –35/18/4/6/10 | 33 (0–1696) |
| Chicago, Illinois, U.S.A. – MRE Scanner – Siemens Medical Solutions, Erlangen, Germany | |||||||
| Wang, 2011[28];Rustogi,2012[27];Retrospective | 2008–2009;2008–2011 | 8, 5 | 56 (8); 15% | 38.0 (NA) | Brunt | Stage 0/1/2/3/4 –2/4/3/2/2 | 69 (2–372) |
| San Diego, California, U.S.A. – MRE Scanner – GE Medical Systems, WI, USA | |||||||
| Loomba, 2014[4];Prospective | 2011–2013 | 117 | 50 (13); 44% | 32.4 (5.0) | NASH CRN | Stage 0/1/2/3/4 –40/43/11/16/7 | 45 (1–331) |
| Low, 2012[26];Retrospective | NR | 12 | 45 (16); 50% | NR | Metavir | Stage 0/1/2/3/4 –0/4/4/2/2 | NR |
| Cambridge, United Kingdom – MRE Scanner – GE Medical Systems, WI, USA | |||||||
| Godfrey,2012[25];Retrospective | 2007–2009 | 8 | 54 (8); 88% | NR | ModifiedNAS fibrosisscore | Stage 0/1/2/3/4 –1/4/1/2/0 | 1 (0) |
| Berlin, Germany – MRE Scanner – Siemens Medical Solutions, Erlangen, Germany | |||||||
| Asbach,2008[22];Asbach,2010[23];Retrospective | 2006–2009 | 1, 8 | 50 (8); 33% | 24.0 (2.5) | Desmet | Stage 0/1/2/3/4 –0/2/2/2/3 | 13 (2–34) |
Overall, these studies were at low risk of bias – 8 of the included studies had a QUADAS score ≥10 (Supplementary Table 2).[13; 22–25; 27–29] On assessment of individual QUADAS items, four studies were high risk of spectrum bias, especially since they reported on a control group of healthy patients and/or knew a priori the fibrosis stage of the patients;[22; 23; 26; 29] however, in this IPD pooled analysis, we included only patients with NAFLD (not healthy controls), minimizing the influence of spectrum bias on overall interpretation of diagnostic accuracy of MRE. One study provided insufficient information whether the results of MRE were interpreted while blinded to liver biopsy results, or vice versa, putting them at-risk for review bias;[26] one study was performed in patients with established stage 2 or stage 3/4 fibrosis.[22]
The mean age of the pooled cohort was 51±13 years and 37.5% were males. Mean BMI was 33.5±6.7 kg/m2 (n=200), with 73% classified as obese. The median interval between performance of MRE and liver biopsy was 38 days (IQR, 16–71 days); the interval was <1 year in 98.3% cases, and hence at low-risk of disease progression bias.
The distribution of fibrosis in the pooled cohort was: stage 0 33.6%, stage 1 32.3%, stage 2 10.8%, stage 3 12.9% and stage 4 10.4%; accordingly, 66.4% had any fibrosis (≥stage 1), 34.1% had significant fibrosis (≥stage 2), 23.3% had advanced fibrosis (≥stage 3) and 10.4% had cirrhosis. Distribution of histological necroinflammatory activity grade was available for 219 patients: 16.0% had no active inflammation, 39.7% had minimal inflammation, 39.7% had moderate inflammation and 4.6% had severe inflammation.
Diagnostic Accuracy of MRE
The mean liver stiffness across the entire cohort was 3.56±1.40 kPa, ranging from 1.6–10.3 kPa. On cluster-adjusted pooled analysis, the AUROC of MRE for diagnosis of any (≥stage 1), significant (≥stage 2) or advanced fibrosis (≥stage 3) and cirrhosis was 0.86, 0.87, 0.90 and 0.91, respectively, suggesting excellent discriminative ability for detection of advanced fibrosis and cirrhosis, and good discriminative ability for detection of any and significant fibrosis (Table 2, Supplementary Figure 1). The corresponding MRE liver stiffness cut-offs were 2.88, 3.54, 3.77 and 4.09 kPa, respectively. Figure 2 shows the mean liver stiffness values corresponding to stage 0, stage 1, stage 2, stage 3 and stage 4 fibrosis. Based on these estimates of sensitivity and specificity, we estimated high positive and negative LR particularly for detection of advanced fibrosis and cirrhosis (Table 2). We were unable to estimate a positive and negative predictive value due to variability of prevalence depending on clinical situation in which MRE is used (primary care clinic vs. referral center hepatology practice).
Table 2.
Pooled analysis of the diagnostic performance of magnetic resonance elastography for diagnosis and staging of liver fibrosis, based on 232 patients from 9 studies (6 independent cohorts).
| Fibrosis Stage | Optimal cut-off (kPa) | AUROC(95% CI) | Sensitivity (95%CI) | Specificity | PositiveLR | NegativeLR |
|---|---|---|---|---|---|---|
| Any Fibrosis (≥Stage 1) | 2.88 | 0.86 (0.82–0.90) | 0.75 (0.68–0.87) | 0.77 (0.65–0.88) | 3.24 | 0.33 |
| Significant Fibrosis (≥Stage 2) | 3.54 | 0.87 (0.82–0.93) | 0.79 (0.76–0.90) | 0.81 (0.72–0.91) | 4.14 | 0.27 |
| Advanced Fibrosis (≥Stage 3) | 3.77 | 0.90 (0.84–0.94) | 0.83 (0.53–0.90) | 0.86 (0.81–0.96) | 5.93 | 0.19 |
| Cirrhosis (Stage 4) | 4.09 | 0.91 (0.76–0.95) | 0.88 (0.82–1.00) | 0.87 (0.77–0.97) | 6.50 | 0.14 |
Figure 2.
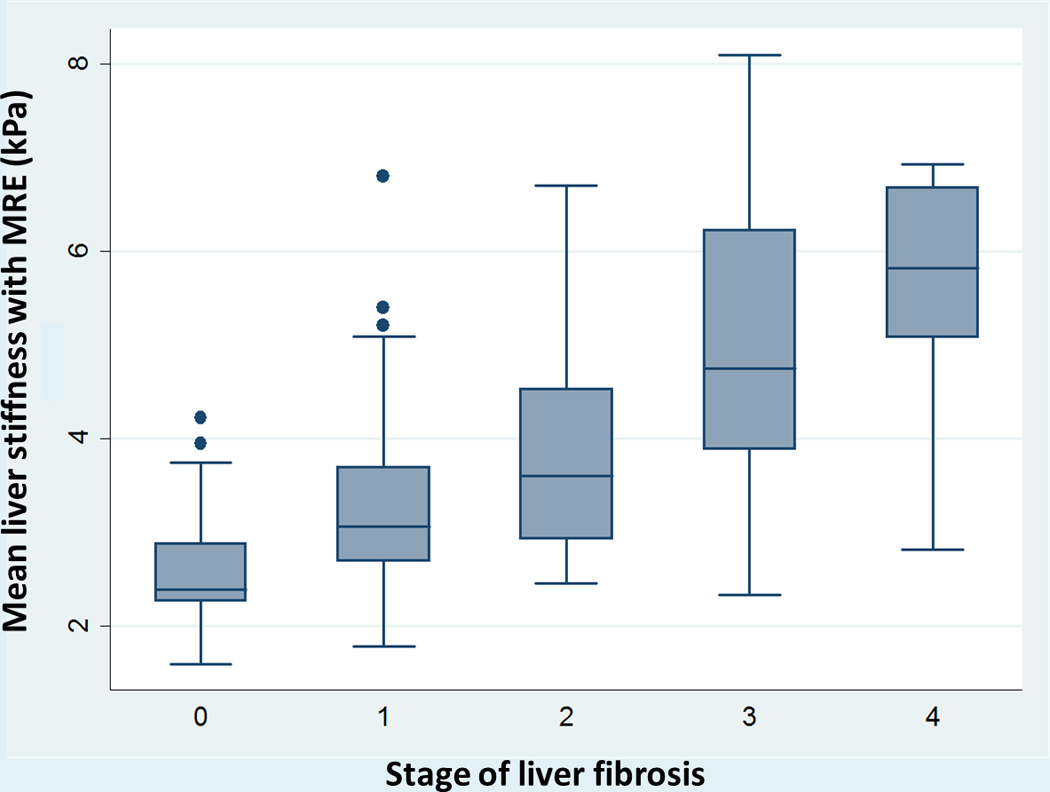
Composite box-plot graph showing magnetic resonance elastography (MRE), stiffness values for various stages of fibrosis. Horizontal line through each box represents a median value and each box top and bottom represent data from the 25th to 75th percentile (middle 50% of observations). Whiskers represent data from minimum to maximum excluding outliers which are represented as separate dots.
There was no correlation between sex (male vs. female: regression coefficient=−0.23, p=0.29) or grade of inflammation (absent-mild vs. moderate-severe inflammation, r=−0.53, p=0.28) and liver stiffness on MRE; there was a modest correlation between age and liver stiffness (per unit age: r=0.03, p=<0.01).
Subgroup and Sensitivity Analysis
On subgroup analysis, the diagnostic performance of MRE was comparable in males and females (Table 3). The presence or absence of obesity also did not influence the diagnostic accuracy for MRE at all stages of fibrosis. Likewise, the degree of necroinflammatory activity on liver biopsy did not significantly influence the diagnostic accuracy of MRE for detection of significant or advanced fibrosis.
Table 3.
Subgroup and sensitivity analyses. Diagnostic performance of MRE, stratified by sex, presence or absence of obesity and degree of necroinflammatory activity, as well as on restricting to patients in whom the interval between MRE and liver biopsy was <1 year.
| Categories | Subgroups¶ | FibrosisStage | AUROC | Sensitivity | Specificity | Categories |
|---|---|---|---|---|---|---|
| Sex | Males(n=87) | ≥1 | 0.88 (0.62–0.94) | 0.84 | 0.77 | Males vs. Females:≥F1: 0.67 |
| ≥2 | 0.85 (0.79–0.93) | 0.75 | 0.81 | ≥F2: 0.71 | ||
| ≥3 | 0.96 (0.89–0.99) | 0.87 | 0.94 | ≥F3: 0.05 | ||
| Stage 4 | 0.93 (0.79–0.97) | 1.00 | 0.90 | F4: 0.77 | ||
| Females(n=145) | ≥1 | 0.85 (0.80–0.93) | 0.72 | 0.85 | ||
| ≥2 | 0.88 (0.77–0.94) | 0.82 | 0.84 | |||
| ≥3 | 0.88 (0.80–0.93) | 0.82 | 0.83 | |||
| Stage 4 | 0.90 (0.71–0.95) | 0.84 | 0.85 | |||
| Obesity | BMI ≥30kg/m2(obese)(n=141) | ≥1 | 0.85 (0.83–0.89) | 0.68 | 0.83 | Obese vs. non-obese≥F1: 0.30 |
| ≥2 | 0.88 (0.85–0.96) | 0.78 | 0.88 | ≥F2: 0.51 | ||
| ≥3 | 0.90 (0.70–0.93) | 0.86 | 0.84 | ≥F3: 0.25 | ||
| Stage 4 | 0.91 (0.75–0.94) | 0.81 | 0.91 | F4: 0.33 | ||
| BMI <30kg/m2(n=59) | ≥1 | 0.79 (0.63–0.96) | 0.68 | 0.86 | ||
| ≥2 | 0.84 (0.80–1.00) | 0.75 | 0.79 | |||
| ≥3 | 0.97 (0.95–1.00) | 0.89 | 0.96 | |||
| Stage 4 | 0.98 (0.82–1.00) | 1.00 | 0.91 | |||
| Inflammation grade | Absent-mild(n=123) | ≥1 | 0.84 (0.77–0.90) | 0.77 | 0.78 | Absent-mild inflammationvs. moderate-severeinflammation≥F1: 0.70 |
| ≥2 | 0.89 (0.79–0.96) | 0.82 | 0.87 | ≥F2: 0.65 | ||
| ≥3 | 0.90 (0.82–0.96) | 0.94 | 0.82 | ≥F3: 0.83 | ||
| Stage 4 | 0.95 (0.87–0.99) | 0.91 | 0.90 | F4: 0.56 | ||
| Moderate-severe(n=97) | ≥1 | 0.87 (0.84–1.00) | 0.71 | 0.90 | ||
| ≥2 | 0.86 (0.84–0.95) | 0.76 | 0.84 | |||
| ≥3 | 0.91 (0.73–0.93) | 0.91 | 0.82 | |||
| Stage 4 | 0.91 (0.76–0.93) | 0.90 | 0.89 | |||
| Sensitivity Analysis | ||||||
| Interval between MRE and liver biopsy | <1 year(n=219) | ≥1 | 0.85 (0.79–0.88) | 0.73 | 0.80 | N/A |
| ≥2 | 0.87 (0.83–0.94) | 0.79 | 0.86 | |||
| ≥3 | 0.91 (0.84–0.95) | 0.92 | 0.82 | |||
| Stage 4 | 0.93 (0.82–0.96) | 0.91 | 0.87 |
When we excluded patients in whom the interval between MRE and liver biopsy was >1 year (1.7% of cohort of pooled cohort), MRE continued to have excellent discriminative ability for detection of advanced fibrosis and cirrhosis (Table 3).
DISCUSSION
In this systematic review and IPD pooled analysis of diagnostic performance of MRE in 9 studies (6 independent cohorts) with 232 patients with NAFLD, we made several key observations. First, the overall diagnostic accuracy of MRE in patients with NAFLD for discriminating advanced fibrosis (≥stage 3) is excellent with an AUROC of 0.90–0.91; MRE’s performance for diagnosis of significant (≥stage 2) and any (≥stage 1) fibrosis is also very good (AUROC 0.86–0.87). The optimal cut-off of MRE for diagnosis of any, significant and advanced fibrosis and cirrhosis derived from this pooled analysis of patients with CLD is 2.88, 3.54, 3.77 and 4.09 kPa, respectively. Second, the diagnostic performance of MRE is robust and stable, independent of sex and obesity. Third, in our pooled analysis, we did not observe a significant difference in the diagnostic performance of MRE in patients with increasing necroinflammatory activity. Overall, the results are similar to that observed in our previous pooled analysis on diagnostic performance of MRE in all patients with chronic liver diseases, which included only 115 patients with NAFLD.[12]
Though there were no head-to-head comparisons, overall, the diagnostic performance of MRE appears comparable, if not superior, to that of ultrasound-based methods of TE and ARFI. In a combined French-Chinese cohort study of diagnostic performance of TE in 246 patients with NAFLD, Wong et al observed that the AUROC for detection of significant and advanced fibrosis and cirrhosis was 0.84, 0.93 and 0.95, respectively.[46] However, the mean BMI of patients in their cohort was 28.0 kg/m2, and only 28.5% of patients were obese. In another study in 100 obese patients undergoing bariatric surgery (mean BMI, 42.3kg/m2), the AUROC for detection of significant and advanced fibrosis with TE was 0.81 and 0.85, respectively.[47] In a study-level meta-analysis of M-probe TE in patients with NAFLD, Kwok et al observed that the AUROC for significant and advanced fibrosis was 0.78–0.87 and 0.76–0.98.[48] However, study-level diagnostic accuracy meta-analysis of aggregate data have several limitations including (a) overestimation of diagnostic performance due to spectrum bias (inclusion of healthy controls), (b) selective reporting bias in individual studies (and inability to account for those at an aggregate level), (c) potential overlap of patients across studies which results in double-counting, (d) inability to identify an optimal diagnostic threshold, (e) high degree of heterogeneity (due to differences in patient characteristics, diagnostic thresholds in individual studies, etc.) and (f) limited subgroup analyses to examine stability of association and sources of heterogeneity.
Failure rate of TE is significantly higher than MRE, especially in obese patients. In a single center prospective study of over 13,000 TE exams, the rate of failed or unreliable TE measurements in obese patients was 16.9% and 35.4%.[8]; similarly, the rate of unreliable ARFI exams in obese patients was 17.6%.[9] Obesity, in particular high waist circumference, has also been associated with higher discordance with biopsy findings with both over- and underestimation of fibrosis stage.[49; 50] With the use of XL probe for TE, this failure rate is lower but still continues to be higher than that observed for MRE.[51] We observed that the diagnostic performance of MRE was unaffected by obesity, with comparable AUROCs in obese and non-obese patients; however, this should be interpreted with caution since there may have been an intrinsic selection bias wherein patients with morbid obesity may have been excluded due to inability to accommodate in the MRI scanner. The failure rate of MRE is <5% and usually related to iron overload; newer improved sequences are available to perform MRE in patients with iron overload, and it is anticipated that the failure rate would decrease to <1%. Comparative studies of MRE and TE have also suggested higher technical success rate as well as superior diagnostic accuracy of MRE.[36]
Recent studies have suggested that chronic necroinflammatory activity due to NAFLD may influence TE-measured liver stiffness in patients at all stages of fibrosis and is a strong confounding variable.[53; 54] In our pooled analysis, the diagnostic accuracy of MRE for detection of significant or advanced fibrosis was not significantly influenced by presence of severe inflammation. However, in a recent study, Ichikawa et al have observed that hepatitis activity grade may also influence liver stiffness measured using MRE.[55] Large, prospective studies are needed to study the influence of inflammation on MRE-measured liver stiffness.
Strengths and Limitations
Using participant level data, through collaboration with multiple research groups, we were able to overcome limitations of study-level meta-analysis by (a) being able to abstract data only on patients with NAFLD, (b) using standardized statistical analysis across studies, (c) adjusting for baseline potential confounding factors (like age, sex, obesity, necroinflammatory activity etc.), (d) accounting for missing data and minimizing overlapping data in different studies, (e) decreasing selective reporting bias, (f) attempting to minimize spectrum bias by excluding data from healthy controls and (g) assessing robustness of association and sources of heterogeneity using subgroup and stratified analysis. Hence, AUROC derived from this IPD pooled analysis represents a more reliable, accurate and real-world diagnostic performance of MRE for staging hepatic fibrosis.
Besides being an IPD pooled analysis, our systematic review had several other strengths, including: (a) comprehensive and systematic literature search with well-defined inclusion criteria, carefully excluding redundant studies; (b) rigorous evaluation of study quality; (c) sub-group and sensitivity analyses to evaluate the stability of findings and identify potential factors responsible for inconsistencies and (d) being able to establish optimal diagnostic thresholds corresponding to the inflection point in the ROC.
There were several limitations in our study. First, our analysis was only able to evaluate the diagnostic performance of MRE performed at 60–62.5Hz, and not at 50Hz as is practiced in certain parts of Europe. Studies using MRE performed at 50Hz have suggested a similar high diagnostic accuracy for detection of significant and advanced fibrosis.[31; 36] Second, while IPD pooled analysis was able to alleviate several of the limitations of a conventional aggregate data meta-analysis, ours was still a retrospective analysis with several inherent variations due to lack of standardized performance of index test and lack of centralized reading of biopsies. Only one study included in the analysis was prospective. Variable liver fibrosis staging systems were used in individual studies. We tried to improve comparability by a priori requesting investigators to transform fibrosis stages into a simplified 5-stage fibrosis scoring system; however, such a transformation may result in misclassification. Third, there was incomplete capturing of some potential confounding factors in the included studies, such as BMI (available for 200/232 patients). However, as best as we could assess with available data, it is unlikely that these variables would significantly influence the diagnostic performance of MRE. Fourth, though we were able to identify optimal diagnostic thresholds, these should be interpreted cautiously and require prospective validation in a well-defined population; these thresholds are likely to vary depending on practice where MRE is applied. Fifth, the gold standard in these included studies was liver biopsy. Liver biopsy itself is not a perfect gold standard, since it samples only 1/50,000 of total liver mass and significant discrepancy in fibrosis stage as high as 33% can be observed depending on site of liver biopsy.[5; 6] It is conceivable that the diagnostic accuracy of MRE may in fact be higher given its ability to globally evaluate the liver. Further studies are needed to systematically reassess the misclassified patients to further calibrate the true diagnostic accuracy of MRE. Finally, our study was not designed to address the diagnostic performance of MRE or other imaging modalities for differentiation of fatty liver alone and steatohepatitis, or to examine its prognostic utility.[56]
In conclusion, through a systematic review and IPD pooled analysis, we observed that MRE is a highly accurate, non-invasive technique for staging liver fibrosis in patients with NAFLD, which is not significantly influenced by age, sex, obesity and degree of inflammation. Longitudinal studies are needed to assess whether changes in MRE-derived liver stiffness as a result of treatment predicts improvement in long term clinical outcomes, and whether it can be used as end-point in treatment trials.[57] Comparative prospective studies of ultrasound-based elastographic techniques like TE and ARFI, and MRE are warranted.
Supplementary Material
supp1
supp2
supplemental figure 1. SUPPLEMENTARY FIGURES.
Supplementary Figure 1. Cluster-adjusted pooled area under receiver operator curve (AUROC) of MRE for diagnosis of any (≥stage 1), significant (≥stage 2) or advanced fibrosis (≥stage 3) and cirrhosis.
Figure 1.

Flow sheet summarizing study identification and selection.
Key Points.
- MRE has high diagnostic accuracy for detection of fibrosis in NAFLD.
- BMI does not significantly affect accuracy of MRE in NAFLD.
- Inflammation had no significant influence on MRE performance in NAFLD for fibrosis.
Acknowledgments
This work is supported in part by National Institute of Health (NIH) grant EB001981 to MY, JC and RLE and American Gastroenterological Association (AGA) Foundation – Sucampo – ASP Designated Research Award in Geriatric Gastroenterology and by a T. Franklin Williams Scholarship Award and grant K23-DK090303-04 to RL. MY, JC, RLE and the Mayo Clinic have intellectual property relating to the subject and may be eligible for royalties from licensing. RLE is CEO of Resoundant, Inc.
We wish to thank Ms. Patricia Erwin, M.L.S., Senior Medical Librarian at the Mayo Clinic Library for helping in the literature search for this systematic review and meta-analysis.
Footnotes
Disclosures: This research has been reviewed by the Mayo Clinic Conflict of Interest Review Board and is being conducted in compliance with Mayo Clinic Conflict of Interest policies. None of the other authors have any disclosures.
Author Contributions:
Study concept and design: SS, SKV, RL
Acquisition of data: SS, SKV, RL, FHM, RNL, TH, PA, EMG, MY, JC, JAT, RLE
Statistical analysis: ZW, MHM, SS, SKV
Interpretation of results: SS, SKV
Drafting of the manuscript: SS, SKV
Critical revision of the manuscript for important intellectual content: RL, FHM, RNL, TH, PA, EMG, MY, JC, ZW, MHM, JAT, RLE
Approval of the final manuscript: SS, RL, FHM, RNL, TH, PA, EMG, MY, JC, ZW, MHM, JAT, RLE, SKV
Study supervision: SKV
REFERENCES
- 1.Lazo M, Hernaez R, Eberhardt MS, et al. Prevalence of nonalcoholic fatty liver disease in the United States: the Third National Health and Nutrition Examination Survey, 1988–1994. Am J Epidemiol. 2013;178:38–45. doi: 10.1093/aje/kws448. [DOI] [PMC free article] [PubMed] [Google Scholar]
- 2.Vernon G, Baranova A, Younossi ZM. Systematic review: the epidemiology and natural history of non-alcoholic fatty liver disease and non-alcoholic steatohepatitis in adults. Aliment Pharmacol Ther. 2011;34:274–285. doi: 10.1111/j.1365-2036.2011.04724.x. [DOI] [PubMed] [Google Scholar]
- 3.Chalasani N, Younossi Z, Lavine JE, et al. The diagnosis and management of non-alcoholic fatty liver disease: practice guideline by the American Gastroenterological Association, American Association for the Study of Liver Diseases, and American College of Gastroenterology. Gastroenterology. 2012;142:1592–1609. doi: 10.1053/j.gastro.2012.04.001. [DOI] [PubMed] [Google Scholar]
- 4.Loomba R, Sanyal AJ. The global NAFLD epidemic. Nat Rev Gastroenterol Hepatol. 2013;10:686–690. doi: 10.1038/nrgastro.2013.171. [DOI] [PubMed] [Google Scholar]
- 5.Bravo AA, Sheth SG, Chopra S. Liver biopsy. N Engl J Med. 2001;344:495–500. doi: 10.1056/NEJM200102153440706. [DOI] [PubMed] [Google Scholar]
- 6.Regev A, Berho M, Jeffers LJ, et al. Sampling error and intraobserver variation in liver biopsy in patients with chronic HCV infection. Am J Gastroenterol. 2002;97:2614–2618. doi: 10.1111/j.1572-0241.2002.06038.x. [DOI] [PubMed] [Google Scholar]
- 7.Castera L. Noninvasive methods to assess liver disease in patients with hepatitis B or C. Gastroenterology. 2012;142:1293–1302. e1294. doi: 10.1053/j.gastro.2012.02.017. [DOI] [PubMed] [Google Scholar]
- 8.Castera L, Foucher J, Bernard PH, et al. Pitfalls of liver stiffness measurement: a 5-year prospective study of 13,369 examinations. Hepatology. 2010;51:828–835. doi: 10.1002/hep.23425. [DOI] [PubMed] [Google Scholar]
- 9.Bota S, Sporea I, Sirli R, et al. Factors associated with the impossibility to obtain reliable liver stiffness measurements by means of Acoustic Radiation Force Impulse (ARFI) elastography--analysis of a cohort of 1,031 subjects. Eur J Radiol. 2014;83:268–272. doi: 10.1016/j.ejrad.2013.11.019. [DOI] [PubMed] [Google Scholar]
- 10.Venkatesh SK, Yin M, Ehman RL. Magnetic resonance elastography of liver: technique, analysis, and clinical applications. J Magn Reson Imaging. 2013;37:544–555. doi: 10.1002/jmri.23731. [DOI] [PMC free article] [PubMed] [Google Scholar]
- 11.Singh S, Venkatesh SK, Wang Z, et al. Diagnostic Performance of Magnetic Resonance Elastography in Staging Liver Fibrosis: A Systematic Review and Meta-analysis of Individual Participant Data. Clin Gastroenterol Hepatol. 2014 doi: 10.1016/j.cgh.2014.09.046. 10.1016/j.cgh.2014.09.046. [DOI] [PMC free article] [PubMed] [Google Scholar]
- 12.Kim D, Kim WR, Talwalkar JA, Kim HJ, Ehman RL. Advanced fibrosis in nonalcoholic fatty liver disease: noninvasive assessment with MR elastography. Radiology. 2013;268:411–419. doi: 10.1148/radiol.13121193. [DOI] [PMC free article] [PubMed] [Google Scholar]
- 13.Loomba R, Wolfson T, Ang B, et al. Magnetic resonance elastography predicts advanced fibrosis in patients with nonalcoholic fatty liver disease: A prospective study. Hepatology. 2014 doi: 10.1002/hep.27362. 10.1002/hep.27362. [DOI] [PMC free article] [PubMed] [Google Scholar]
- 14.Moher D, Liberati A, Tetzlaff J, Altman DG Group P. Preferred reporting items for systematic reviews and meta-analyses: the PRISMA statement. Ann Intern Med. 2009;151:264–269. W264. doi: 10.7326/0003-4819-151-4-200908180-00135. [DOI] [PubMed] [Google Scholar]
- 15.Riley RD, Lambert PC, Abo-Zaid G. Meta-analysis of individual participant data: rationale, conduct, and reporting. BMJ. 2010;340:c221. doi: 10.1136/bmj.c221. [DOI] [PubMed] [Google Scholar]
- 16.Bedossa P, Poynard T. An algorithm for the grading of activity in chronic hepatitis C. The METAVIR Cooperative Study Group. Hepatology. 1996;24:289–293. doi: 10.1002/hep.510240201. [DOI] [PubMed] [Google Scholar]
- 17.Whiting P, Rutjes AW, Reitsma JB, Bossuyt PM, Kleijnen J. The development of QUADAS: a tool for the quality assessment of studies of diagnostic accuracy included in systematic reviews. BMC Med Res Methodol. 2003;3:25. doi: 10.1186/1471-2288-3-25. [DOI] [PMC free article] [PubMed] [Google Scholar]
- 18.Pepe MS. Receiver Operating Characteristic Methodology. Journal of the American Statistical Association. 2000;95:308–311. [Google Scholar]
- 19.Youden WJ. Index for rating diagnostic tests. Cancer. 1950;3:32–35. doi: 10.1002/1097-0142(1950)3:1<32::aid-cncr2820030106>3.0.co;2-3. [DOI] [PubMed] [Google Scholar]
- 20.Jaeschke R, Guyatt GH, Sackett DL. Users' guides to the medical literature. III. How to use an article about a diagnostic test. B. What are the results and will they help me in caring for my patients? The Evidence-Based Medicine Working Group. JAMA. 1994;271:703–707. doi: 10.1001/jama.271.9.703. [DOI] [PubMed] [Google Scholar]
- 21.Altman DG, Bland JM. Interaction revisited: the difference between two estimates. BMJ. 2003;326:219. doi: 10.1136/bmj.326.7382.219. [DOI] [PMC free article] [PubMed] [Google Scholar]
- 22.Asbach P, Klatt D, Hamhaber U, et al. Assessment of liver viscoelasticity using multifrequency MR elastography. Magn Reson Med. 2008;60:373–379. doi: 10.1002/mrm.21636. [DOI] [PubMed] [Google Scholar]
- 23.Asbach P, Klatt D, Schlosser B, et al. Viscoelasticity-based staging of hepatic fibrosis with multifrequency MR elastography. Radiology. 2010;257:80–86. doi: 10.1148/radiol.10092489. [DOI] [PubMed] [Google Scholar]
- 24.Chen J, Talwalkar JA, Yin M, Glaser KJ, Sanderson SO, Ehman RL. Early detection of nonalcoholic steatohepatitis in patients with nonalcoholic fatty liver disease by using MR elastography. Radiology. 2011;259:749–756. doi: 10.1148/radiol.11101942. [DOI] [PMC free article] [PubMed] [Google Scholar]
- 25.Godfrey EM, Patterson AJ, Priest AN, et al. A comparison of MR elastography and 31P MR spectroscopy with histological staging of liver fibrosis. Eur Radiol. 2012;22:2790–2797. doi: 10.1007/s00330-012-2527-x. [DOI] [PubMed] [Google Scholar]
- 26.Low RN, Hassanein T. MR elastography: Validation and reproducibility of measurements of mean liver stiffness and fibrosis. J Hepatol. 2012;56:S415. [Google Scholar]
- 27.Rustogi R, Horowitz J, Harmath C, et al. Accuracy of MR elastography and anatomic MR imaging features in the diagnosis of severe hepatic fibrosis and cirrhosis. Journal of Magnetic Resonance Imaging. 2012;35:1356–1364. doi: 10.1002/jmri.23585. [DOI] [PMC free article] [PubMed] [Google Scholar]
- 28.Wang Y, Ganger DR, Levitsky J, et al. Assessment of chronic hepatitis and fibrosis: comparison of MR elastography and diffusion-weighted imaging. AJR Am J Roentgenol. 2011;196:553–561. doi: 10.2214/AJR.10.4580. [DOI] [PMC free article] [PubMed] [Google Scholar]
- 29.Yin M, Talwalkar JA, Glaser KJ, et al. Assessment of Hepatic Fibrosis With Magnetic Resonance Elastography. Clinical Gastroenterology and Hepatology. 2007;5:1207–1213. e1202. doi: 10.1016/j.cgh.2007.06.012. [DOI] [PMC free article] [PubMed] [Google Scholar]
- 30.Batheja MJ, Silva AC, De Petris G, Vargas H. Role of magnetic resonance elastography in assessing hepatic fibrosis. Gastroenterology. 2011;1:S927. doi: 10.1007/s00261-014-0321-8. [DOI] [PubMed] [Google Scholar]
- 31.Bohte AE, de Niet A, Jansen L, et al. Non-invasive evaluation of liver fibrosis: a comparison of ultrasound-based transient elastography and MR elastography in patients with viral hepatitis B and C. Eur Radiol. 2014;24:638–648. doi: 10.1007/s00330-013-3046-0. [DOI] [PubMed] [Google Scholar]
- 32.Choi YR, Lee JM, Yoon JH, Han JK, Choi BI. Comparison of magnetic resonance elastography and gadoxetate disodium-enhanced magnetic resonance imaging for the evaluation of hepatic fibrosis. Invest Radiol. 2013;48:607–613. doi: 10.1097/RLI.0b013e318289ff8f. [DOI] [PubMed] [Google Scholar]
- 33.Crespo S, Bridges MD, Nakhleh R, McPhail A, Pungpapong S, Keaveny AP. Magnetic resonance elastography compared with liver biopsy in evaluating fibrosis due to recurrent HCV after liver transplantation. American Journal of Transplantation. 2010;10:157. [Google Scholar]
- 34.Huwart L, Peeters F, Sinkus R, et al. Liver fibrosis: non-invasive assessment with MR elastography. NMR Biomed. 2006;19:173–179. doi: 10.1002/nbm.1030. [DOI] [PubMed] [Google Scholar]
- 35.Huwart L, Sempoux C, Salameh N, et al. Liver fibrosis: noninvasive assessment with MR elastography versus aspartate aminotransferase-to-platelet ratio index. Radiology. 2007;245:458–466. doi: 10.1148/radiol.2452061673. [DOI] [PubMed] [Google Scholar]
- 36.Huwart L, Sempoux C, Vicaut E, et al. Magnetic resonance elastography for the noninvasive staging of liver fibrosis. Gastroenterology. 2008;135:32–40. doi: 10.1053/j.gastro.2008.03.076. [DOI] [PubMed] [Google Scholar]
- 37.Ichikawa S, Motosugi U, Ichikawa T, et al. Magnetic resonance elastography for staging liver fibrosis in chronic hepatitis C. Magn Reson Med Sci. 2012;11:291–297. doi: 10.2463/mrms.11.291. [DOI] [PubMed] [Google Scholar]
- 38.Kim BH, Lee JM, Lee YJ, et al. MR elastography for noninvasive assessment of hepatic fibrosis: experience from a tertiary center in Asia. J Magn Reson Imaging. 2011;34:1110–1116. doi: 10.1002/jmri.22723. [DOI] [PubMed] [Google Scholar]
- 39.Klatt DAP, Kamphues C, Hirsch S, Papazoglou S, Braun J, Sack I. MR elastography of liver transplant patients using parallel imaging techniques. Proc Intl Soc Mag Reson Med. 2011;19:1485. [Google Scholar]
- 40.Lee VS, Miller FH, Omary RA, et al. Magnetic resonance elastography and biomarkers to assess fibrosis from recurrent hepatitis C in liver transplant recipients. Transplantation. 2011;92:581–586. doi: 10.1097/TP.0b013e31822805fa. [DOI] [PubMed] [Google Scholar]
- 41.Nguyen D, Talwalkar JA, Yin M, Lindor KD, Ehman RL. Assessment of hepatic fibrosis by magnetic resonance elastography in patients with sclerosing cholangitis. Gastroenterology. 2011;1:S919. [Google Scholar]
- 42.Venkatesh SK, Wang G, Lim SG, Wee A. Magnetic resonance elastography for the detection and staging of liver fibrosis in chronic hepatitis B. Eur Radiol. 2013 doi: 10.1007/s00330-013-2978-8. 10.1007/s00330-013-2978-8-1-9. [DOI] [PubMed] [Google Scholar]
- 43.Yoon JH, Lee JM, Woo HS, et al. Staging of hepatic fibrosis: comparison of magnetic resonance elastography and shear wave elastography in the same individuals. Korean J Radiol. 2013;14:202–212. doi: 10.3348/kjr.2013.14.2.202. [DOI] [PMC free article] [PubMed] [Google Scholar]
- 44.Rouviere O, Yin M, Dresner MA, et al. MR elastography of the liver: preliminary results. Radiology. 2006;240:440–448. doi: 10.1148/radiol.2402050606. [DOI] [PubMed] [Google Scholar]
- 45.Xanthakos SA, Podberesky DJ, Serai SD, et al. Use of magnetic resonance elastography to assess hepatic fibrosis in children with chronic liver disease. J Pediatr. 2014;164:186–188. doi: 10.1016/j.jpeds.2013.07.050. [DOI] [PMC free article] [PubMed] [Google Scholar]
- 46.Wong VW, Vergniol J, Wong GL, et al. Diagnosis of fibrosis and cirrhosis using liver stiffness measurement in nonalcoholic fatty liver disease. Hepatology. 2010;51:454–462. doi: 10.1002/hep.23312. [DOI] [PubMed] [Google Scholar]
- 47.Naveau S, Lamouri K, Pourcher G, et al. The Diagnostic Accuracy of Transient Elastography for the Diagnosis of Liver Fibrosis in Bariatric Surgery Candidates with Suspected NAFLD. Obes Surg. 2014;24:1693–1701. doi: 10.1007/s11695-014-1235-9. [DOI] [PubMed] [Google Scholar]
- 48.Kwok R, Tse YK, Wong GL, et al. Systematic review with meta-analysis: non-invasive assessment of non-alcoholic fatty liver disease--the role of transient elastography and plasma cytokeratin-18 fragments. Aliment Pharmacol Ther. 2014;39:254–269. doi: 10.1111/apt.12569. [DOI] [PubMed] [Google Scholar]
- 49.Myers RP, Pomier-Layrargues G, Kirsch R, et al. Discordance in fibrosis staging between liver biopsy and transient elastography using the FibroScan XL probe. J Hepatol. 2012;56:564–570. doi: 10.1016/j.jhep.2011.10.007. [DOI] [PubMed] [Google Scholar]
- 50.Petta S, Di Marco V, Camma C, Butera G, Cabibi D, Craxi A. Reliability of liver stiffness measurement in non-alcoholic fatty liver disease: the effects of body mass index. Aliment Pharmacol Ther. 2011;33:1350–1360. doi: 10.1111/j.1365-2036.2011.04668.x. [DOI] [PubMed] [Google Scholar]
- 51.Myers RP, Pomier-Layrargues G, Kirsch R, et al. Feasibility and diagnostic performance of the FibroScan XL probe for liver stiffness measurement in overweight and obese patients. Hepatology. 2012;55:199–208. doi: 10.1002/hep.24624. [DOI] [PubMed] [Google Scholar]
- 52.Sagir A, Erhardt A, Schmitt M, Haussinger D. Transient elastography is unreliable for detection of cirrhosis in patients with acute liver damage. Hepatology. 2008;47:592–595. doi: 10.1002/hep.22056. [DOI] [PubMed] [Google Scholar]
- 53.Kim SU, Kim JK, Park YN, Han KH. Discordance between liver biopsy and Fibroscan(R) in assessing liver fibrosis in chronic hepatitis b: risk factors and influence of necroinflammation. PLoS One. 2012;7:e32233. doi: 10.1371/journal.pone.0032233. [DOI] [PMC free article] [PubMed] [Google Scholar]
- 54.Tapper EB, Cohen EB, Patel K, et al. Levels of alanine aminotransferase confound use of transient elastography to diagnose fibrosis in patients with chronic hepatitis C virus infection. Clin Gastroenterol Hepatol. 2012;10:932–937. e931. doi: 10.1016/j.cgh.2012.01.015. [DOI] [PMC free article] [PubMed] [Google Scholar]
- 55.Ichikawa S, Motosugi U, Nakazawa T, et al. Hepatitis activity should be considered a confounder of liver stiffness measured with MR elastography. J Magn Reson Imaging. 2014 doi: 10.1002/jmri.24666. 10.1002/jmri.24666. [DOI] [PubMed] [Google Scholar]
- 56.Singh S, Fujii LL, Murad MH, et al. Liver stiffness is associated with risk of decompensation, liver cancer, and death in patients with chronic liver diseases: a systematic review and meta-analysis. Clin Gastroenterol Hepatol. 2013;11:1573–1584. e1571–e1572. doi: 10.1016/j.cgh.2013.07.034. quiz e1588-1579. [DOI] [PMC free article] [PubMed] [Google Scholar]
- 57.Loomba R, Sirlin CB, Ang B, et al. Ezetimibe for the treatment of nonalcoholic steatohepatitis: Assessment by novel MRI and MRE in a randomized trial (MOZART Trial) Hepatology. 2014 doi: 10.1002/hep.27647. 10.1002/hep.27647. [DOI] [PMC free article] [PubMed] [Google Scholar]
Associated Data
This section collects any data citations, data availability statements, or supplementary materials included in this article.
Supplementary Materials
supp1
supp2
supplemental figure 1. SUPPLEMENTARY FIGURES.
Supplementary Figure 1. Cluster-adjusted pooled area under receiver operator curve (AUROC) of MRE for diagnosis of any (≥stage 1), significant (≥stage 2) or advanced fibrosis (≥stage 3) and cirrhosis.