Dairy products intake and cancer mortality risk: a meta-analysis of 11 population-based cohort studies (original) (raw)
Abstract
Background
Dairy products are major components of daily diet and the association between consumption of dairy products and public health issues has captured great attention. In this study, we conducted a meta-analysis to investigate the association between dairy products intake and cancer mortality risk.
Methods
After a literature search in PubMed and EMBASE, 11 population-based cohort studies involving 778,929 individuals were considered eligible and included in the analyses. Data were extracted and the association between dairy products intake and cancer mortality risk was estimated by calculating pooled relative risks (RRs) and corresponding 95 % confidence intervals (CIs). Sensitivity analyses and subgroup analyses based on regions, genders and dairy types were performed as well. Potential dose–response relationship was further explored by adopting the generalized least squares (GLST) method.
Results
Total dairy products intake was not associated with all cancer mortality risk, with the pooled RR of 0.99 (95 % CI 0.92–1.07, p = 0.893). Subgroup analyses showed that the pooled RRs were 0.97 (95 % CI 0.92–1.03, p = 0.314) for milk, 0.88 (95 % CI 0.71–1.10, p = 0.271) for yogurt, 1.23 (95 % CI 0.94–1.61, p = 0.127) for cheese and 1.13 (95 % CI 0.89–1.44, p = 0.317) for butter in male and female, however the pooled RR was 1.50 (95 % CI 1.03–2.17, p = 0.032) for whole milk in male, which was limited to prostate cancer. Further dose–response analyses were performed and we found that increase of whole milk (serving/day) induced elevated prostate cancer mortality risk significantly, with the RR of 1.43 (95 % CI 1.13–1.81, p = 0.003).
Conclusions
Total dairy products intake have no significant impact on increased all cancer mortality risk, while low total dairy intake even reduced relative risk based on the non-linear model. However, whole milk intake in men contributed to elevated prostate cancer mortality risk significantly. Furthermore, a linear dose–response relationship existed between increase of whole milk intake and increase of prostate cancer mortality risk.
Keywords: Dairy products, Cancer, Mortality risk, Dose–response, Meta-analysis
Background
Dairy products are major components of daily diet and due to their abundant nutrient elements such as protein, fat, minerals and vitamins, they are listed as core parts of dietary recommendation worldwide [1]. The proportion of dairy consumption was steadily increasing in several countries such as Japan since the past few decades [2]. Due to the large amount of dairy products intake in our daily life and their complex composition, the emerging role of dairy products has draw researchers’ attention extensively in public health.
It was universally acknowledged that dairy products intake was closely related to certain health issues. On the one hand, nutrients from dairy products were beneficial for chronic diseases such as cancer. For instance, casein was proved to have potential antimutagenic [3] and anticarcinogenic properties [4], while whey protein hydrolysate was demonstrated to protect against chemical-induced mammary tumor in rats [5]. On the other hand, some studies drew opposite conclusions. Park et al. confirmed that the milk protein casein promoted the proliferation of prostate cancer cells through in vitro assay [6]. Kroenke et al. harbored the view that high-fat dairy intake was associated with poor prognosis after breast cancer diagnosis, however no significant effect was found with respect to low-fat dairy intake [7]. Yang et al. demonstrated that among men with non-metastatic prostate cancer, post diagnostic dairy products intake increased prostate cancer-specific mortality risk and all-cause mortality risk [8]. In the aspect of cancer incidence risk, Huncharek et al. stated that higher consumption of milk or dairy products reduced colon cancer incidence risk [9], while Faber et al. suggested that dairy products increased risk of ovarian cancer modestly [10].
A few studies have conducted meta-analyses to investigate the correlation between dairy products intake and cancer incidence risk in colorectal [11], prostate [12], pancreatic [13], gastric [14] and ovarian cancers [15], nevertheless the relationship between dairy products intake and cancer mortality risk was diverse and inconsistent across individual studies, which has not been discussed systematically yet. Therefore, we conducted the meta-analysis to comprehensively explore this issue.
Materials and methods
Literature search
This meta-analysis was designed, conducted and reported according to PRISMA statements [16]. Systematic literature search was conducted in PubMed and EMBASE database up to May 2016. The following searching strategy was adopted in PubMed: “Dairy Products” [Mesh] AND “Neoplasms” [Mesh] AND (“survival” OR “mortality” OR “death” OR “HR” OR “RR” OR “OR” OR “hazard ratio” OR “relative risk” OR “odds ratio”), and similar strategy was adopted in EMBASE: ‘dairy’ AND (‘neoplasms’ OR ‘neoplasia’ OR ‘cancer’ OR ‘tumor‘OR ‘tumour’) AND (‘survival’ OR ‘mortality’ OR ‘death’ OR ‘hr’ OR ‘rr’ OR ‘or’ OR ‘hazard ratio’ OR ‘relative risk’ OR ‘odds ratio’). Only publications with full texts in English were taken into consideration. To avoid potentially missing studies during the primary search, the references of pertinent articles and relevant reviews were also scanned manually. The retrieved literatures were examined in detail to exclude potential duplications or repetitive data.
Study selection
Duplicated studies were first excluded, then titles and abstracts were carefully scanned. Next full texts of potentially qualified studies were reviewed. We included studies if they met all the following criteria: (1) the studies of interest were dairy products intake; (2) the studies were population-based cohort studies and reported cancer mortality data; (3) relative risk (RR), hazard ratio (HR) or odds ratio (OR) estimates with 95 % confidence interval (CI) adjusted for multivariable factors were available or could be calculated; (4) original articles with full texts in English. Studies were excluded according to the following criteria: (1) reviews, letters, unpublished data or comments; (2) those published in languages other than English; (3) not population-based cohort studies; (4) RR, HR or OR estimates with 95 % CI were not available or could not be calculated.
Data extraction
The study quality assessment was performed according to the Newcastle-Ottawa Scale [17]. Two reviewers (Dr. Yihua Wu and Dr. Wei Lu) extracted data using a standardized data extraction table independently. Any discrepancy was resolved by a third reviewer. Information extracted from each eligible study included the following items: first author, country, original study design, number of participants, gender, age, follow-up duration, dairy product types, group cut-off value, cancer types, endpoints, adjusted factors and study quality assessment. RR, HR or OR estimates with 95 % CI with regard to different types of dairy products and doses were recorded respectively. The most completely adjusted estimate was extracted if several risk estimates were available.
Data synthesis and statistical analyses
The random-effect model was applied to calculate pooled RRs, 95 % CI and p value for heterogeneity. RRs comparing the highest intake category with the lowest intake category were combined across studies to generate the summary associations. The extent of heterogeneity across studies was examined using the I2 test [18] and I2 > 50 % together with p < 0.05 indicated significant heterogeneity. In order to validate the stability of outcomes in the meta-analysis, sensitivity analyses were performed by including studies which only reported all cancer mortality. Sequential omission of each individual study was also performed, while subgroup analyses were carried out to investigate the impact of regions, dairy product types and genders on cancer mortality. Funnel plots were constructed to assess the publication bias, meanwhile the Begg’s rank correlation test and Egger’s regression test was adopted to test the asymmetry and p < 0.1 indicated statistically significant publication bias [19].
We then looked for potential dose–response relationship between dairy products intake and cancer mortality risk using the generalized least squares(GLST) method for trend estimation of summarized data [20]. The doses reported in each study were first converted to servings/day, respectively. Kelemen’s study was excluded from dose–response analysis because dairy intakes were reported in densities (servings/1000 kcal). Bonthuis’s study was also excluded because dairy intakes were reported in g/day. The average of the lower and upper limits in each category were calculated and recorded as the mid-point dose. For open-ended intervals, we estimated the mid-point dose equaled to 1.5 times the lower limits. A potential curvilinear relationship was assessed using restricted cubic splines with four knots at fixed percentiles (5, 35, 65 and 90 %) of the distribution [20]. For model verification, we used χ 2 test and a p value for a non-linear relationship was calculated by testing the null hypothesis that the coefficient of the second spline was equal to zero. Non-linear model was applied in the first place if model verification indicated significance (p < 0.05), otherwise linear model was adopted. The dose–response curves containing RRs with 95 % CI for each dairy product type were constructed, respectively. Heterogeneity was tested using I2 test and I2 > 50 % together with p < 0.05 indicated significant heterogeneity.
All analyses were conducted using Stata software (version 13.0; StatCorp, College Station, TX, USA), and the significance level was set to p < 0.05 unless specified.
Results
Literature search
We identified 1031 publications after searching PubMed and 1625 publications in EMBASE. First of all 172 duplicated studies were removed, followed by the exclusion of 2462 studies after reviewing abstracts and titles carefully. After full-text review of the remaining 22 articles, another 11 studies were excluded for the following reasons: six articles provided insufficient data, four only reported cancer incidence risk and one conference article. References of pertinent articles and relevant reviews were also scanned manually. Finally, the remaining 11 studies [21–31] with 778,929 participants were included in the following analyses (Fig. 1).
Fig. 1.
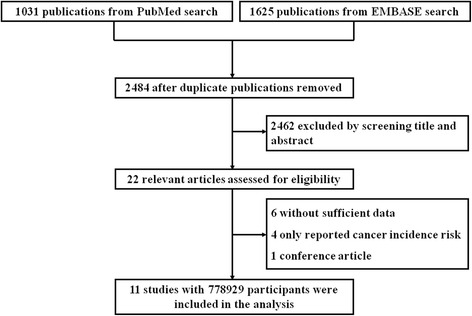
Flow diagram of the study selection process
Description of the included studies
Characteristics of the included studies were shown in Table 1. In brief, 11 studies were all population-based cohort studies, five were from America, three from Japan, one from Australia, one from Europe and one was multiethnic. However, Wang’s study and Kojima’s study were all from Japan Collaborative Cohort Study, and Wang focused on the correlation between milk consumption and all cancer mortality, while Kojima focused on the relationship between different types of dairy products consumption and colorectal cancer mortality. In addition, cancer types were various across studies. Dairy product types included total dairy, milk, yogurt, cheese, butter, whole milk and skim/low-fat milk. It was noteworthy that two studies reported prostate cancer, which was further discussed in the subgroup analyses. The quality assessment of each study was performed according to the Newcastle-Ottawa Scale, as shown in Table 2.
Table 1.
Characteristics of the included studies
| Study | Country of origin | Original design | Number of participants (Male/Female) | Age (years) | Follow-up (years) | Dairy products type | Group cut-off value |
|---|---|---|---|---|---|---|---|
| Bonthuis et al. (2010) [21] | Australia | Cohort | 663/856 | 25–78 | 14.4 | Total dairy | Mean: (163; 339; 628) g/day |
| Breslow et al. (2000) [22] | America | Cohort | 8363/11641 | 18–87 | 8.5 | Total dairy | (0–3.0; 3.0–7.0; 7.0–10.0; >10.0) servings/day |
| Chow et al. (1992) [23] | America | Cohort | 17633/0 | >35 | 20 (maximum) | Total dairy | (<46; 46–95; 96–142; >142) servings/month |
| Kelemen et al. (2005) [24] | America | Cohort | 0/29017 | 55–69 | 15 | Total dairy | Median: (1.0; 1.13; 1.24; 1.34; 1.45) servings/1000 kcal |
| Kojima et al. (2004) [25] | Japan | Cohort | 45181/62643 | 40–79 | 9.9 | Milk | (seldom; 0.5–4 servings/week; everyday) |
| Yogurt | (seldom; 1–2 servings/month; 1–7 servings/week) | ||||||
| Cheese | (seldom; 1–2 servings/month; 1–7 servings/week) | ||||||
| Butter | (seldom; 1–2 servings/month; 1–7 servings/week) | ||||||
| Matsumoto et al. (2007) [26] | Japan | Cohort | 4531/7075 | 19–93 | 9.2 | Milk, butter and yogurt | (not everyday; everyday) |
| Park et al. (2007) [27] | America | Cohort | 293888/0 | 50–71 | 6 (maximum) | Whole milk | (0; 0–0.5; 0.5–1; 1–2; > = 2) servings/day |
| Low-fat milk | (0; 0–0.5; 0.5–1; 1–2; > = 2) servings/day | ||||||
| Skim milk | (0; 0–0.5; 0.5-1; 1–2; > = 2) servings/day | ||||||
| Cheese | (<0.1; 0.1–0.25; 0.25–0.5; 0.5–0.75; > = 0.75) servings/day | ||||||
| Yogurt | (0; 0–0.5; > = 0.5) servings/day | ||||||
| Praagman et al. (2015) [28] | Europe | Cohort | 8901/25508 | 20–70 | 15 | Fermented dairy | Median: (8.8; 52.2; 128; 351) g/day |
| Yogurt | Median: (3.8; 26.2; 62.9; 144.5) g/day | ||||||
| Cheese | Median: (6.6; 19.6; 31.8; 53.2) g/day | ||||||
| Sharma et al. (2013) [29] | Multiethnic | Cohort | 70333/76056 | 45–75 | NA | Total dairy | (<=0.5; 0.6–1.0; 1.1–1.6; >1.6) servings/day |
| Song et al. (2013) [30] | America | Cohort | 21660/0 | 40–84 | 28 (maximum) | Total dairy | (<=0.5; 0.5–1.0; 1.0–1.5; 1.5–2.5; >2.5) servings/day |
| Whole milk | (<=1; 2–6; > = 7) servings/week | ||||||
| Skim/low-fat milk | (<=1; 2–6; > = 7) servings/week | ||||||
| Wang et al. (2015) [31] | Japan | Cohort | 39639/55341 | 40–79 | 19 | Milk | (0; 1–2 servings/month; 1–2 servings/week; 3–4 servings/week; everyday) |
| Study | Cancer type | Endpoints | Adjusted factors | Quality assessment | |||
| Bonthuis et al. (2010) [21] | All cancer | All cancer death | Age, sex, total energy intake, body mass index, alcohol intake, school leaving age, physical activity level, pack years of smoking, dietary supplement use, b-carotene treatment during trial and presence of any medical condition | 9 | |||
| Breslow et al. (2000) [22] | Lung cancer | Lung cancer death | Age, sex, smoking duration and packs per day smoked | 8 | |||
| Chow et al. (1992) [23] | Lung cancer | Lung cancer death | Age, smoking status and industry/occupation | 8 | |||
| Kelemen et al. (2005) [24] | All cancer | All cancer death | Age, total energy, carbohydrate, saturated fat, polyunsaturated fat, monounsaturated fat, trans-fat total fiber, dietary cholesterol, dietary methionine, alcohol, smoking, activity level, body mass index, history of hypertension, postmenopausal hormone use, multivitamin use, vitamin E supplement use, education and family history of cancer | 6 | |||
| Kojima et al. (2004) [25] | Colon and rectal cancer | Colon and rectal cancer death | Age, family history of colorectal cancer, body mass index, frequency of alcohol intake, current smoking status, walking time per day, and educational level | 9 | |||
| Matsumoto et al. (2007) [26] | Colon, stomach, lung, liver, pancreatic, bile duct and blood cancer | Colon, stomach, lung, liver, pancreatic, bile duct and blood cancer death | Age and sex | 9 | |||
| Park et al. (2007) [27] | Prostate cancer | Prostate cancer death and advanced prostate cancer | Age, race, education, marital status, body mass index, vigorous physical activity, smoking, alcohol consumption, history of diabetes, family history of prostate cancer, screening for prostate cancer by use of prostate-specific antigen, intakes of tomatoes, red meat, fish, vitamin E, alpha-linolenic acid and total energy | 8 | |||
| Praagman et al. (2015) [28] | All cancer | All cancer death | Age, sex, total energy intake, smoking habit, body mass index, physical activity, education level, hypertension at baseline, intakes of alcohol and energy-adjusted intakes of fruit and vegetables | 9 | |||
| Sharma et al. (2013) [29] | All cancer | All cancer death | Time on study, years of education, energy intake, smoking behaviors, body mass index, physical activity, history of diabetes, alcohol intake, history of hormone replacement therapy, and history of oophorectomy | 8 | |||
| Song et al. (2013) [30] | Prostate cancer | Prostate cancer death | Age, cigarette smoking, vigorous exercise, alcohol intake, race, body mass index, baseline diabetes status, red meat consumption, total energy intake from recorded food items, assignment in the original aspirin trial and assignment in the original β-carotene trial. In addition, the models for whole milk and skim/low-fat milk were mutually adjusted for each other | 8 | |||
| Wang et al. (2015) [31] | All cancer | All cancer death | Age categories, smoking status, drinking status, physical activity, sleeping duration, body mass index, education level, participation in health checkups, green-leafy vegetable intake, and history of hypertension, diabetes and liver disease | 9 |
Table 2.
Quality assessment according to Newcastle-Ottawa Scale
| Study | Q1 | Q2 | Q3 | Q4 | Q5 | Q6 | Q7 | Q8 | Total |
|---|---|---|---|---|---|---|---|---|---|
| Bonthuis et al. (2010) [21] | 1 | 1 | 1 | 1 | 2 | 1 | 1 | 1 | 9 |
| Breslow et al. (2000) [22] | 1 | 1 | 1 | 1 | 2 | 1 | 1 | 0 | 8 |
| Chow et al. (1992) [23] | 1 | 1 | 1 | 1 | 2 | 0 | 1 | 1 | 8 |
| Kelemen et al. (2005) [24] | 0 | 1 | 1 | 1 | 2 | 0 | 1 | 0 | 6 |
| Kojima et al. (2004) [25] | 1 | 1 | 1 | 1 | 2 | 1 | 1 | 1 | 9 |
| Matsumoto et al. (2007) [26] | 1 | 1 | 1 | 1 | 2 | 1 | 1 | 1 | 9 |
| Park et al. (2007) [27] | 1 | 1 | 1 | 1 | 2 | 1 | 1 | 0 | 8 |
| Praagman et al. (2015) [28] | 1 | 1 | 1 | 1 | 2 | 1 | 1 | 1 | 9 |
| Sharma et al. (2013) [29] | 1 | 1 | 1 | 1 | 2 | 1 | 1 | 0 | 8 |
| Song et al. (2013) [30] | 0 | 1 | 1 | 1 | 2 | 1 | 1 | 1 | 8 |
| Wang et al. (2015) [31] | 1 | 1 | 1 | 1 | 2 | 1 | 1 | 1 | 9 |
Association between total dairy products intake and cancer mortality risk
In each individual study, RRs of the highest total dairy products intake group versus the control group were introduced. For the association between total dairy products intake and all cancer mortality, ten studies except Kojima’ study were included and the pooled RR was 0.99 (95 % CI 0.92–1.07, p = 0.893), as shown in Fig. 2a. No significant heterogeneity across studies was observed (I2 = 39.8 %, p = 0.092). Begg’s funnel plot and the Egger’s linear regression test were conducted to evaluate publication bias. The shape of Begg’s funnel plot showed no evident asymmetry (Fig. 2b), beyond that Egger’s test also suggested no publication bias existed (p = 0.947).
Fig. 2.
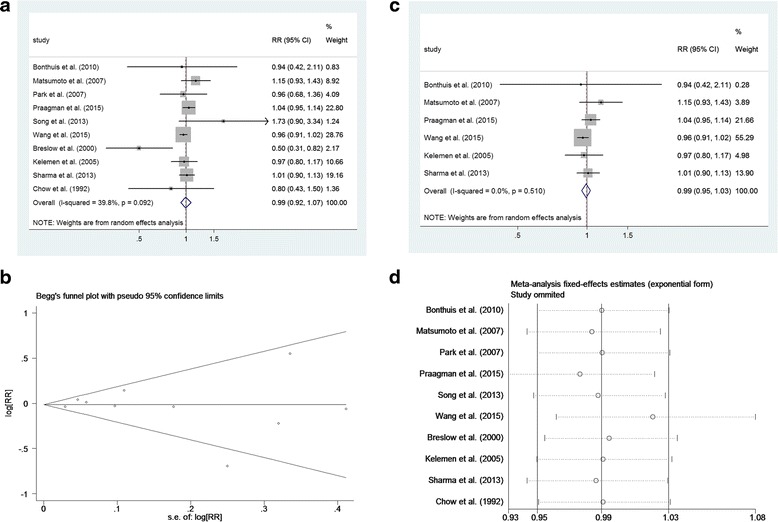
Total dairy intake and cancer mortality risk. a Forest plot of total studies evaluating relative risk of cancer mortality. b Begg’s funnel plot of total studies evaluating potential publication bias. c Sensitivity analysis was performed by including studies which only reported all cancer mortality. d Sequential omission of each individual study
Sensitivity analyses were performed by including studies which only reported all cancer mortality (Fig. 2c), and the pooled RR was 0.99 (95 % CI 0.95–1.03, p = 0.679). Sequential omission of each individual study was also performed, as shown in Fig. 2d, the result pattern was not changed by removing single study each time.
Subgroup analyses
Subgroup analyses were conducted according to different regions, dairy product types and genders. Initially, regions were categorized into America, countries other than America and Asia when we explored the association between total dairy intake and cancer mortality risk. We found the pooled RRs were 0.90 (95 % CI 0.67–1.21, p = 0.484) in America, 1.00 (95 % CI 0.95–1.04, p = 0.834) in countries other than America and 0.97 (95 % CI 0.92–1.02, p = 0.239) in Asia, which was in consistent with the above results.
Dairy product types were then categorized into milk, yogurt, cheese, butter, whole milk and skim/low-fat milk. In both genders, the pooled RRs were 0.97 (95 % CI 0.92–1.03, p = 0.314) for milk, 0.88 (95 % CI 0.71–1.10, p = 0.271) for yogurt, 1.23 (95 % CI 0.94–1.61, p = 0.127) for cheese and 1.13 (95 % CI 0.89–1.44, p = 0.317) for butter, proving that intake of these dairy products was not associated with cancer mortality risk significantly (Table 3). However, it was interesting to find that whole milk intake contributed to elevated cancer mortality risk significantly, with the pooled RR of 1.50 (95 % CI 1.03–2.17, p = 0.032), which was only limited to prostate cancer. In accordance with this finding, skim/low-fat milk intake was not associated with prostate mortality risk, with the pooled RR of 1.00 (95 % CI 0.75–1.33, p = 0.985).
Table 3.
Subgroup analyses according to different dairy product types and genders
| Male and female | Male | Female | ||||||||||
|---|---|---|---|---|---|---|---|---|---|---|---|---|
| RR | 95 % CI | Heterogeneity | RR | 95 % CI | Heterogeneity | RR | 95 % CI | Heterogeneity | ||||
| I2 (%) | p | I2 (%) | p | I2 (%) | p | |||||||
| Total dairy | 0.99 | (0.92, 1.07) | 39.8 | 0.092 | 1.00 | (0.91, 1.11) | 0.0 | 0.422 | 1.07 | (0.96, 1.19) | 0.0 | 0.393 |
| Milk | 0.97 | (0.92, 1.03) | 8.4 | 0.351 | 0.95 | (0.89, 1.03) | 35.1 | 0.214 | NA | NA | NA | NA |
| Yogurt | 0.88 | (0.71, 1.10) | 0.0 | 0.521 | 0.66 | (0.42, 1.04) | 0.0 | 0.757 | NA | NA | NA | NA |
| Cheese | 1.23 | (0.94, 1.61) | 0.0 | 0.985 | 1.19 | (0.85, 1.67) | 0.0 | 0.912 | NA | NA | NA | NA |
| Butter | 1.13 | (0.89, 1.44) | 1.0 | 0.315 | NA | NA | NA | NA | NA | NA | NA | NA |
| Whole milka | NA | NA | NA | NA | 1.50 | (1.03, 2.17) | 0.0 | 0.963 | NA | NA | NA | NA |
| Skim/low-fat milka | NA | NA | NA | NA | 1.00 | (0.75, 1.33) | 0.0 | 0.735 | NA | NA | NA | NA |
Dose–response analyses
To begin with, the non-linear model between total dairy products intake and cancer mortality risk was constructed and χ 2 test was used for model significance verification, which revealed the existence of a non-linear association between them (χ 2 = 8.98, p = 0.030). The dose–response curves containing RRs with 95 % CI and doses were constructed (Fig. 3a), suggesting that low total dairy products intake may be protective against cancer related death, but high total dairy products intake did not have the same effect.
Fig. 3.
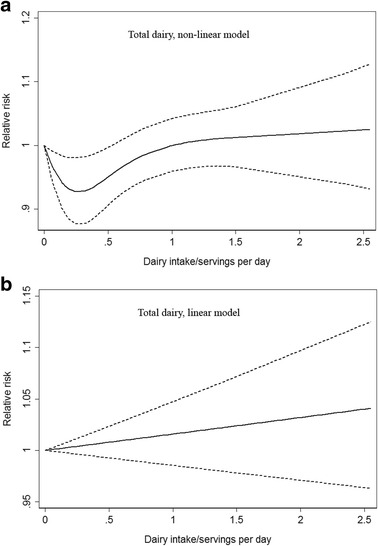
a Non-linear and (b) linear dose–response analyses for total dairy products intake and cancer mortality risk. Full lines represented RRs and dashed lines represented 95 % CIs
For each dairy type, we adopted the linear model as well to assess RR due to increase of dairy products, which indicated that increase of total dairy, milk, yogurt, cheese, butter or skim/low-fat milk (serving/day) was not associated with elevated cancer mortality risk (Figs. 3b and 4 and Table 4). Nevertheless increase of whole milk (serving/day) contributed to elevated prostate cancer mortality risk significantly, with the RR of 1.43 (95 % CI 1.13–1.81, p = 0.003), which was in consistent with the previous subgroup analyses results.
Fig. 4.

Linear dose–response analyses for (a) milk, (b) yogurt, (c) cheese, (d) butter, (e) whole milk and (f) skim/low-fat milk intake and cancer mortality risk. Full lines represented RRs and dashed lines represented 95 % CIs
Table 4.
Dose–response analyses using the generalized least squares (GLST) method by adopting the linear model
| Male and female | Male | Female | ||||||||||
|---|---|---|---|---|---|---|---|---|---|---|---|---|
| RR per serving increase | 95 % CI | Heterogeneity | RR per serving increase | 95 % CI | Heterogeneity | RR per serving increase | 95 % CI | Heterogeneity | ||||
| I2 (%) | p | I2 (%) | p | I2 (%) | p | |||||||
| Total dairy | 1.02 | (0.99, 1.05) | 33.8 | 0.334 | 1.00 | (0.97, 1.04) | 16.7 | 0.405 | 1.04 | (0.99, 1.10) | 7.7 | 0.564 |
| Milk | 1.03 | (0.99, 1.08) | 10.2 | 0.512 | 1.02 | (0.97, 1.08) | 8.7 | 0.275 | 1.05 | (0.96, 1.14) | 1.2 | 0.559 |
| Yogurt | 0.94 | (0.59, 1.48) | 5.1 | 0.409 | 0.60 | (0.29, 1.26) | 2.4 | 0.297 | 1.10 | (0.51, 2.37) | 0.1 | 0.715 |
| Cheese | 1.36 | (0.90, 2.05) | 5.3 | 0.260 | 1.23 | (0.76, 1.99) | 0.4 | 0.823 | 1.75 | (0.79, 3.88) | 4.3 | 0.037 |
| Butter | 1.22 | (0.87, 1.73) | 1.2 | 0.873 | 0.90 | (0.45, 1.80) | 0.1 | 0.738 | 1.27 | (0.60, 2.71) | 0.1 | 0.778 |
| Whole milka | NA | NA | NA | NA | 1.43 | (1.13, 1.81) | 7.3 | 0.200 | NA | NA | NA | NA |
| Skim/low-fat milka | NA | NA | NA | NA | 1.07 | (0.95, 1.20) | 0.3 | 0.877 | NA | NA | NA | NA |
Discussion
Since dairy products contain complex nutrient composition and the amount of dairy products consumption is huge in our daily life, a number of studies have pointed out that dairy products may have impact on health issues such as obesity [32], diabetes [33, 34], cancers [10] and coronary heart disease [35, 36]. However, whether dairy products play a beneficial or detrimental role still remained controversial, largely depending on the types of dairy products and diseases. In view of this, we carried out this meta-analysis to comprehensively explore the association between dairy products intake and cancer mortality risk.
The current analyses showed that higher total dairy, milk, yogurt, butter and skim/low-fat milk intake was not associated with increased cancer mortality risk, while exposure to highest dose of whole milk intake increased about 50 % of prostate cancer mortality risk. By constructing a non-linear dose–response model, we concluded that low total dairy products intake may be protective against cancer related death, however high dose of total dairy products did not have the protective effect. Through a linear dose–response model, we found that increase of whole milk (serving/day) contributed to elevated prostate cancer mortality risk significantly, while other dairy types did not show the same effect. This might be explained by the hypothesis that luxuriant calcium contained in whole milk would increase the risk of prostate cancer by inhibiting the potential anti prostate carcinogenic nutrient 1,25-dihydroxyvitamin D [37]. Besides, high animal fat intake also contributed to poor prostate cancer mortality after diagnosis [38, 39]. However, although our meta-analysis shed new light on this issue, more future work remained to be done due to complex components of dairy products.
Our study had several crucial strengths. We conducted this thorough systematic search and applied comprehensive analytical approaches to assess the association between dairy products intake and cancer mortality risk. In addition, the studies we included were all population-based cohort studies of high quality. Furthermore, sensitivity analyses and sufficient subgroup analyses were also conducted to ensure the reliability of this study. Finally, we used a non-linear or linear model to fit the dose–response relationship between dairy products intake and cancer mortality risk. The methods of this study were rigorous and were based on guidelines for conducting the present study.
However, the current study was restricted by several limitations. First, the number of studies involved was relatively small, partly because cancer incidence risk rather than mortality risk was much more widely reported, thus the association between each type of dairy products and every specific cancer mortality risk was not available because of inadequate data. Second, most of the included studies were performed in Asia or America, and the studies conducted in America did not confine their cohorts to certain ethnic groups, hence the conclusions should be taken cautiously for other ethnic populations. We suggested further population-based cohort studies which investigate the association between dairy products intake and cancer mortality in each individual ethnic should be conducted. Finally a few studies reported different doses of highest dairy intake, which was further discussed in the dose–response analysis.
Conclusions
On the basis of the results above, we confirmed that total dairy products intake was not associated with increased cancer mortality risk in both genders, yet low total dairy products intake even reduced relative risk based on the dose–response analyses. However, whole milk intake in men contributed to elevated prostate cancer mortality risk. Furthermore, the linear dose–response relationship existed between increase of whole milk intake and prostate cancer mortality risk.
Acknowledgements
Not applicable.
Funding
There was no funding supporting this work.
Availability of data and material
All the data in this meta-analysis are from published cohort studies and we take responsibilities for the data integration process and the accuracy of the statistical analyses process.
Authors’ contributions
YW and DX had the right to grant on behalf of all the authors and did grant on behalf of all authors. WL and HC contributed to the conception and design of the study; WL, YN, HW and HC contributed to the search strategy, data extraction, statistical analyses and manuscript preparation. All the authors have commented on drafts of the paper and have approved the final draft of the manuscript.
Competing interests
The authors declare that they have no competing interests.
Consent for publication
The paper did not contain any individual persons’ data thus consent for publication was not applicable.
Ethics approval and consent to participate
Ethical approval and consent to participate is not required for this study.
Abbreviations
CI
Confidence interval
GLST
Generalized least squares
HR
Hazard ratio
OR
Odds ratio
RR
Relative risk
Contributor Information
Wei Lu, Email: 3120101767@zju.edu.cn.
Hanwen Chen, Email: 3120000365@zju.edu.cn.
Yuequn Niu, Email: nnnyyq@163.com.
Han Wu, Email: zdwuhan@aliyun.com.
Dajing Xia, Email: dxia@zju.edu.cn.
Yihua Wu, Email: georgewuer@126.com.
References
- 1.Nicklas TA, O'Neil CE, Fulgoni VL., III The role of dairy in meeting the recommendations for shortfall nutrients in the American diet. J Am Coll Nutr. 2009;28:73S–81. doi: 10.1080/07315724.2009.10719807. [DOI] [PubMed] [Google Scholar]
- 2.Yoshiike N, Matsumura Y, Iwaya M, Sugiyama M, Yamaguchi M. National nutrition survey in Japan. J Epidemiol. 1996;6:189–200. doi: 10.2188/jea.6.3sup_189. [DOI] [PubMed] [Google Scholar]
- 3.Tellez A, Corredig M, Brovko LY, Griffiths MW. Characterization of immune-active peptides obtained from milk fermented by Lactobacillus helveticus. J Dairy Res. 2010;77:129–36. doi: 10.1017/S002202990999046X. [DOI] [PubMed] [Google Scholar]
- 4.Pepe G, Tenore GC, Mastrocinque R, Stusio P, Campiglia P. Potential anticarcinogenic peptides from bovine milk. J Amino Acids. 2013;2013:939804. doi: 10.1155/2013/939804. [DOI] [PMC free article] [PubMed] [Google Scholar]
- 5.Ronis MJ, Hakkak R, Korourian S, Badger TM. Whey protein hydrolysate but not whole whey protein protects against 7,12-dimethylbenz(a)anthracene-induced mammary tumors in rats. Nutr Cancer. 2015;67:949–53. doi: 10.1080/01635581.2015.1055370. [DOI] [PubMed] [Google Scholar]
- 6.Park SW, Kim JY, Kim YS, Lee SJ, Lee SD, Chung MK. A milk protein, casein, as a proliferation promoting factor in prostate cancer cells. World J Mens Health. 2014;32:76–82. doi: 10.5534/wjmh.2014.32.2.76. [DOI] [PMC free article] [PubMed] [Google Scholar]
- 7.Kroenke CH, Kwan ML, Sweeney C, Castillo A, Caan BJ. High- and low-fat dairy intake, recurrence, and mortality after breast cancer diagnosis. J Natl Cancer Inst. 2013;105:616–23. doi: 10.1093/jnci/djt027. [DOI] [PMC free article] [PubMed] [Google Scholar]
- 8.Yang M, Kenfield SA, Van Blarigan EL, Wilson KM, Batista JL, Sesso HD, Ma J, Stampfer MJ, Chavarro JE. Dairy intake after prostate cancer diagnosis in relation to disease-specific and total mortality. Int J Cancer. 2015;137:2462–9. doi: 10.1002/ijc.29608. [DOI] [PMC free article] [PubMed] [Google Scholar]
- 9.Huncharek M, Muscat J, Kupelnick B. Colorectal cancer risk and dietary intake of calcium, vitamin D, and dairy products: a meta-analysis of 26,335 cases from 60 observational studies. Nutr Cancer. 2009;61:47–69. doi: 10.1080/01635580802395733. [DOI] [PubMed] [Google Scholar]
- 10.Faber MT, Jensen A, Sogaard M, Hogdall E, Hogdall C, Blaakaer J, Kjaer SK. Use of dairy products, lactose, and calcium and risk of ovarian cancer - results from a Danish case–control study. Acta Oncol. 2012;51:454–64. doi: 10.3109/0284186X.2011.636754. [DOI] [PubMed] [Google Scholar]
- 11.Aune D, Lau R, Chan DS, Vieira R, Greenwood DC, Kampman E, Norat T. Dairy products and colorectal cancer risk: a systematic review and meta-analysis of cohort studies. Ann Oncol. 2012;23:37–45. doi: 10.1093/annonc/mdr269. [DOI] [PubMed] [Google Scholar]
- 12.Aune D, Navarro Rosenblatt DA, Chan DS, Vieira AR, Vieira R, Greenwood DC, Vatten LJ, Norat T. Dairy products, calcium, and prostate cancer risk: a systematic review and meta-analysis of cohort studies. Am J Clin Nutr. 2015;101:87–117. doi: 10.3945/ajcn.113.067157. [DOI] [PubMed] [Google Scholar]
- 13.Genkinger JM, Wang M, Li R, Albanes D, Anderson KE, Bernstein L, van den Brandt PA, English DR, Freudenheim JL, Fuchs CS, et al. Dairy products and pancreatic cancer risk: a pooled analysis of 14 cohort studies. Ann Oncol. 2014;25:1106–15. doi: 10.1093/annonc/mdu019. [DOI] [PMC free article] [PubMed] [Google Scholar]
- 14.Sun Y, Lin LJ, Sang LX, Dai C, Jiang M, Zheng CQ. Dairy product consumption and gastric cancer risk: a meta-analysis. World J Gastroenterol. 2014;20:15879–98. doi: 10.3748/wjg.v20.i42.15879. [DOI] [PMC free article] [PubMed] [Google Scholar]
- 15.Qin LQ, Xu JY, Wang PY, Hashi A, Hoshi K, Sato A. Milk/dairy products consumption, galactose metabolism and ovarian cancer: meta-analysis of epidemiological studies. Eur J Cancer Prev. 2005;14:13–9. doi: 10.1097/00008469-200502000-00003. [DOI] [PubMed] [Google Scholar]
- 16.Moher D, Liberati A, Tetzlaff J, Altman DG. Preferred reporting items for systematic reviews and meta-analyses: the PRISMA statement. Int J Surg. 2010;8:336–41. doi: 10.1016/j.ijsu.2010.02.007. [DOI] [PubMed] [Google Scholar]
- 17.Stang A. Critical evaluation of the Newcastle-Ottawa scale for the assessment of the quality of nonrandomized studies in meta-analyses. Eur J Epidemiol. 2010;25:603–5. doi: 10.1007/s10654-010-9491-z. [DOI] [PubMed] [Google Scholar]
- 18.Higgins JP, Thompson SG. Quantifying heterogeneity in a meta-analysis. Stat Med. 2002;21:1539–58. doi: 10.1002/sim.1186. [DOI] [PubMed] [Google Scholar]
- 19.Egger M, Davey Smith G, Schneider M, Minder C. Bias in meta-analysis detected by a simple, graphical test. BMJ. 1997;315:629–34. doi: 10.1136/bmj.315.7109.629. [DOI] [PMC free article] [PubMed] [Google Scholar]
- 20.Orsini N, Li R, Wolk A, Khudyakov P, Spiegelman D. Meta-analysis for linear and nonlinear dose–response relations: examples, an evaluation of approximations, and software. Am J Epidemiol. 2012;175:66–73. doi: 10.1093/aje/kwr265. [DOI] [PMC free article] [PubMed] [Google Scholar]
- 21.Bonthuis M, Hughes MCB, Ibiebele TI, Green AC, Van Der Pols JC. Dairy consumption and patterns of mortality of Australian adults. Eur J Clin Nutr. 2010;64:569–77. doi: 10.1038/ejcn.2010.45. [DOI] [PubMed] [Google Scholar]
- 22.Breslow RA, Graubard BI, Sinha R, Subar AF. Diet and lung cancer mortality: a 1987 National Health Interview Survey cohort study. Cancer Causes Control. 2000;11:419–31. doi: 10.1023/A:1008996208313. [DOI] [PubMed] [Google Scholar]
- 23.Chow WH, Schuman LM, McLaughlin JK, Bjelke E, Gridley G, Wacholder S, Chien HT, Blot WJ. A cohort study of tobacco use, diet, occupation, and lung cancer mortality. Cancer Causes Control. 1992;3:247–54. doi: 10.1007/BF00124258. [DOI] [PubMed] [Google Scholar]
- 24.Kelemen LE, Kushi LH, Jacobs DR, Jr, Cerhan JR. Associations of dietary protein with disease and mortality in a prospective study of postmenopausal women. Am J Epidemiol. 2005;161:239–49. doi: 10.1093/aje/kwi038. [DOI] [PubMed] [Google Scholar]
- 25.Kojima M, Wakai K, Tamakoshi K, Tokudome S, Toyoshima H, Watanabe Y, Hayakawa N, Suzuki K, Hashimoto S, Ito Y, Tamakoshi A. Diet and colorectal cancer mortality: results from the Japan Collaborative Cohort Study. Nutr Cancer. 2004;50:23–32. doi: 10.1207/s15327914nc5001_4. [DOI] [PubMed] [Google Scholar]
- 26.Matsumoto M, Ishikawa S, Nakamura Y, Kayaba K, Kajii E. Consumption of dairy products and cancer risks. J Epidemiol. 2007;17:38–44. doi: 10.2188/jea.17.38. [DOI] [PMC free article] [PubMed] [Google Scholar]
- 27.Park Y, Mitrou PN, Kipnis V, Hollenbeck A, Schatzkin A, Leitzmann MF. Calcium, dairy foods, and risk of incident and fatal prostate cancer: the NIH-AARP Diet and Health Study. Am J Epidemiol. 2007;166:1270–9. doi: 10.1093/aje/kwm268. [DOI] [PubMed] [Google Scholar]
- 28.Praagman J, Dalmeijer GW, van der Schouw YT, Soedamah-Muthu SS, Monique Verschuren WM, Bas Bueno-de-Mesquita H, Geleijnse JM, Beulens JW. The relationship between fermented food intake and mortality risk in the European Prospective Investigation into Cancer and Nutrition-Netherlands cohort. Br J Nutr. 2015;113:498–506. doi: 10.1017/S0007114514003766. [DOI] [PubMed] [Google Scholar]
- 29.Sharma S, Vik S, Pakseresht M, Shen L, Kolonel LN. Diet impacts mortality from cancer: results from the multiethnic cohort study. Cancer Causes Control. 2013;24:685–93. doi: 10.1007/s10552-013-0148-6. [DOI] [PMC free article] [PubMed] [Google Scholar]
- 30.Song Y, Chavarro JE, Cao Y, Qiu W, Mucci L, Sesso HD, Stampfer MJ, Giovannucci E, Pollak M, Liu S, Ma J. Whole milk intake is associated with prostate cancer-specific mortality among U.S. male physicians. J Nutr. 2013;143:189–96. doi: 10.3945/jn.112.168484. [DOI] [PMC free article] [PubMed] [Google Scholar]
- 31.Wang C, Yatsuya H, Tamakoshi K, Iso H, Tamakoshi A. Milk drinking and mortality: findings from the Japan collaborative cohort study. J Epidemiol. 2015;25:66–73. doi: 10.2188/jea.JE20140081. [DOI] [PMC free article] [PubMed] [Google Scholar]
- 32.O’Sullivan TA, Bremner AP, Bremer HK, Seares ME, Beilin LJ, Mori TA, Lyons-Wall P, Devine A, Oddy WH. Dairy product consumption, dietary nutrient and energy density and associations with obesity in Australian adolescents. J Hum Nutr Diet. 2015;28:452–64. doi: 10.1111/jhn.12264. [DOI] [PubMed] [Google Scholar]
- 33.O’Connor LM, Lentjes MA, Luben RN, Khaw KT, Wareham NJ, Forouhi NG. Dietary dairy product intake and incident type 2 diabetes: a prospective study using dietary data from a 7-day food diary. Diabetologia. 2014;57:909–17. doi: 10.1007/s00125-014-3176-1. [DOI] [PMC free article] [PubMed] [Google Scholar]
- 34.Zong G, Sun Q, Yu D, Zhu J, Sun L, Ye X, Li H, Jin Q, Zheng H, Hu FB, Lin X. Dairy consumption, type 2 diabetes, and changes in cardiometabolic traits: a prospective cohort study of middle-aged and older Chinese in Beijing and Shanghai. Diabetes Care. 2014;37:56–63. doi: 10.2337/dc13-0975. [DOI] [PubMed] [Google Scholar]
- 35.Dalmeijer GW, Struijk EA, van der Schouw YT, Soedamah-Muthu SS, Verschuren WM, Boer JM, Geleijnse JM, Beulens JW. Dairy intake and coronary heart disease or stroke--a population-based cohort study. Int J Cardiol. 2013;167:925–9. doi: 10.1016/j.ijcard.2012.03.094. [DOI] [PubMed] [Google Scholar]
- 36.Praagman J, Franco OH, Ikram MA, Soedamah-Muthu SS, Engberink MF, van Rooij FJ, Hofman A, Geleijnse JM. Dairy products and the risk of stroke and coronary heart disease: the Rotterdam Study. Eur J Nutr. 2015;54:981–90. doi: 10.1007/s00394-014-0774-0. [DOI] [PubMed] [Google Scholar]
- 37.Giovannucci E. Dietary influences of 1,25(OH)2 vitamin D in relation to prostate cancer: a hypothesis. Cancer Causes Control. 1998;9:567–82. doi: 10.1023/A:1008835903714. [DOI] [PubMed] [Google Scholar]
- 38.Richman EL, Kenfield SA, Chavarro JE, Stampfer MJ, Giovannucci EL, Willett WC, Chan JM. Fat intake after diagnosis and risk of lethal prostate cancer and all-cause mortality. JAMA Intern Med. 2013;173:1318–26. doi: 10.1001/jamainternmed.2013.6536. [DOI] [PMC free article] [PubMed] [Google Scholar]
- 39.Van Blarigan EL, Kenfield SA, Yang M, Sesso HD, Ma J, Stampfer MJ, Chan JM, Chavarro JE. Fat intake after prostate cancer diagnosis and mortality in the Physicians’ Health Study. Cancer Causes Control. 2015;26:1117–26. doi: 10.1007/s10552-015-0606-4. [DOI] [PMC free article] [PubMed] [Google Scholar]