Negative T Wave in Ischemic Heart Disease: A Consensus Article (original) (raw)
Abstract
Background
For many years was considered that negative T wave in ischemic heart disease represents ischemia and for many authors located in subepicardial area.
Methods
We performed a review based in the literature and in the experience of the authors commenting the real significance of the presence of negative T wave in patients with ischemic heart disease.
Results
The negative T wave may be of primary or secondary type. Negative T wave observed in ischemic heart disease are of primary origin, therefore not a consequence of abnormal repolarization pattern. The negative T wave of ischemic origin presents the following characteristics: (1) are symmetrical and of variable deepness; (2) present mirror patterns; (3) starts in the second part of repolarization; and (4) may be accompanied by positive or negative U wave. The negative T wave of ischemic origin may be seen in the following clinical settings: (1) postmyocardial infarction due to a window effect of necrotic zone and (2) as a consequence of reperfusion in case of aborted MI when the artery has opened spontaneously, or after fibrinolysis, PCI, or coronary spasm.
Conclusion
Acute ongoing ischemia do not cause negative T wave. This pattern appears when the ongoing ischemia is vanishing or in the chronic phase. In all these cases the cause of negative T wave is not located in the subepicardial area. Furthermore, positive exercise testing is expressed by ST depression never by isolated negative T wave. There are many circumstances that may present negative T wave outside ischemic heart disease and that have been discussed in this paper.
Keywords: electrocardiography, ischemic heart disease, negative T wave
The negative T wave of ischemic origin may be seen in the following clinical settings: (1) postmyo‐cardial infarction and (2) as a consequence of reperfusion in case of aborted myocardial infarction (MI) when the artery has opened spontaneously or after fibrinolysis or PCI or coronary spasm.
Acute ongoing ischemia do not cause negative T wave. This pattern appears when the ongoing ischemia is vanishing. Furthermore, positive exercise testing is expressed by ST depression never by isolated negative T wave.
There are many circumstances that may present negative T wave outside ischemia heart disease and that will be discussed in this article.
ELECTROPHYSIOLOGY OF NORMAL T WAVE
In normal conditions, the R and T wave have the same polarity. The T wave in human beings is usually positive except in aVR and often in V1. Occasionally, T‐wave inversion is also seen in leads V2 and/or III.
This concordance may be explained by the presence of transmural gradient of repolarization, with earlier repolarization occurring at the epicardium.1, 2, 3, 4, 5, 6, 7, 8, 9, 10, 11 Two theories may explain this phenomenon. According to the dipole (vector) theory, the ECG curve represents the sum of depolarization and repolarization of all the left ventricle. The process of repolarization proceeds from the subepicardium to the subendocardium, like the lights of a car going backwards, and due to that the wave of repolarization, the T wave, in normal human beings is recorded as positive on the surface ECG, because the electrode faces always the positive part of the dipole.
Another theory gives an alternative explanation for the positivity of the T waves in the presence of R wave in the normal heart, because the ECG is the sum of subendocardial and subepicardial transmembrane action potential (AP). Normally, (Fig. 1) the endocardial AP depolarizes before the epicardial AP, but since the duration of the epicardial AP is shorter, repolarization of the endocardial AP occurs later. As the activation process starts first in the subendocardium (depolarization), and ends later also in the subendocardium (repolarization), the sum of both AP explains that both processes, depolarization (R) and repolarization (T), being positives (Fig. 2). This theory is also valid if we consider, as has been demonstrated by Antzelevitch's group,8 that in the M cells area (between epicardium and endocardium) has the longest AP, even longer than the AP of subendocardium.
Figure 1.
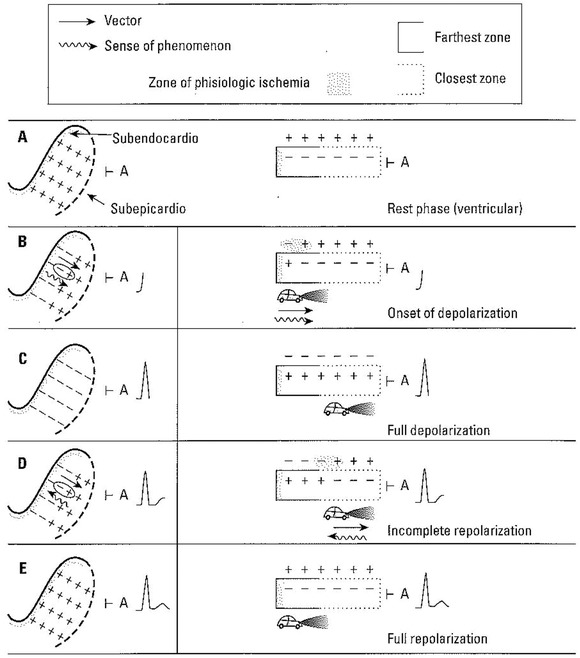
Diagram of the depolarization (QRS) and repolarization (T) morphologies in the normal human heart. The figures to the left show a view of the free left ventricular wall from above, and we see only the distribution of the charges on the external surface of this “enormous left ventricular cell.” In the right column we see a lateral view in which the changes in the electrical charges can be appreciated. With electrode A in the epicardium, a normal ECG curve is recorded.
Figure 2.
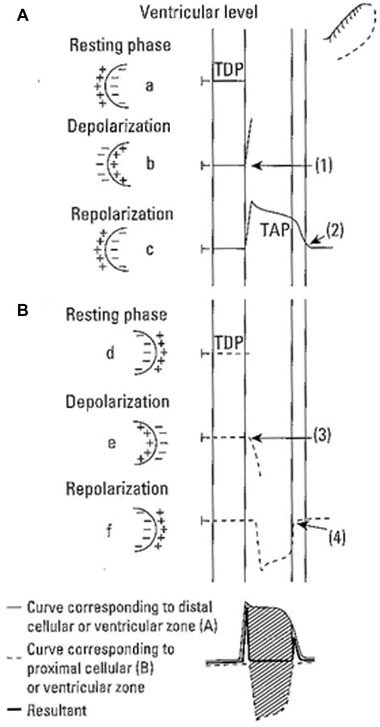
At ventricular level, the sum of the transmembrane action potential (TAP) from the area distal (A) to the electrode and the TAP from the area proximal (B) to the electrode originates the human (ventricular) ECG with positive T waves. TDP = transmembrane diastolic potential.
ECG CHANGES IN CASE OF ISCHEMIA DUE TO EXPERIMENTAL OCCLUSION OF A CORONARY ARTERY
Since the early days of electrocardiography many studies have been published reporting the ECG changes after occlusion of a coronary artery.12, 13, 14, 15, 16 In the 1940s, Bailey13 conducted an open chest experiment in dogs, occluding the left anterior descending (LAD) coronary artery. The ECG was recorded with the electrodes located on the pericardial sac. It was found (Fig. 3) that the first ECG change in the area with induced ischemia was that the positive T waves at baseline became negative. This was called an ECG pattern of ischemia. If the ischemia persisted, it was followed by an ST elevation that was named an ECG pattern of injury. Finally, a Q wave appeared when the tissue becomes necrotic, and this was called ECG pattern of necrosis. For many years, this terminology has been accepted by many groups17, 18, 19, 20, 21, 22, 23 and used in the clinical practice. It was considered, that in patients with ischemic heart disease (IHD), the presence of a negative T wave represents a grade of ischemia that is less severe and/or persistent than an ST segment elevation pattern.
Figure 3.
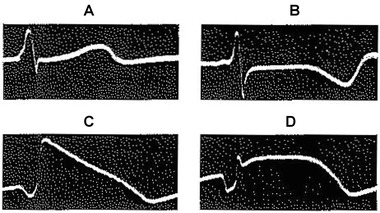
Recording in the case of experimental occlusion of left anterior descending (LAD) coronary artery in a dog with open heart. (A) Control. (B) ECG pattern of ischemia (negative T wave). (C) ECG pattern of injury (ST segment elevation). (D) Appearance of ECG pattern of necrosis (Q wave; Adapted with permission from Bailey et al. 1943)
Later on, in the 1950s, Lengyel et al.15 found that when the experimental occlusion of LAD was performed in awake dogs with a closed chest, and the ECG was recorded with an external surface 12‐lead device, the changes in the ECG (Fig. 4) were very different and similar to those that occurred in humans during transmural MI. The first change was an increase of the amplitude of T wave followed by ST elevation, and finally the appearance of Q wave with T‐wave inversion. Therefore, negative T wave only appears as a late manifestation, when the acute ischemia already has evolved to transmural infarction. Therefore currently, we consider that negative T wave do not appear during the hyperacute phase of ongoing ischemia (unless preceded by ST depression), when the patient experiences active symptoms. It is a late manifestation of previous ischemia, as a devastated panoramic view that may be seen after a “tsunami” (ST elevation).
Figure 4.
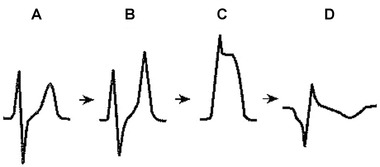
Electrocardiographic–pathological correlations after the occlusion of a coronary artery in an experimental animal with its thorax closed. (A) Control. (B) It changes from a subendocardial ischemia pattern (tall and peaked T wave) to a pattern of an ST segment elevation when the acute clinical ischemia is more severe and transmural (C). Finally (4), the “Q” wave of necrosis develops, accompanied as time passes by an increasingly evident pattern of negative T wave (Adapted with permission from Lengyel et al. 1957).
Therefore the notion that a negative T wave is a sign of ongoing ischemia is inaccurate. According to the Mexican School18, 19 negative T waves, seen in patients with IHD, represent ischemia that is located to the subepicardium. However, after occlusion of an epicardial coronary artery, the impairment of coronary flow starts in the subendocardium and may become transmural but never is exclusively subepicardial.24
On the other hand, it was demonstrated,5, 25 that the AP recorded in experimental studies with unipolar ECG shows, first a lengthening of AP of involved area and later a progressive decrease of its rate of rise and its amplitude. The resultant AP may be considered of “low quality.” However, the AP remains normal outside the ischemic area.
In the following paragraphs we will focus on different aspects from the electrophysiology to clinical implications, of the negative and/or flat T wave that may be seen in IHD.
NEGATIVE T WAVE
Concept
T‐wave inversion may be of primary or secondary type.11, 26 Secondary causes of T‐wave inversion are related to abnormal depolarization, as seen in left ventricular hypertrophy with strain, bundle branch block, or preexcitation. These are the consequence of delay of depolarization in some part of the heart. For instance, in a case of right bundle branch block, recovery of the left ventricle begins before completion of right ventricular depolarization, and the direction of the recovery vector is reversed across the septum and right ventricular wall. This explains T‐wave inversion in leads V1–V2 and positive T waves in leads V5–V6. This type of negative T wave characteristically is asymmetric and follows the ST segment deviation.17, 22, 26 Occasionally, repolarization changes persist after restoration of transient depolarization abnormality, so called “electric memory.”27
The negative T waves of primary origin are not a consequence of abnormal depolarization pattern. Characteristically, all the T waves of primary type, that are related, or not to ischemia, are symmetric and may vary between flat to deep negative T wave, depending of the magnitude of the lengthening of the transmembrane action potential (TAP) in the affected zone. This zone is, in case of IHD, transmural or subendocardial. In cases of pericarditis, the affected zone can be only subepicardial; however, this does not occur in cases of IHD.
Furthermore, sometimes there are fluctuations in the duration of AP of the subepicardium, probably related to changes in the “K” ionic currents that regulate the duration of the AP of the subepicardium. This may explain the transient changes of polarity of T wave that can be seen in different. clinical settings (see later).
The Negative T Wave of Ischemic Origin has the Following Characteristics:
- Mirror patterns. That means that when the T wave is negative in some leads, for example in II, III, and VF, in case of occlusion of RC or LCX artery, the T waves in opposed leads such as I and VL, presents positivity.
- The same may happen in case of LAD occlusion although in this case the mirror pattern usually presents a lower voltage (Figs. 5 and 6).
- The voltage of negativity is variable. In some leads the negativity is very evident and in others is much less or the T wave only present a flat morphology (Figs. 5 and 6). Usually, the voltage is related with the proximity of the affected zone to the recording electrode. In the electrodes facing the involved area the negativity is deeper.
- The negative T wave starts in the second part of repolarization. It is because the AP of affected transmural zone is prolonged compared with the rest, but the shape of it is normal (Fig. 7; see later). This explains that even sometimes the T wave may be biphasic with initially positive but terminally negative components (Fig. 6).
- The negative T wave usually deep may be accompanied by positive or negative U waves.27, 28 The cases with positive U wave (T and U discordance) are seen more frequently in the absence of IHD, than the cases with negative T and U wave (T–U concordance; Fig. 8). Also, occasionally a deep negative T wave due to reperfusion (aborted STEMI) may, if angina appear again, present a pseudonormalization of the T‐wave morphology that became positive even without ST segment elevation, with occasionally associated negative U wave.
Figure 5.
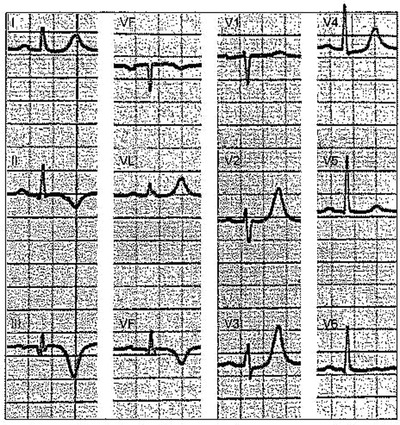
Chronic myocardial infarction of inferolateral zone. ECG with a typical pattern of negative T wave seen in post ischemic phase in the leads facing the inferior wall (negative and symmetric T wave in II, III, and VF) and the lateral wall (positive peaked T wave in V1–V2) as a mirror patterns. The R wave in V1 is not prominent as happens in cases of lateral wall MI affecting especially basal segments.
Figure 6.
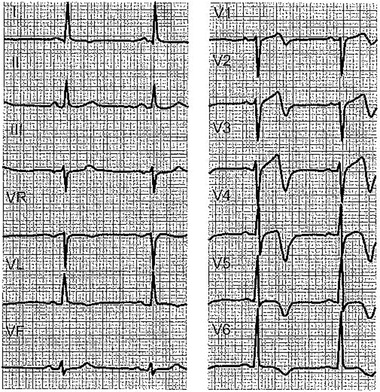
ECG with a quite negative T wave in V1–V2 to V5, with extension to I and VL in a patient with ACS, without chest pain, corresponding to a critical lesion in the proximal part of the left anterior descending (LAD) coronary artery, that practically normalizes during a chest pain crisis.
Figure 7.
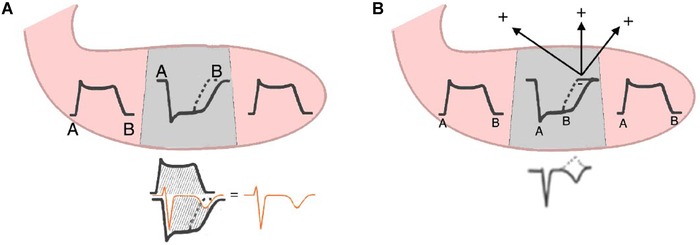
Origin of negative and deep T wave. (A) Due to increased TAP duration of transmural area affected, the sum of this TAP of this area with the TAP neighbor areas, that is shorter, explains the negative T wave. (B) The explanation based on the vector of ischemia, which is directed far away from recording electrode.
Figure 8.
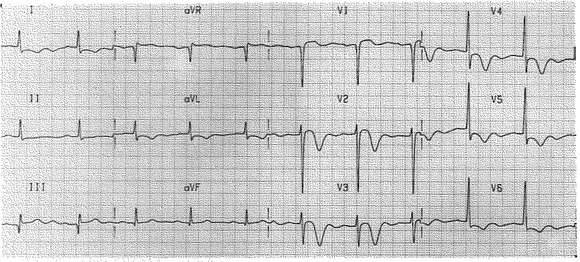
Representative electrocardiogram of concordant, negative T and negative U morphology. In leads I, aVL, V2–V6. (Taken from Reining et al.,28 with permissions of ANE 28).
Clinical Settings of IHD with a Negative T Wave: Electrophysiological Mechanism and Clinical Implications
In all cases these patterns are consequence of ischemia, but are not an expression of ongoing ischemia. However if ST depression exists (Figs. 14 and 15) the T wave may be negative, but we are now considering the cases of negative T wave with non‐ST depression.
Figure 14.
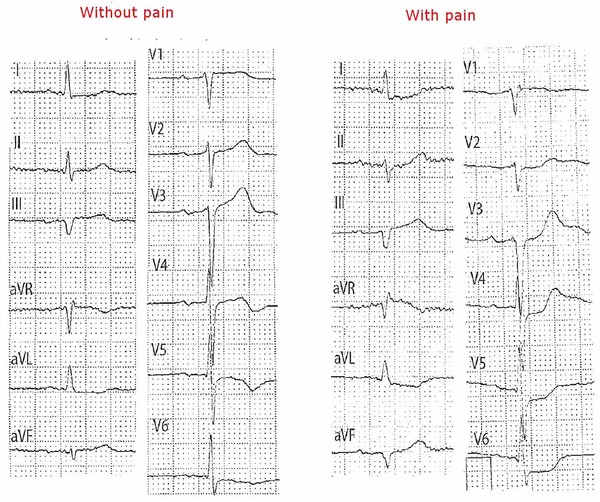
Patient with three vessel disease and left main trunk subocclusion. When recorded without pain, the ECG shows a negative T wave in V4–V6 of 2 mm. With pain, ST depression, which encompasses the T wave, clearly appears or increases in these leads and in the frontal plane lead.
Figure 15.
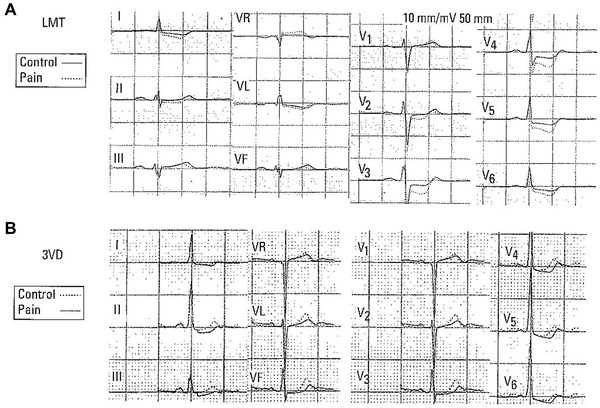
(A and B) Changes of ST/T during angina crisis in case of left main trunk (LMT) subocclusion (A) and severe three‐vessel disease (B). See the differences in A and B before and after pain. It is evident, especially in LMT subocclusion, that the increase of ST depression is accompanied by negative or nearly negative final T wave.
Post‐MI Patients
In presence of post‐MI patients usually with transmural involvement, the surface ECG that faces the zone of necrosis if all the wall is involved, records left intraventricular pattern of Q wave of necrosis with deep negative T wave (window effect of Wilson) (Fig. 9). In leads adjacent to the zone with QS pattern, a QR pattern with less deep Q wave and also less negative T wave is recorded.
Figure 9.
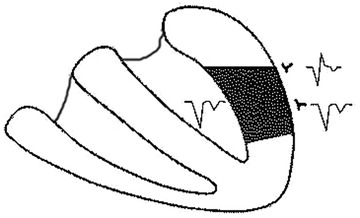
The development of a necrosis Q wave when a transmural infarction with homogeneous involvement of the left ventricle exists may be explained because the necrotic tissue, which is nonactivable, acts as an electrical window and allows for the recording of the left ventricular intracavitary QRS (which is a QS complex) from outside. If the necrosis zone is not completely transmural but the rest of the wall is ackinetic, also all the wall may act as a window (see Tamura et al.29).
In some cases after MI, even of Q‐wave type, there in not a transmural necrosis but the rest of the transmural zone that is not necrotic is hypokinetic and present electrophysiological dysfunction, and act as a necrotic area (stunned myocardium). Therefore, a Q wave may be recorded on the surface ECG leads in spite that the necrotic zone is not completely transmural.29 On the other hand, nonradial potential gradients may underlie T inversion when transmural necrosis is complete. Alternatively, in the absence of complete transmural necrosis and after non–Q‐wave infarction, an alternative explanation might involve slowing of the onset of depolarization in the epicardium as a result of decreased transmural conduction velocity. This might result in epicardial repolarization that ends after, rather than prior to, endocardial repolarization, leading to localized T inversion.
It is important to realize if the negative T wave along the time, or after exercise changes its morphology. In the first months after Q wave, the pseudonormalization of negative T wave in Q‐wave MI related leads after exercise testing,30 dobutamine stress infusion31 or spontaneously or before 6 months after anterior MI is the expression of viable tissue within the infarct area. This may also be due to good collateral circulation that favors functional recovery.29
In autopsy studies32 the presence of negative T waves in leads showing Q wave in the chromic phase (≥1 year) of anterior wall MI, means transmural infarction with only fibrotic tissue, whereas the presence of positive T wave in chronic Q‐wave MI means that part of the infarct area presents still viable myocardium.
Negative T Wave, Usually Deep, as a Consequence of Reperfusion
In clinical setting of acute ischemia the appearance of deep negative symmetric T wave is usually related with reperfusion process. This means that the artery is totally o partially patent. This may occur in the following circumstances.
(1) Evolution phase of STEACS usually of thrombotic origin, with the artery that has opened spontaneously or after drug treatment (fibrinolysis; Fig. 10), or PCI (Fig. 11), and (2) we may include in this group also the cases of Prinzmetal angina (coronary spasm). In all these cases, the negativity of T wave may appear very soon and may be very deep in the leads facing the affected zone. The appearance of this pattern depends on the intensity and or duration of ischemia and the presence or not of some degree of previous subendocardial ischemia. In Prinzmetal angina, the negative T wave may appear already in the resolution phase of ST elevation.
Figure 10.
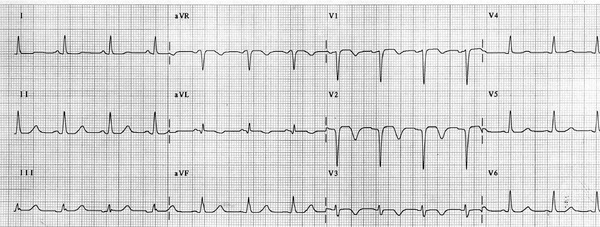
Typical pattern of negative T wave after reperfusion with fibrinolitic therapy, in case of STEACS due to occlusion of proximal LAD.
Figure 11.

In 2010, the patient with STEMI (A) is submitted to successful PCI (B), and a postischemic negative T wave appears. Later on (C) the patient presented with pain again and the ECG pseudonormalizes. A new coronarography demonstrates thrombosis of the stent and new PCI solves the problem, and again a negative T wave appears (D). The infarction was aborted.
The appearance of negative T wave in these cases is due to the presence of a transmural dispersion of repolarization due to transmural edema (Fig. 12), or other causes induced by reperfusion. Migliore33 has demonstrated with CMR correlations that in the presence of Wellen's pattern (deep negative T waves in V1–V4 in patients with STEACS or other pathologies) often is a transmural pattern of edema that disappear when the negative T wave normalizes.
Figure 12.

(A) Transmural involvement (CMR) in a case of negative T wave after aborted ACS. See the transmural edema B. Deep and negative T wave in V2 in a case of transient LAD occlusion (negative T wave of reperfusion edema; Taken from Migliore et al.33).
The longer transmural TAP of the affected zone compared with neighbor zones due to slowing of ionic exchange between the affected and normal zones during repolarization, explains the negative T wave through two theories (Fig. 7): (1) sum of TAP of injured area with longer TAP, with shorter TAP of the other part of LV, and (2) due to the presence of ischemic vector in the zone with longer TAP that faces the opposed part.
Mild Negative T Wave (Fig. 14)
The presence mild negative T wave or sometimes only flattening of the T wave occurs frequently during the evolution of NSTEACS, in general after resolution of symptoms and therefore is a marker of good progression. However, may persist in presence of pain, if this pattern of flat/slightly negative T wave was already previously present. This pattern usually is located in specific zones: V1–V3, V4 in case of LAD involvement; in II, III, VF in case of RC or LCX involvement and in case of 2/3 vessel disease in left lateral and I, and VL leads.
It is difficult to know the exact mechanism that explains the presence of this morphology. Probability is related with only a mild prolongation of TAP of the affected zone in relation with the TAP of the neighbors zones.
Flat/mildly negative T waves in some leads without Q waves may be present in some leads in presence of Q‐wave pattern with deep T negative waves in other leads. This represents that the leads with flat/mild negative T waves are not facing directly the necrotic affected area (Fig. 5; see before).
May Negative T Wave Appear in the Presence of Ongoing Ischemia?
To summarize, acute ongoing ischemia do not cause negative T waves, unless the negativity of T wave is due to the appearance of associated ST depression in these leads (see later and Fig. 15). We will make some remarks in favor of that.
- In patients with IHD, the negative T wave appear when the ongoing ischemia is vanishing or have already disappeared and may persist even long time, as we have discussed before (3.3.1 and 3.3.2.)
- However, if negative T wave, usually nondeep, is already present when acute ischemia appear, may remain unmodified or converts into to ST depression (Fig. 14).
- In presence of acute ischemia the increase of ST depression may converts a previously positive T wave in flat/mild negative wave. Sometimes the T wave become less positive in leads without evident ST depression, but never have seen that the T wave become in these conditions frankly negative without evident ST depression (Fig. 15).
- In the evolution of NSTEACS, it is frequent the presence of isolated flat/negative T wave in the absence of pain, but in the clinical setting of previous precordial pain some hours before. More often it appears in leads with R pattern but may be also seen in cases with rS pattern like V1–V2 (Fig. 13).
- Often the presence of flat/mildly negative T wave remains, after the acute and subacute phase of ACS or also in chronic Q‐wave MI as a residual pattern in some leads accompanied by deep negative T wave in other leads (Fig. 5).
- The positivity of exercise testing is expressed by ST segment depression. During exercise testing we do not see isolated T inversion related to ischemia. Occasionally, may appear flat or mild negative T wave due to hyperventilation (Fig. 16F). Only in a very few cases an ST segment elevation or peaked T wave, as an expression of coronary spasm, may appear. Also some patients with exercise‐induced ischemic ST segment deviation may have transient recovery phase with isolated T‐wave inversion. This is similar to reperfusion‐induced T‐wave inversion. In some cases with negative T waves at baseline, the T waves become positive during exercise and return to be negative after recovery.
- As we have already started in some cases a flattening or mild depression of T wave may be seen transiently in cases with clear hyperventilation (Fig. 16F) or in many other occasions, but not related to acute ischemia.
Figure 13.
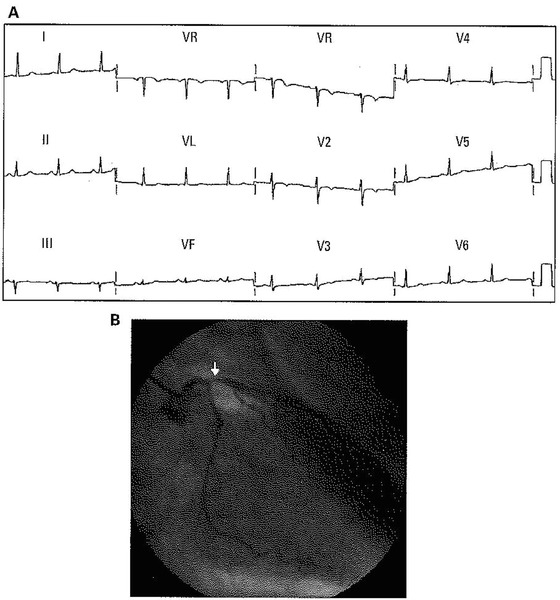
ECG of 55‐year‐old man without chest pain and with non‐ST segment elevation acute coronary syndrome (NSTEACS; unstable angina) and ECG with symmetric and mild negative T wave from V1 to V3. The coronarography shows important left anterior descending (LAD) proximal occlusion.
Figure 16.
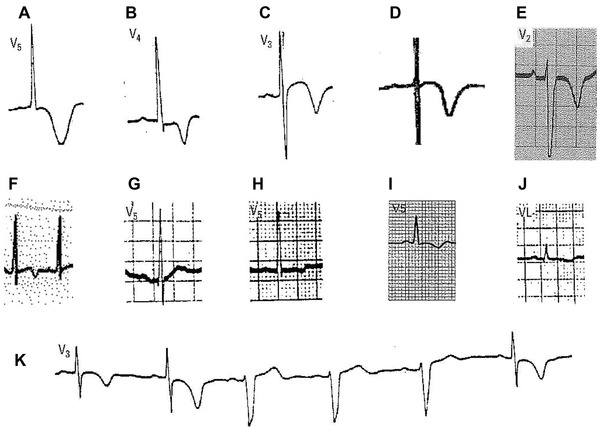
(A) Wide negative T wave with long QT and isoelectric ST segment that sometimes is observed in stroke. Usually with mirror pattern in other leads (see Fig. 19). (B) Very deep and peaked negative T wave, with preceded by depressed ST segment. This pattern is very common in apical HCM. (C). Very deep negative T wave preceded by ST elevation seen in asymptomatic, apparently healthy tennis player. In this case, it is necessary to rule out HCM. (D) Wide and deep negative T wave, with long QT preceded by isoelectric ST segment seen in a patient with shock and hypomagnesemia. (E) Negative wide very deep T wave seen in an acute for cor pulmonale. (F) Transient mild negative T wave seen during exercise test in a case of hyperventilation. (G) Flat and bimodal T wave due to amiodarone use. (H) Mild negative T wave due to chronic alcohol intake. (I) Negative T wave in pericarditis (see Fig. 17). (J) Flat/negative T wave with low voltage of ORS seen in mixedema. (K) A typical case of negative T wave in case of intermittent left bundle branch block, due to electric memory.
DIFFERENTIAL DIAGNOSIS OF FLAT/NEGATIVE PRIMARY T WAVE (FIG. 16)
There are many circumstances, not related with ischemia, that present negative T wave of primary origin (Fig. 16; Table 1). We will make some comments in the most important aspects of this differential diagnosis.
Table 1.
Negative T Wave of Primary Origin Not Related with Ischemia (see Fig. 16)
| 1. Normal variants: Children, pertaining to black race, hyperventilation, women (right precordial leads), etc. May sometimes be diffuse (global T‐wave inversion of unknown origin). More frequently observed in women. |
|---|
| 2. Pericarditis: in this condition, the pattern is usually extensive, but generally the negativity of T wave is not very pronounced. |
| 3. Cor pulmonale and pulmonary embolism. |
| 4. Myocarditis (perimyocarditis) |
| 5. Cardiomyopathies: Includes HCM, ARVD, noncompaction CM. Other types of CM, Takotsubo syndrome, etc. |
| 6. Alcoholism. May be transient or permanent. |
| 7. Stroke: not frequent. |
| 8. Myxedema and other diseases with generalized low voltage (flat T wave) such as anasarca. |
| 9. Sportsmen: with or without ST segment elevation. Hypertrophic cardiomyopathy, especially apical type, must be ruled out. |
| 10. After the administration of certain drugs: preylamine and amiodarone (flattened T wave). |
| 11. Hypokalemia: the T wave can be flattened but usually the ST segment depression is more evident. Also electrolyte disorders such as hypomagnesemia |
| 12. Posttachycardia |
| 13. Intermittent left bundle branch block and other situations of intermittent abnormal activation (pacemakers, Wolff‐Parkinson‐White syndrome; electric memory). |
| 14. Transient changes related with hyperventilation (few seconds) or glucose or alcohol intake (hours or days). |
Negative T Wave of Pericarditis and Perimyocarditis (Fig. 17)
Figure 17.
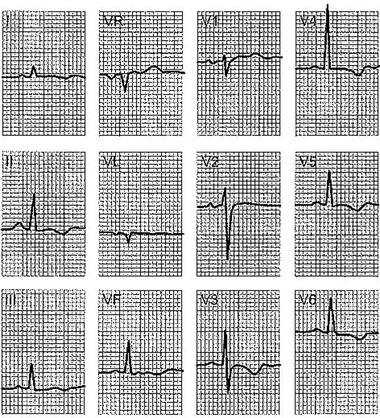
Patient with chronic constrictive pericarditis. The T wave is negative in many leads, but not quite deep, without the “mirror pattern” in the frontal plane. The T wave is only positive in VR and V1 because, as there is a diffuse subepicardial ischemia, they are the only two leads in which the ischemic vector that is directed away from the ischemic area is approaching the exploring electrode.
This differential diagnosis is the most frequent and important to perform because also exists precordial pain and present ST–T wave alternations. In these cases, usually the negative T wave is not very deep but diffuse (extensive but not intense in contraposition with negative T wave of IHD that usually is intense—more deep—but not extensive and presents a mirror pattern; compare Figs. 5 and 17). Although these characteristics may be useful to perform the differential diagnosis there are some cases that this is not so easy.
Usually the clinical setting, such as the presence of dyspnea in perimyocarditis, and/or some characteristics of precordial pain, and other aspects of ECG, as the PR segment elevation in VR and depression in lead II in case of pericarditis, and evident sinus tachycardia in myocarditis with even occasional presence of Q wave that may be transient, may help to perform the correct diagnosis.
Cardiomyopathies
The most striking ECG changes correspond to cases of apical type of hypertrophic cardiomyopathy. In these cases, the negativity of T wave may be very deep and peaked and sometimes is symmetrical (Fig. 16B). There are also many cases of hypertrophic cardiomyopathy (HCM) that present repolarization alterations, that may mimic classical left ventricular hypertrophy (LVH) with strain pattern, and finally occasionally the only abnormality is the presence of symmetric negative T wave in V1–V3 (see later).
We would like to emphasize, however, that in asymptomatic patients, the presence of deep (>2 mm) negative and symmetric T wave especially in the right precordial leads arises the suspension that is abnormal and that may correspond to some type of cardiomyopathies like arrhythmogenic right ventricular displasia (ARVD), noncompaction cardiomyopathies, abnormalities of papillary muscles or an especial type of hypertrophic cardiomyopathies, and that an study with imaging techniques has to be performed (Fig. 18).
Figure 18.
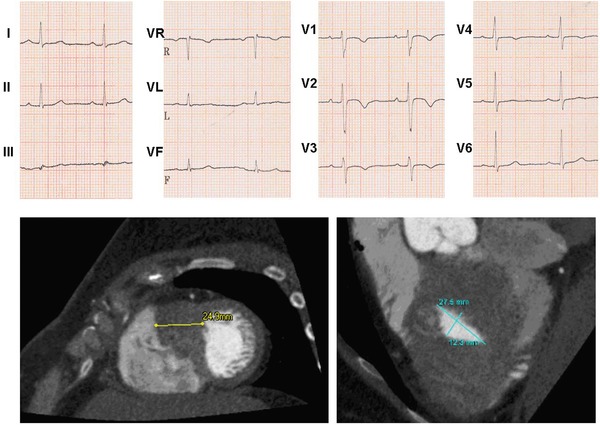
ECG of young woman of 42 years, that presents a negative and symmetric T wave in V1–V3. Due to this morphology and in spite of apparently normal echocardiogram, CMR was performed, that shows a very huge increase of the wall of lower apical part of the heart, corresponding to an atypical form of hypertrophic CM.
It has been demonstrated34 that deep negative T wave in V1–V4, similar to negative T wave seen in aborted STEMI (Wellens pattern), often occurs in Takotsubo syndrome, a cardiomyopathy that mimic ACS. In correlation studies with CMR has demonstrated that this negative T wave coincides and quantitatively correlates with the apicobasal gradient of myocardial edema as evidenced by CMR and disappear when the edema vanishes. Dynamic negative T waves and QTc prolongation are likely to reflect the edema‐induced transient inhomogeneity and dispersion of repolarization in different zones of LV, especially between apical and basal left ventricular regions. This topic is discussed in other article of this issue.
Negative T Wave Even Deep in a Routine Screening
Negative T waves in routine screening ECGs in leads other than V1 and V2 may be found in around 1% of subjects with no evident cause by history or physical examination, and these people generally have normal echocardiograms. This unexplained T‐wave inversion may be due to a previous myopericarditis, but it is compulsory to rule out any type of cardiomyopathies with CMR studies that are more reliable than echocardiography, even if is only seen in V1–V3, especially if the negative T wave is symmetrical (Fig. 18). Finally, this type of negative T wave may be seen in athletes without evident cardiomyopathies, because the ECG abnormality may appear before the evidence of cardiomyopathies in CMR imaging. Therefore, repeated studies of CMR has to be performed routinely.
The mechanism of this deep negative T wave, may be the presence of electrical gradient between the two ventricles of the heart which is amplified by a delay of activation of the initial vector of the QRS in the left ventricle that precedes the morphological evidence of left bundle branch block (LBBB) conduction delay.
Presence of High Voltage
T wave that present mirror pattern (positive in some leads and negative in others) may be seen in some cases of cerebrovascular damage, like subarachnoideal hemorrhage (Fig. 19). Usually, the T wave presents very wide morphology that occupies nearly all the repolarization and not isoelectric ST segment is seen before the onset of T wave. There is also very long OT interval. Similar pattern may be found in some electrolyte disorders especially hipomagnesemia, although negative the T wave in these cases in not so wide and exist some isoelectric ST segment.
Figure 19.
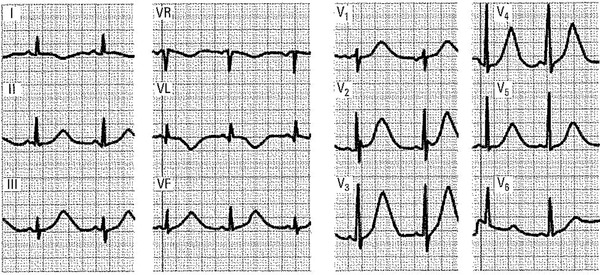
A 30‐year‐old patient with subarachnoid hemorrhage. The ECG shows quite significant repolarization changes, with a very long QT interval mainly at the expense of a very wide T wave, positive in some leads (precordial and inferior leads) and negative in others (I, VL).
Brugada Syndrome
The presence in V1–V2 of negative and symmetric T wave at the end of downsloping ST elevation after a high take off of ORS of at least ≥2 mm is a hallmark of type 1 Brugada pattern.35
Electric Memory
The presence of negative, usually deep T wave, may be seen due to the phenomenon of electric memory. This can confound the diagnosis of ischemia when pacing is intermittent or when pacing is discontinued in nonpacing‐dependent patients to examine the underlying ECG. It may also follow prolonged LBBB and occasionally prolonged ventricular tachycardia27 (Fig. 16K).
Presence of Flat/Not Deep Negative
T wave present in many leads may be seen in different circumstances that affects uniformly the myocardium, such as (1) ingestion of alcohol that may induce transient changes or if these are persistent may represent some grade of impairment of left ventricular function; (2) use of different drugs such as amiodarone; (3) associated to some disease that present generalized low voltage such is myxedema, or heart failure with anasarca.36 In many occasions (drugs, alcohol, hyperventilation), this changes are transient and often, especially when are small and disappear quickly, such as in hyperventilation or alcohol intake are usually innocent, but when the T wave is very such negative it is compulsory to perform an echocardiogram or eve CMR or as coronary angiogram.
DIAGNOSIS OF PRIMARY NEGATIVE T WAVE DUE TO ISCHEMIA OR OTHER CAUSES IN PRESENCE OF LVH WITH STRAIN AND/OR CASE WITH WIDE QRS (FIG. 20)
Figure 20.
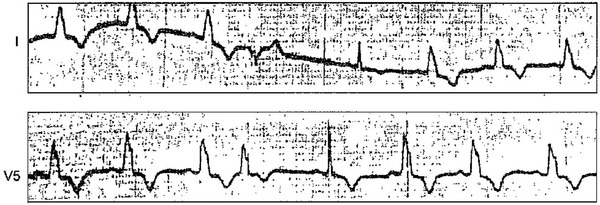
Symmetric negative T wave (see leads I and V5) in a patient with hypertension and intermittent complete left bundle branch block, who presents with symmetric T wave when the LBBB disappears after a ventricular extrasystole (fifth Qr 25 complex I and V0). This is a mixed pattern (ischemia + LVH). Also the T wave of complexes with LBBB shows more symmetric morphology than in cases of isolated LBBB.
The association of negative T wave due to primary alteration of repolarization (portischemic changes, drugs, electrolyte disturbances, etc.) with secondary alterations due to left ventricular enlargement (LVE) with strain, and/or LBBB, produces a mixed pattern. In these cases, the resultant negative T wave frequently appears more symmetric.
CONCLUSIONS
The negative T wave that appears in patients with IHD is of primary type and is never recorded as a new sign of ongoing ischemia for the following seasons.
- Isolated T‐wave inversion is never due to the presence of ongoing acute ischemia in ACS or exercise‐induced ischemia. On the contrary acute ischemia may convert negative T wave in ST depression in the course of NSTEACS. Therefore, in the presence of negative T wave in a coronary patient we cannot consider that this is due to the presence of active or ongoing ischemia.
- It is nonaccurate to state that the negative T wave is explained by ischemia located in subepicardium.
- The QS pattern with negative T wave more or less deep, that appear in chronic Q‐wave MI, is the expression of left intraventricular pattern that appear in case of Q‐wave MI with transmural necrotic zone (Fig. 9). If the involved area is not completely necrotic, but is akinetic, it may present a lack of effective function in whole transmural area and also a QS pattern may be recorded.29
- Negative, usually deep, T wave appear in presence of reperfusion: aborted STEMI (spontaneously or after fibrinolysis or PCI) or in the resolution phase of coronary spasm.
- In NSTEMI, the negative T wave is usually nondeep, and is seen in general in the phase of resolution of the ACS.
Primary negative T wave may be present in many clinical situation outside IHD that are summarized in Table 1. When we face in ECG with primary negative T wave, and we do not have or do not know any clinical data, we have to consider that for performing a final clear diagnosis we have to joint data from history taking, physical examination and careful ECG interpretation. These data jointly with some data taken from imaging technique usually allow us to obtain the correct diagnosis.
SUMMARY
- There are many occasions along the course of IHD that an isolated negative T wave of primary origin appears. This never occurs in the ongoing process of acute ischemia. The negative T wave occurs in the resolution phase of ischemia when the artery is already open, or as a “fingerprint” of previous STEACS, that affects transmurally a wall of LV, hereby producing Q‐wave MI, or in aborted STEMI, or in case of NSTEACS.
- The negative T wave seen in patients with IHD is symmetrical and the onset is preceded by an isoelectric ST segment. Especially in case of post–Q‐wave MI the negative T wave is deeper in some leads and presents mirror pattern.11, 17
- There are many other circumstances that may present primary T‐wave inversion outside IHD. Figure 16 shows the most important, and in Table 1 there is a longer list.
- With a careful history taking and ECG interpretation, and if necessary with the help of some imaging techniques we may arrive in the majority of cases to a correct diagnosis.
- However, it is true that in some small number of cases the presence of negative T wave is unexplained. We may always think that this may be the expression of unrecognized previous perimyocarditis, or consider that is explained by an abnormal delay of activation of LV, before presentation of a clear pattern of LBBB, or may be the expression of changes in the “ionic K currents” that intervene in the duration of TAP of subepicardium.
REFERENCES
- 1.Rosenbaum FF, Wilson FN, Johnston FD. The precordial electrocardiogram in high lateral myocardial infarction. Am Heart J 1946;32:135–151. [DOI] [PubMed] [Google Scholar]
- 2.Burgess JM, Green LS, Millar D, et al. The sequence of normal ventricular recovery. Am Heart J 1972;84:660–169. [DOI] [PubMed] [Google Scholar]
- 3.Ashman R, Hull E. Essentials of Electrocardiography. Macmillan Co. New York 1937. [Google Scholar]
- 4.Burnes J, Waldo A, Rudy Y. Imaging dispersion of ventricular repolarization. Circulation 2001;104:1299–1305. [DOI] [PubMed] [Google Scholar]
- 5.Franz MR, Bargheer K, Rafflenbeul W, Haverich A, Lichtlen PR. Monophasic action potential mapping in human subjects with normal electrocardigrams: Direct evidence of the T wave. Circulation 1987;75:379–386. [DOI] [PubMed] [Google Scholar]
- 6.Draper MH, Weidman S. Cardiac resting and action potentials recorded with an intracellular electrode. J Physiol 1951;115:74–94. [DOI] [PMC free article] [PubMed] [Google Scholar]
- 7.Cassidy DM, Vassallo JA, Klein AM, et al. The use of programmed electrical stimulation in patients with documented or suspected ventricular arrhythmias. Heart Lung 1984;13:602–607. [PubMed] [Google Scholar]
- 8.Yan GX, Antzelevitch C. Cellular basis for the normal T wave and the electrocardiographic manifestations of the long‐QT syndrome. Circulation 1998;98:1928–1936. [DOI] [PubMed] [Google Scholar]
- 9.Opthof T, Coronel R, Wims Schopman FJ, et al. Dispersion of repolarization in canine ventricle and the ECG T wave: T interval does not reflect transmural dispersion. Heart Rhythm 2007;4:341–348. [DOI] [PubMed] [Google Scholar]
- 10.Hoffman B, Cranefield P. Electrophysiology of the Heart. McGraw‐Hill, New York: 1960. [Google Scholar]
- 11.Bayés de Luna A. Clinical Electrocardiography: a Text Book. Wiley‐Blackwell, Oxford, UK: 2011. [Google Scholar]
- 12.Smith FM. The ligation of coronary arteries with electrocardiographic study. 1918. A. N. E. 2004;9:80–93. [DOI] [PMC free article] [PubMed] [Google Scholar]
- 13.Bailey RH, La Due JS, York DJ. Electrocardiographic changes (local ventricular ischemia and injury) produced in the dog by temporary occlusion of a coronary artery, showing a new stage in the evolution of myocardial infarction. Am Heart J 1943;25:164–169. [Google Scholar]
- 14.Hellerstein A, Katz C. The electrical effects of injury at various myocardial locations. Am Heart J 1948;36:184–220. [DOI] [PubMed] [Google Scholar]
- 15.Lengyel L, Caramelli Z, Monfort J, et al. Initial ECG changes in experimental occlusion of the coronary arteries in non‐anesthetized dogs with closed thorax. Am Heart J 1957;53:334–338. [DOI] [PubMed] [Google Scholar]
- 16.Janse MJ. Electrophysiological changes in acute myocardial ischemia In Julian DG, Lie KI, Wihelmsen L. (eds.): What is Angina? Astra, 1982, p. 160. [Google Scholar]
- 17.Sodi D, Calder N. New Basis of Electrocardiography. Mosby, St. Louis: 1956. [Google Scholar]
- 18.Cabrera E. Teoría y Práctica de la Electrocardiografía. L La Prensa Médica Mexicana, Mexico 1958. [Google Scholar]
- 19.Tranchesi J. Electrocardiogramia Normal y Patologia. La Médica; Rosario 1968. [Google Scholar]
- 20.Chou To‐Chuan. Electrocardiography in Clinical Practice. Grune & Stratton, New York 1979. [Google Scholar]
- 21.Bayés de Luna A. Fundamentos de Electrocardiografia. Edit. Cientifico Médica, Barcelona: 1981. [Google Scholar]
- 22.Cooksie J, Dunn M, Massie E. Clinical VCG and ECG. Year Book Medical Pu, Chicago 1977. [Google Scholar]
- 23.Lipman B.S, Massie E, Kleiger RE. Clinical Scalar ECG. Year Book Medical Pu. Chicago 1972.
- 24.Kennedy R, Varriale P, Alfanito J. Textbook of Vectorcardiography. Harper‐Row, New York 1970. [Google Scholar]
- 25.Khuri SF, Jlaherty JT, L'Riordan JB, et al. Changes in intramyocardial ST segment voltage and gas tensions with regional myocardial ischemia in the dog. Circ Res 1975; 37:455–463. [DOI] [PubMed] [Google Scholar]
- 26.Massie E, Walsh TJ. Clinical Vectorcardiography and Electrocardiography. Year Book Medical, Chicago: 1960, p. 128,226. [Google Scholar]
- 27.Rosenbaum M, Blanco H, Elizari M. Electrotonic modulation of the T wave and the cardiac memory. Am J Cardiol 1982;50:213–222. [DOI] [PubMed] [Google Scholar]
- 28.Reinig MG, Harizi R, Spodick D. Electrocardigraphic T and U wave discordance. Ann Noninvasive Electrocardiol 2005;10:41–46. [DOI] [PMC free article] [PubMed] [Google Scholar]
- 29.Tamura A, Nagase K, Mikuriya Y, et al. Significance of spontaneous normalization of negative T wave in infarct related leads during healing of anterior wall acute myocardial infarction. Am J Card 1999;84:1341–1344. [DOI] [PubMed] [Google Scholar]
- 30.Pizzeti G, Montorfano M, Belotti G, et al. Exercise‐induced T‐wave normalization predicts recovery of regional contractile function after anterior myocardial infarction. European Heart J 1998;19:420–428. [DOI] [PubMed] [Google Scholar]
- 31.Salustri. T‐wave normalization during dobutamine echocardiography for diagnosis of viable myocardium. Am J Cardiol 1995;75:505–507. [DOI] [PubMed] [Google Scholar]
- 32.Maeda S, Imai T, Kuboki K, et al. Pathologic implications of restores positive T waves and persistent negative T waves after Q wave myocardial infarction. J Am Coll Cardiol 1996;28:1514–1518. [DOI] [PubMed] [Google Scholar]
- 33.Migliore M, Zorzi A, Perrazslo Marra M, et al. Myocardial edema undeslies dynamic T‐wave inversion (Wellen's pattern) in patients with reversible left ventricular dysfunction. Heart Rhythm 2011;8:1629–1634. [DOI] [PubMed] [Google Scholar]
- 34.Marra P, Zorzi A, Corbetti F, et al. Apicobasal gradient of left ventricular myocardial edema underlies transient T‐wave inversion and QT interval prolongation (Wellens’ ECG pattern) in Tako‐Tsubo cardiomyopathy. Heart Rhythm 2013;10:70–77. [DOI] [PubMed] [Google Scholar]
- 35.Bayés de Luna A, Brugada J, Baranchuck A, et al. Current ECG criteria for diagnosis of Brugada pattern; a consensus report. J Electrocardiol 2012;45:433–442. [DOI] [PubMed] [Google Scholar]
- 36.Madias JE, Bazaz R, Agarwal H, et al. Anasarca mediated attenuation of amplitude of ECG‐complexes: A description of a heretofore unrecognized phenomenon. J Am Coll Cardiol 2001:38:756–764. [DOI] [PubMed] [Google Scholar]