Expression of the SARS-CoV-2 Entry Proteins, ACE2 and TMPRSS2, in Cells of the Olfactory Epithelium: Identification of Cell Types and Trends with Age (original) (raw)
. Author manuscript; available in PMC: 2024 Jan 25.
Published in final edited form as: ACS Chem Neurosci. 2020 May 19;11(11):1555–1562. doi: 10.1021/acschemneuro.0c00210
Abstract
The Covid-19 pandemic revealed that there is a loss of smell in many patients, including in infected, but otherwise asymptomatic individuals. The underlying mechanisms for the olfactory symptoms are unclear. Using a mouse model, we determined whether cells in the olfactory epithelium express the obligatory receptors for entry of the SARS-CoV-2 virus by using RNAseq, RT-PCR, in situ hybridization, Western blot, and immunocytochemistry. We show that the cell surface protein ACE2 and the protease TMPRSS2 are expressed in sustentacular cells of the olfactory epithelium, but not, or much less, in most olfactory receptor neurons. These data suggest that sustentacular cells are involved in SARS-CoV-2 virus entry and impairment of the sense of smell in COVID-19 patients. We also show that expression of the entry proteins increases in animals of old age. This may explain – if true also in humans – why individuals of older age are more susceptible to the SARS-CoV-2 infection.
Keywords: SARS-CoV-2, ACE2 expression, olfactory epithelium, anosmia, COVID-19, aging
Graphical Abstract
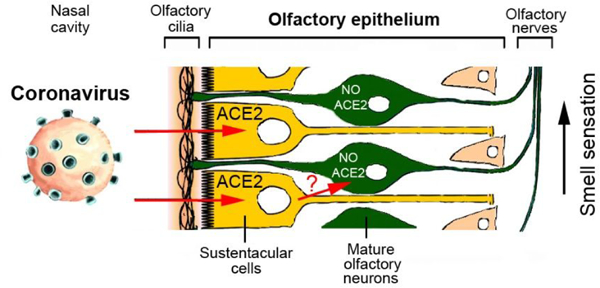
Recent reports indicate that partial loss of the sense of smell or even total anosmia are early markers of SARS-CoV-2 infection.1,2 However, the cellular mechanisms of this phenomenon are unknown. Transient impairment of olfaction may be caused by two different types of processes: inflammation in the olfactory epithelium, or damage to the olfactory receptor neurons. The latter possibility should be considered because SARS-CoV virus can infect olfactory neurons, followed by axonal transport of the virus to the brain in transgenic mice expressing human ACE2 protein.3
If the novel SARS-CoV-2 virus indeed gains access to the olfactory pathway, with the potential of subsequent brain infection,4,5 then one would expect that cells in the olfactory epithelium express proteins that facilitate SARS-CoV-2 virus entry. This is currently not known but could be relevant for efforts to identify tissues that have a large viral load and are more sensitive for virus detection in infected, but asymptomatic individuals.6 It is known that SARS-CoV-2 virus invades human cells via the obligatory receptor, angiotensin converting enzyme II (ACE2), and that viral uptake is further facilitated by a priming protease, TMPRSS2.7,8 Cells with high ACE2 and TMPRSS2 expression have strong virus binding capacity and are particularly susceptible to infection.9 Identifying the relevant cell types is essential to determine the mechanism of hyposmia and anosmia observed in a significant fraction of COVID-19 patients and in otherwise asymptomatic carriers, as we have previously emphasized.6
While large-scale transcriptome studies have examined gene expression in the olfactory epithelium of various species, it is currently controversial whether neuronal or non-neuronal cells in the olfactory epithelium express the obligatory receptors, ACE2 and TMPRSS2, and whether expression levels differ with age.10–19 By using RNAseq, RT-PCR, in situ hybridization, Western blot and immunocytochemistry in a murine olfactory model system, we here identify sustentacular cells as the cell type with high expression of ACE2 and TMPRSS2, thus indicating that these cells may be targeted by SARS-CoV-2 virus in the human olfactory epithelium. Because sustentacular cells play key roles in supporting olfactory neuron metabolism and odor sensing,20 we propose that damage caused by the SARS-CoV-2 virus to sustentacular cells may lead to the olfactory deficits observed in COVID-19 patients.
Most of the data available from previous transcriptome experiments for murine and human olfactory epithelium (OE) indicate that both genes, ACE2 and TMPRSS2, are expressed in the OE. However, one microarray study did not find ACE2 expressed in the OE.10 Several studies report that ACE2 expression is likely in non-neuronal cells rather than in olfactory receptor neurons (ORNs),12–14 based on very low or lack of ACE2 expression in isolated mature ORNs, yet positive expression in whole OE, but again, one microarray study did not find ACE2 enriched in non-neuronal cells of the OE.11 Technical factors could contribute to these discrepancies,21 since RNAseq data can only provide predictions that require independent experimental validation.15 Our own data obtained by RNAseq expression profiling shows ACE2 expression within the OE in young and aged mice without major changes in expression during aging (Tab. 1; GEO accession GSE147771).
Tab. 1.
RNAseq expression profile for ACE2 and TMPRSS2 (normalized estimation of expression, in FPKM units) in olfactory epithelium (OE) for 2-month old (2MO) and 2-year old mice (2YO). Expression profiling from adult to aged animals shows similar levels for ACE2 (p > 0.05), but a significant increase for TMPRSS2 (p < 0.05). Data are based on 3 independent libraries prepared from OE of 3 male mice for each age (GEO accession GSE147771). FPKM – fragments per kilobase of transcripts per million mapped reads.
| Gene | 2MO (FPKM) | 2YO (FPKM) | Fold change | P value |
|---|---|---|---|---|
| ACE2 | 0.963 | 0.918 | −0.07 | 0.865 |
| TMPRSS2 | 35.101 | 46.103 | 0.39 | 0.038 |
Analysis of previous RNAseq data indicate neuronal and non-neuronal expression of TMPRSS2 in the OE.12,13, except for one study which did not find TMPRSS2 expressed in OE.14 The levels of TMPRSS2 expression in non-neuronal OE cells seem to be higher than in ORNs,10,13 but different subpopulations of mature ORNs appear to differ in their levels of TMPRSS2;13 such a mosaic expression pattern is not typical for the majority of other ORN genes. Our own RNAseq profiling in murine OE readily detected expression of TMPRSS2 and its levels were higher as compared to ACE2 (GEO accession number GSE147771). TMPRSS2 expression increased with old age (Tab. 1).
In summary, our RNAseq and other available expression profiling data for murine OE indicate that ACE2 is mainly expressed in non-neuronal cells, and TMPRSS2 is widely expressed in both, neuronal and non-neuronal cells, likely with higher expression levels in non-neuronal cells.17 Since gene expression in murine and human OE is highly conserved,14 these results suggest that non-neuronal cells rather than ORNs in the human OE are the most likely site of SARS-CoV-2 virus entry to the olfactory epithelium.
Since transcriptome data should be validated by additional gene and protein expression studies,15,18,21 we next used RT-PCR to examine gene expression. Our analysis of expression performed by real-time RT-PCR showed a slight decrease of ACE2 in the OE in juvenile mice, while levels of expression subsequently remained constant during aging (Fig. 1A). Because of recent reports discussing the possibility of SARS-CoV-2 infection in the brain,4,5 we also examined gene expression in the brain. Expression of ACE2 was significantly lower in the brain as compared to OE, and low levels in the olfactory bulb and frontal cortex did not change with age (Fig. 1B, C). TMPRSS2 expression in the OE increased from young adult to old age mice (Fig. 1D), and this is consistent with our RNAseq data (Tab. 1). To validate our real-time RT-PCR approach, we examined expression of another protease, TMPRSS4, which is also known to be expressed in non-neuronal cells, as is the case for TMPRSS2.12,14 Expression of TMPRSS4 has an opposite trend in OE with age (decreasing, Fig. 1G) as compared to TMPRSS2 (increasing in the OE with old age) (Fig. 1D).
Fig. 1.
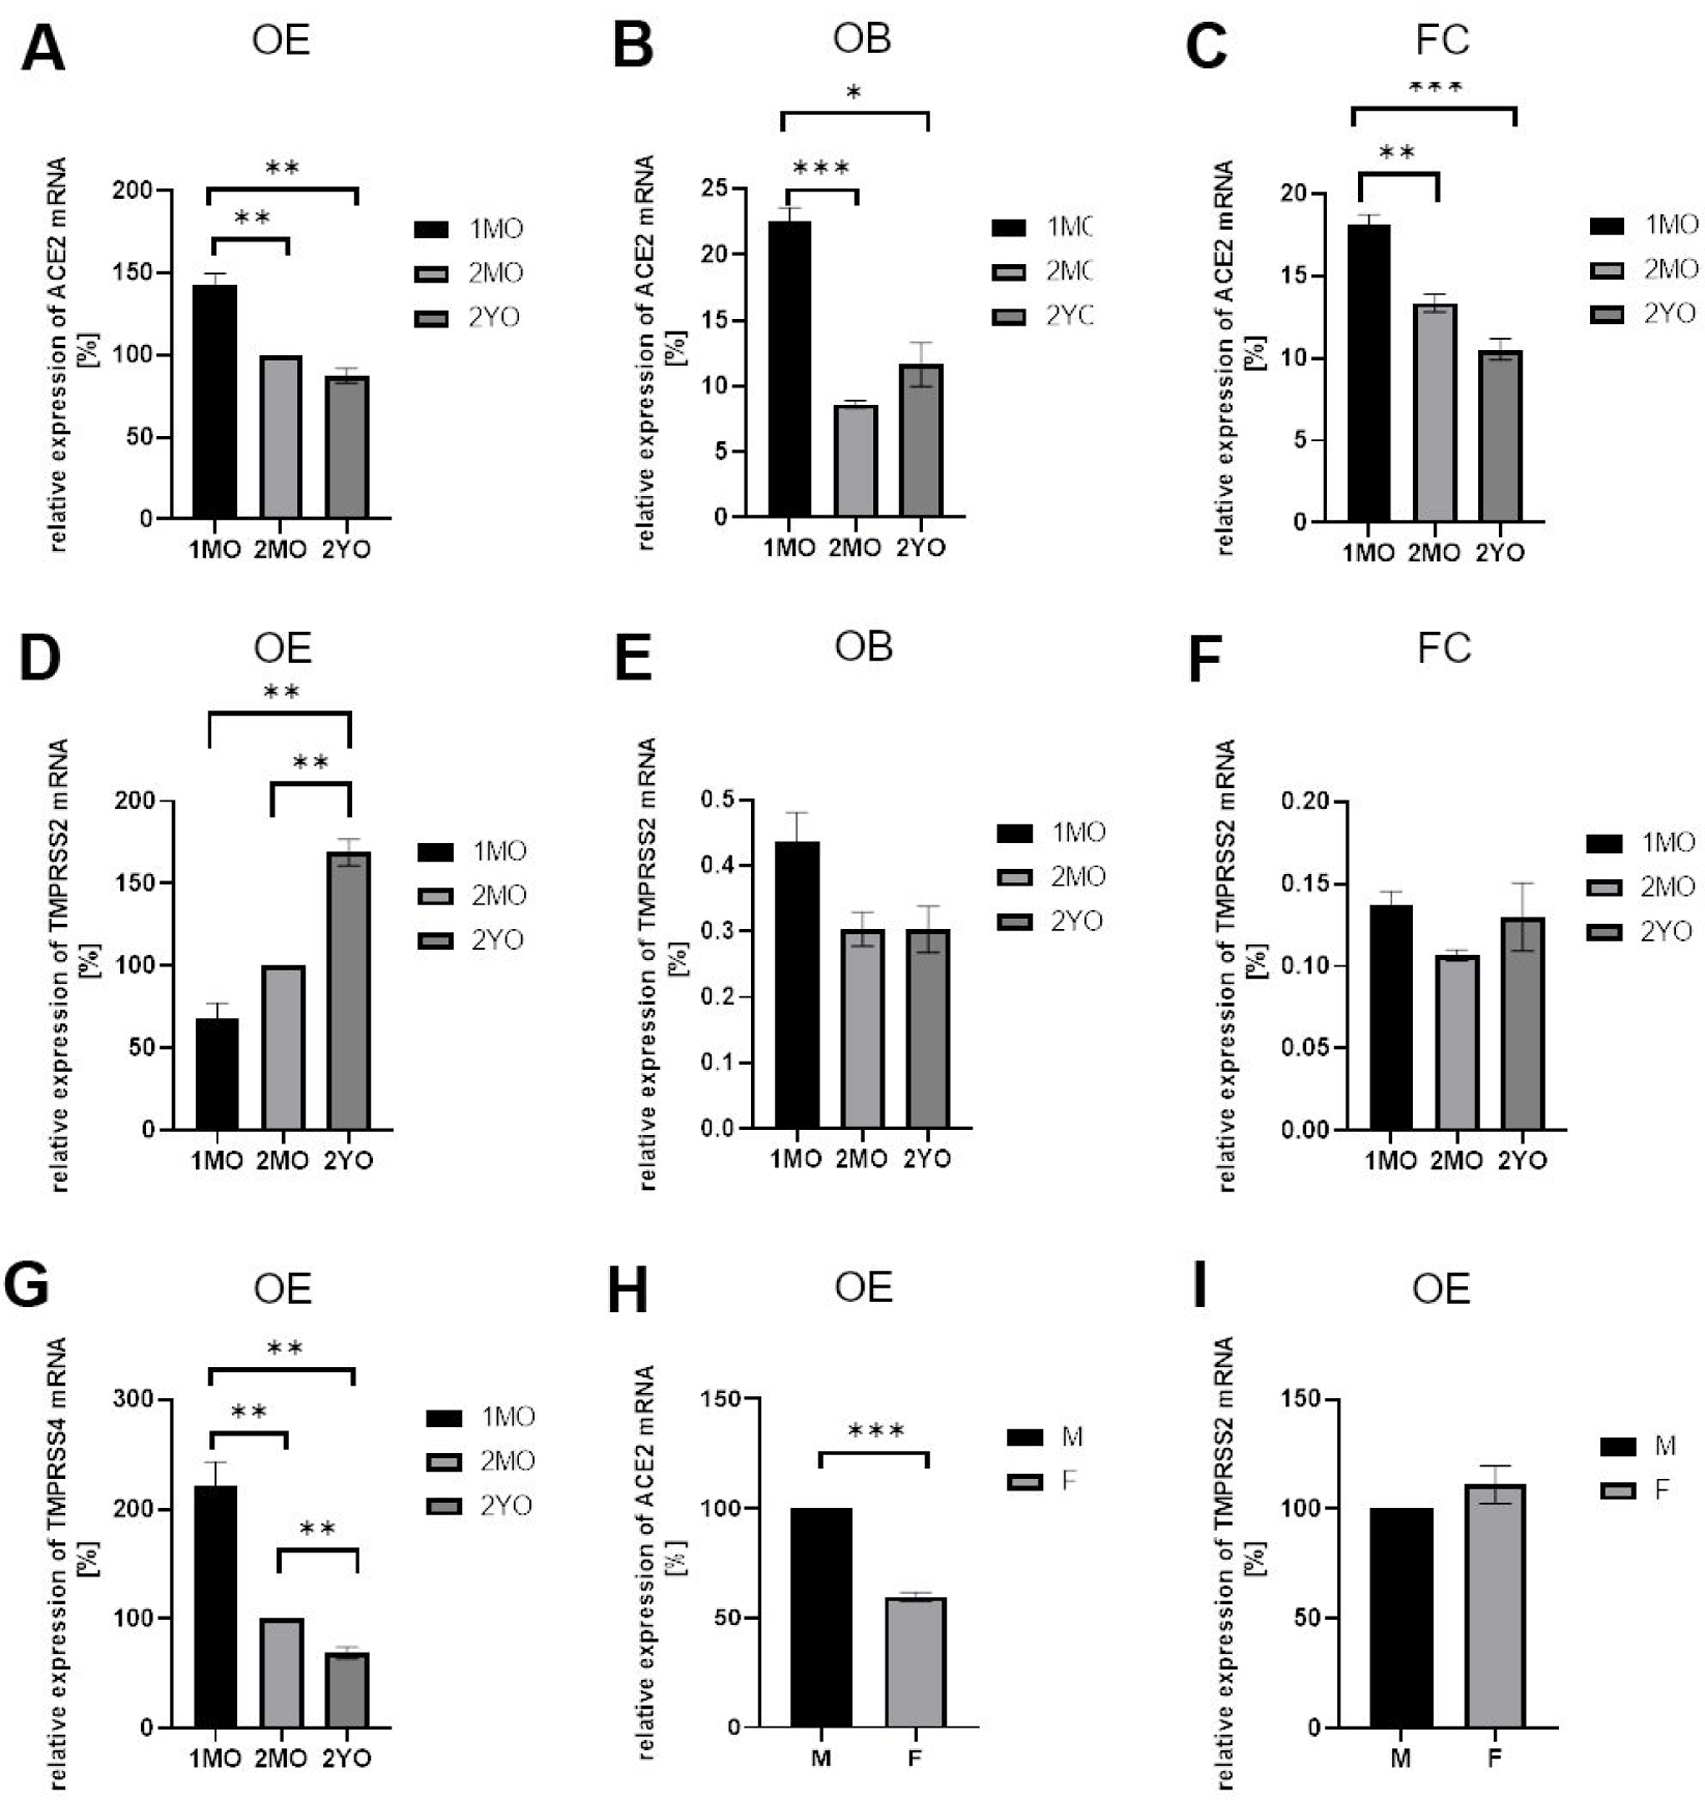
Gene expression analysis by RT-PCR for ACE2 and TMPRSS2 in murine olfactory epithelium (OE), olfactory bulb (OB), and frontal cortex (FC) at different ages.
Relative expression levels were normalized to expression in 2-month old OE (100%) using GAPDH as housekeeping gene. Similar results were obtained with beta actin as the housekeeping gene. A. Relative expression of ACE2 in OE decreases from juvenile 1-month old (1MO) to 2-month old (2MO), but it is stable in 2-year old (2YO). B, C. ACE2 levels observed in OB and FC are lower as compared to OE and stable during aging. Note that OE has higher expression level than OB and FC at each stage analyzed. D. For TMPRSS2, much higher expression was detected in OE as compared to OB (E) and FC (F). Note that with aging the level of TMPRSS2 increases significantly in OE but not in OB or FC. G. Expression of another protease, TMPRSS4, in OE significantly decreases during aging. H. Lower expression of ACE2 was noted in OE of female as compared to male 2-month old mice. I. TMPRSS2 expression in OE did not show gender-specific differences. All graphs give the mean values, and error bars represent ± SEM. * P ≤ 0.01, ** P ≤ 0.005, *** P ≤ 0.001.
Comparison of adult male and female mice showed lower levels of ACE2 expression in the OE of females (Fig. 1H), but not in the olfactory bulb or in frontal cortex (data not shown). TMPRSS2 was expressed in the OE at similar levels in male and female mice (Fig. 1I). Taken together, our data indicate that ACE2 and TMPRSS2 expression is much higher in the OE than in brain, and that the aging process does not significantly affect the levels of ACE2, however TMPRSS2 levels increase in old age.
Since protein content does not always correlate with gene expression, we examined expression of ACE2 at the protein level, by comparing protein content in the OE of young and old mice in Western blots. ACE2 protein increased with age in the OE, but not in the olfactory bulb or the frontal cortex (Fig. 2). Similar data were obtained with two different antibodies. Slightly different electrophoretic mobility of ACE2 bands in younger and older OE may be due to differential glycosylation or other differences in post-translational modifications and requires further examination. Our data suggest that the OE of older mice (and, if true for humans, also older humans) may be more susceptible to SARS-CoV-2 infection than younger ages.
Fig. 2.
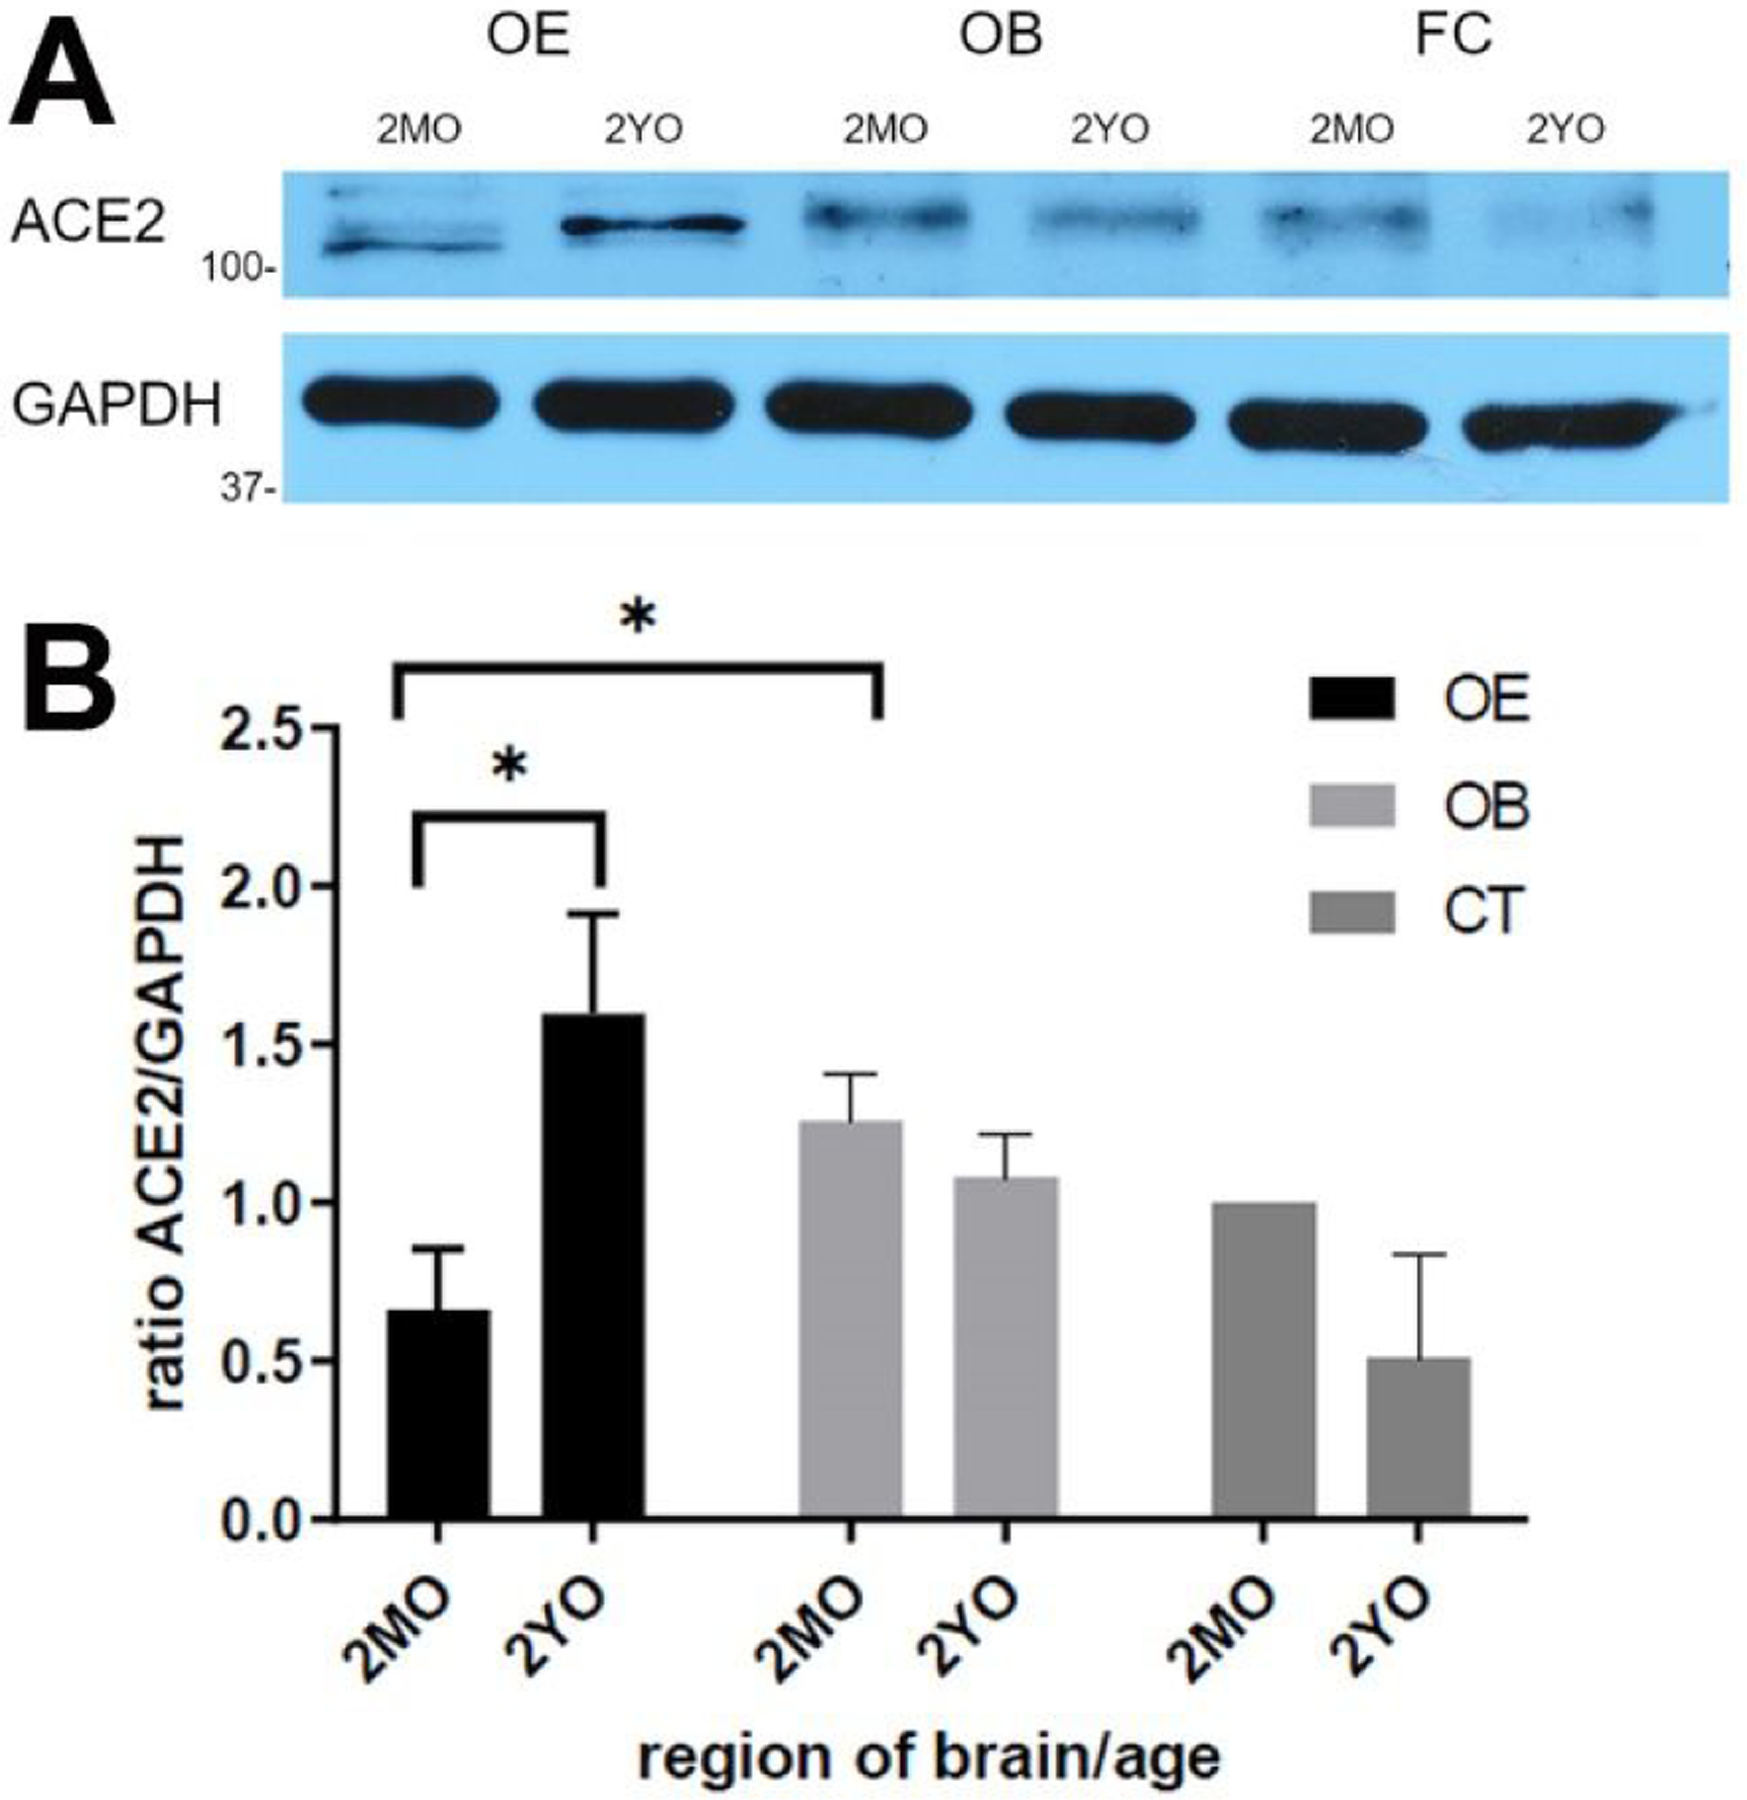
Detection of ACE2 protein in tissue lysate by Western blot.
A. One or more bands just above 100 kDa is visible which is more intense in aged olfactory epithelium (OE) (2YO) than in 2-month old (2MO). In contrast, in olfactory bulb (OB) and frontal cortex (FC), ACE2 bands are weaker and decrease with age. GAPDH verifies similar loading per lane. B. Quantification of the relative band intensity shows significant increase of ACE2 in aged OE but not in aged OB and FC. Intensity of ACE2 band for 2MO FC was set at 100%. Graphs give the mean values, and error bars represent ± SEM. * P ≤ 0.01.
Our analysis of RNAseq and RT-PCR data as well as transcriptome expression data available from databases and the literature strongly suggest that TMPRSS2 is expressed in multiple cell types in the OE, while ACE2 is mainly or exclusively expressed in non-neuronal cells. Since both entry proteins are thought to be required for SARS-CoV-2 infection,7,8 it is important to establish the identity of these non-neuronal cells. We used immunocytochemistry to localize ACE2 protein. As predicted by gene expression studies, the fluorescence signal from deeper layers of the OE was relatively low, while the highest intensity of label was found at the luminal side immediately adjacent to the nasal cavity (Fig. 3A–C and 3D–F). This location contains the dendrites of ORNs as well as cell bodies of the sustentacular cells.
Fig. 3.
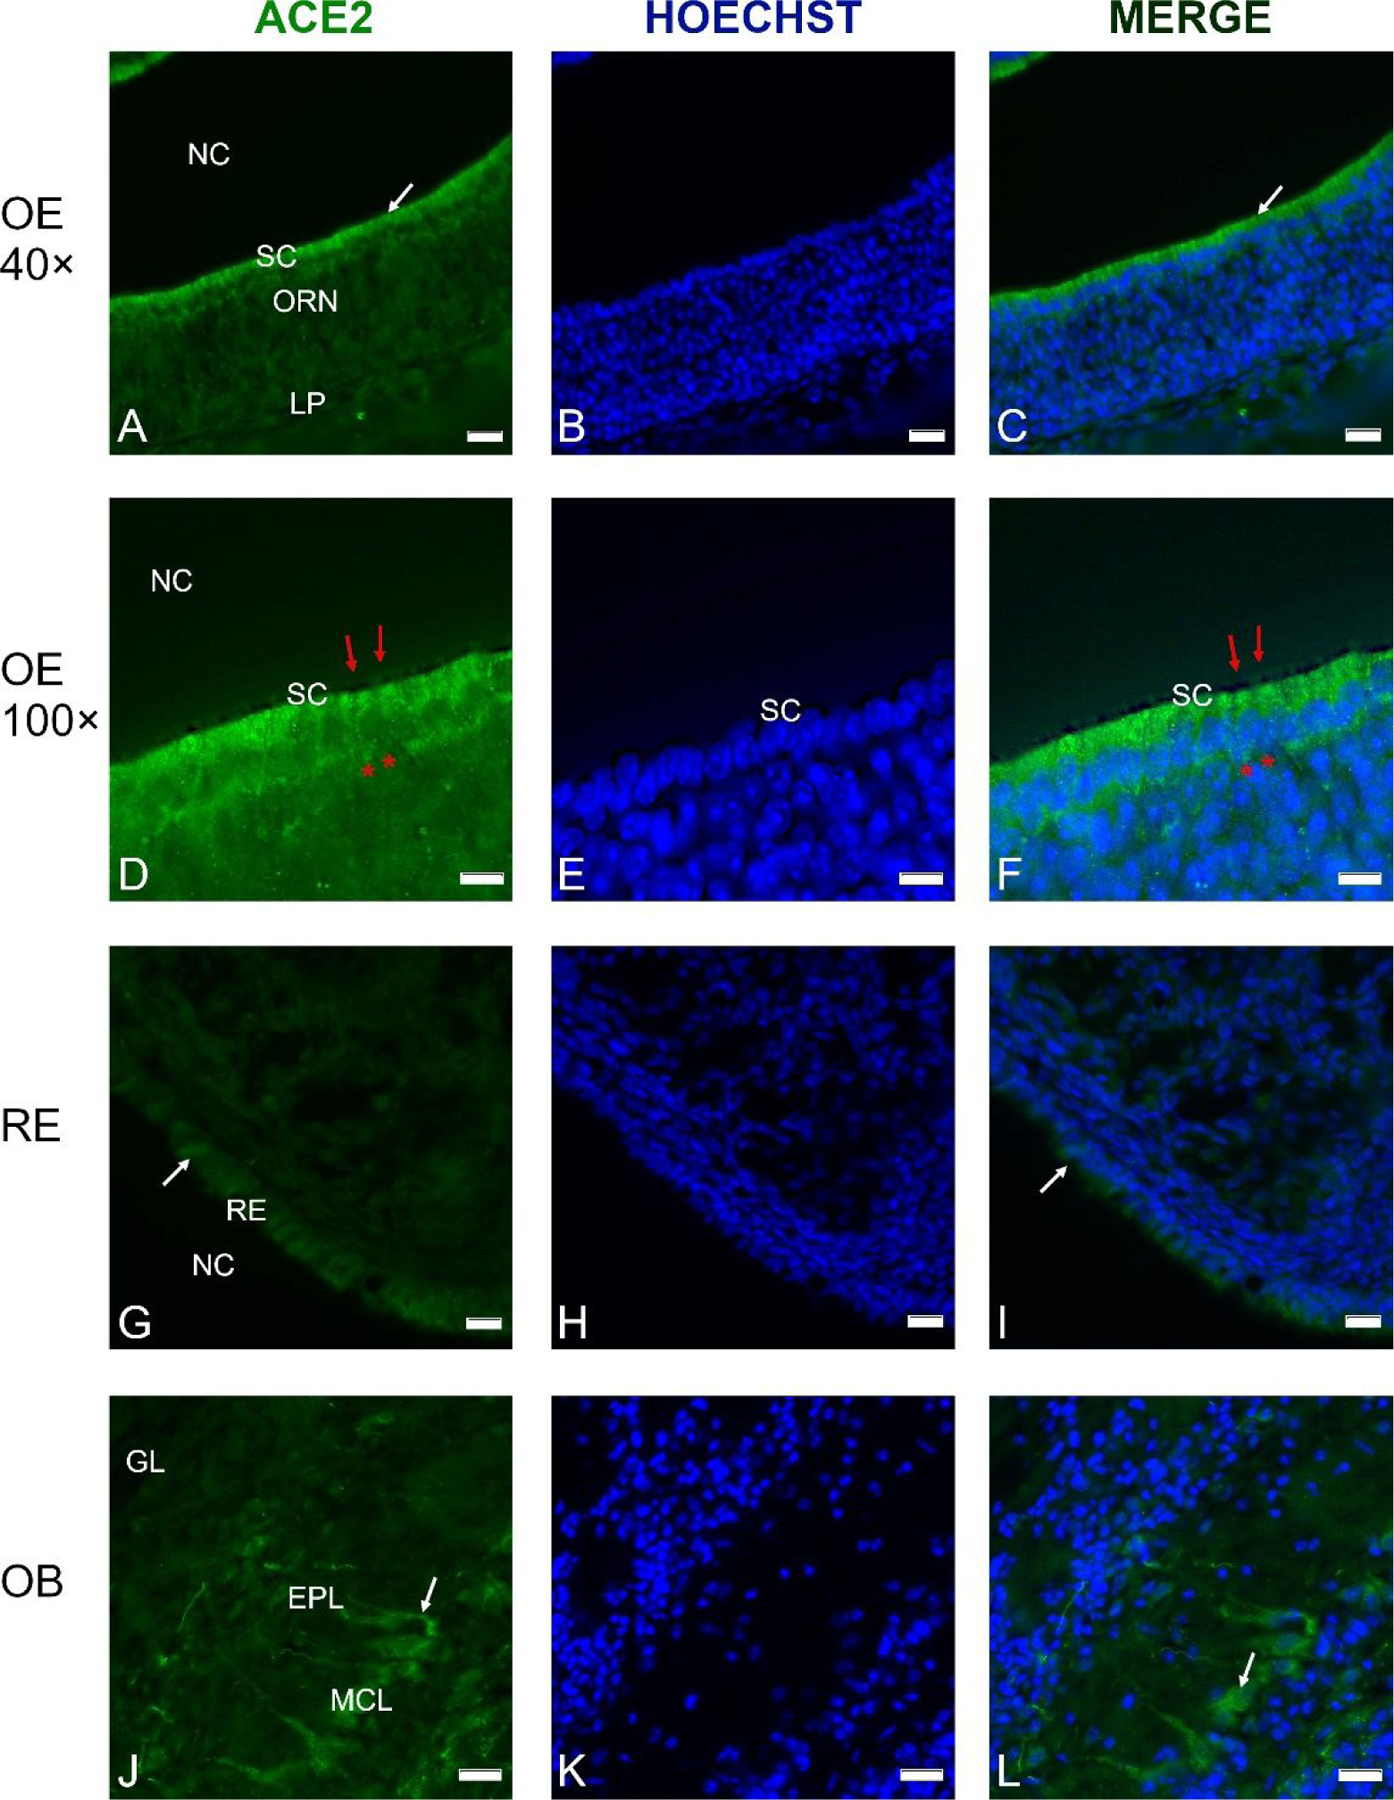
Cross-sections through the olfactory epithelium (OE) (A-F), respiratory epithelium (RE) (G-I) and olfactory bulb (OB) (J-L) probed with an anti-ACE2 antibody; nuclei were stained with Hoechst 33258 (B, E, H, K).
A thin layer of labeling is visible at the luminal surface of the OE (A, D). Higher magnification shows labeling just above the layer of sustentacular cell nuclei (D-F), while the olfactory knobs and cilia (red arrows) do not contain ACE2, and neither do the olfactory receptor neurons (ORN, asterisks in D and F). C, D. Merging of the images from A and B as well as D and E reveals that the cell bodies of the sustentacular cells (SC) contain most of the ACE2 label. ACE2 label was weaker in the RE of the nasal cavity (G-I). In the OB, ACE2 antibodies labeled some mitral cells, including their proximal dendrites (J-L, arrows). Control sections probed without primary antibodies or with control rabbit IgG had no detectable signal (not shown). Other abbreviations: NC- nasal cavity; MCL- mitral cell layer; EPL- external plexiform layer; GL- glomerular layer. Scale bars: 20 μm (A-C, G-I), 10 μm (D-F), and 25 μm (J-L).
Our single-labeling experiments suggest that sustentacular cells contain most of the ACE2 protein in the OE, consistent with RNAseq data showing that neuronal expression of ACE2 is unlikely. The non-neuronal expression of ACE2 is not surprising, since transcriptome data for cerebral cortex indicated that ACE2 was expressed mostly by endothelial cells and astrocytes, but not by neurons.22 However, others reported that ACE2 is also distributed in the cytoplasm of neuronal cell bodies.23,24
In order to clarify whether ACE2 protein is present in dendrites and cilia of olfactory receptor neurons (ORNs), we performed double labeling experiments with a marker for mature ORNs, olfactory marker protein (OMP). Double labeling shows that the majority of ACE2 signal is located within the layer of sustentacular cells, adjacent to the OMP signal, just below the heavily OMP-labeled ORN knobs and cilia protruding into the nasal cavity (Fig. 4A, B, D and E, F, H). Although it is possible that rare microvillar cells also express ACE2, we conclude that in the OE, ACE2 protein is located mainly in the sustentacular cells, but not in the ORN cilia. This finding is significant, because sustentacular cells are exposed to a hostile external environment, thus they are accessible to airborne pathogens including viruses. Sustentacular cells support ORN function by endocytosing olfactory binding protein-odorant complexes,25 and therefore may compromise olfaction when infected by viruses. In the olfactory bulb, ACE2 was localized mostly in mitral cells, and no or very low signal was detected in glomeruli or periglomerular interneurons (Fig. 4I–L). Intriguingly, some dendritic localization of ACE2 was visible in mitral cells (Fig. 4I, L). This suggests that some distinct neuronal populations in the brain may contain ACE2, as was earlier observed by others.22,23
Fig. 4.
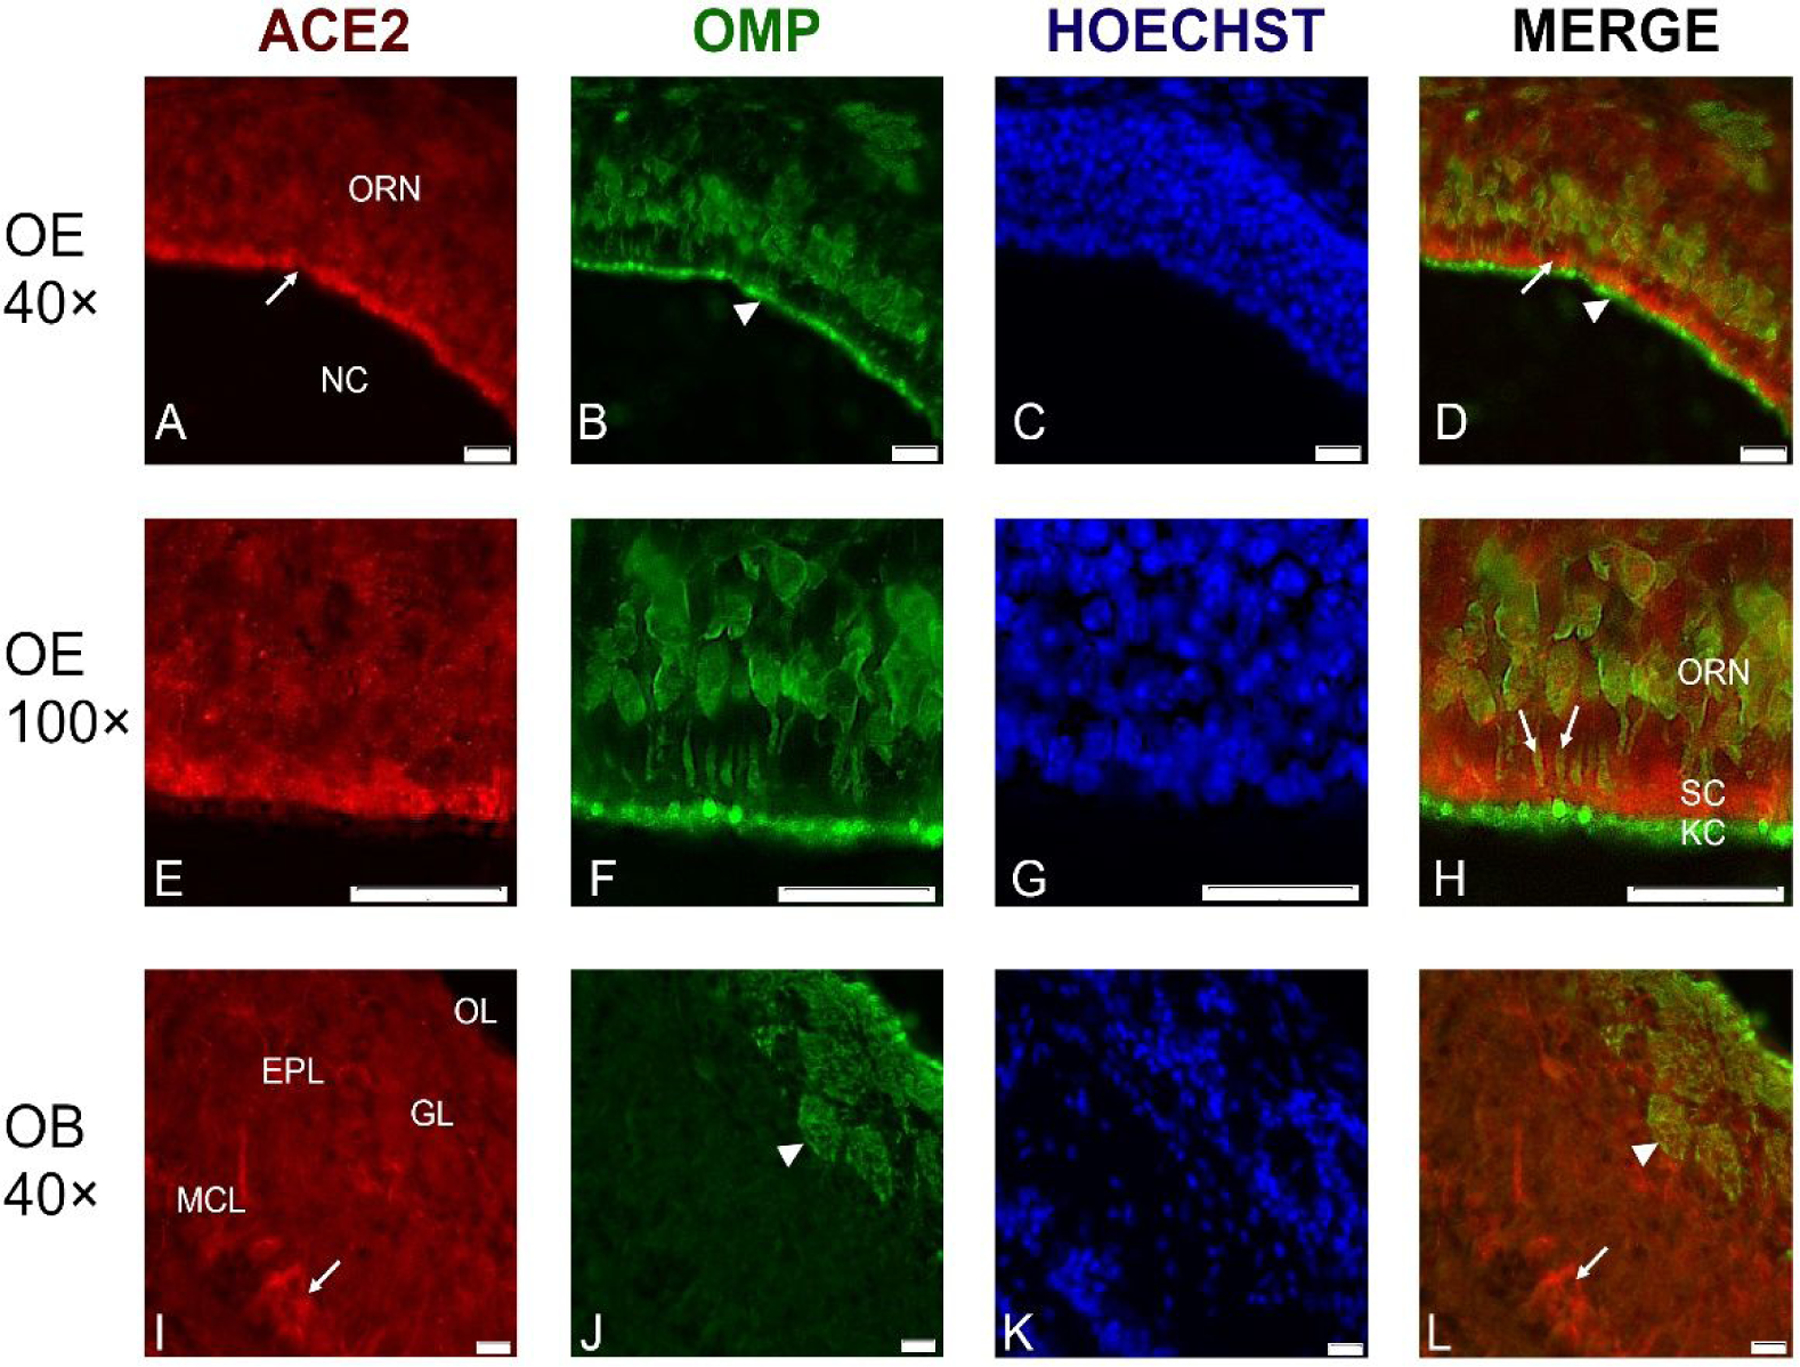
Representative cross-sections through the olfactory epithelium (OE) in the center of the nasal cavity (NC) probed with antibodies against ACE2 (red channel) and against olfactory marker protein (OMP) (green channel).
ACE2 immunoreactivity was located just below the luminal surface (A, D; arrows), between the OMP-labeled olfactory receptor knobs and cilia (arrowhead) and the layer of the olfactory receptor neurons (ORN) (A-D). At higher magnification, it is apparent that OMP-labeled ORN dendrites (arrows in H) penetrate the layer of ACE2-labeled sustentacular cells (SC), while the knobs and cilia (KC) of the ORNs at the luminal surface only contain OMP, but not ACE2 (E-H). The border between the KC and the SC layers is indicated in the merged image (H, arrowhead). In the olfactory bulb (OB), ACE2 label is mainly in some mitral neurons (arrow), while glomeruli (GL) and olfactory nerve layer at the top of OB are not labeled (I, L). Nuclei were stained with Hoechst 33258. ORN- olfactory receptor neurons, MCL- mitral cell layer; EPL- external plexiform layer; GL- glomerular layer; OL- olfactory nerve layer. Scale bars: 20 μm.
Recent RNAseq results for respiratory epithelium of the human nasal cavity did not detect clear ACE2 signals,16,26 while single cell RNAseq in human respiratory epithelium did show ACE2 expression.17 We detected ACE2 protein in the respiratory epithelium of the nasal cavity, however with a lower signal intensity as compared to the sustentacular cell layer of the OE (Fig. 5E).
Fig. 5.
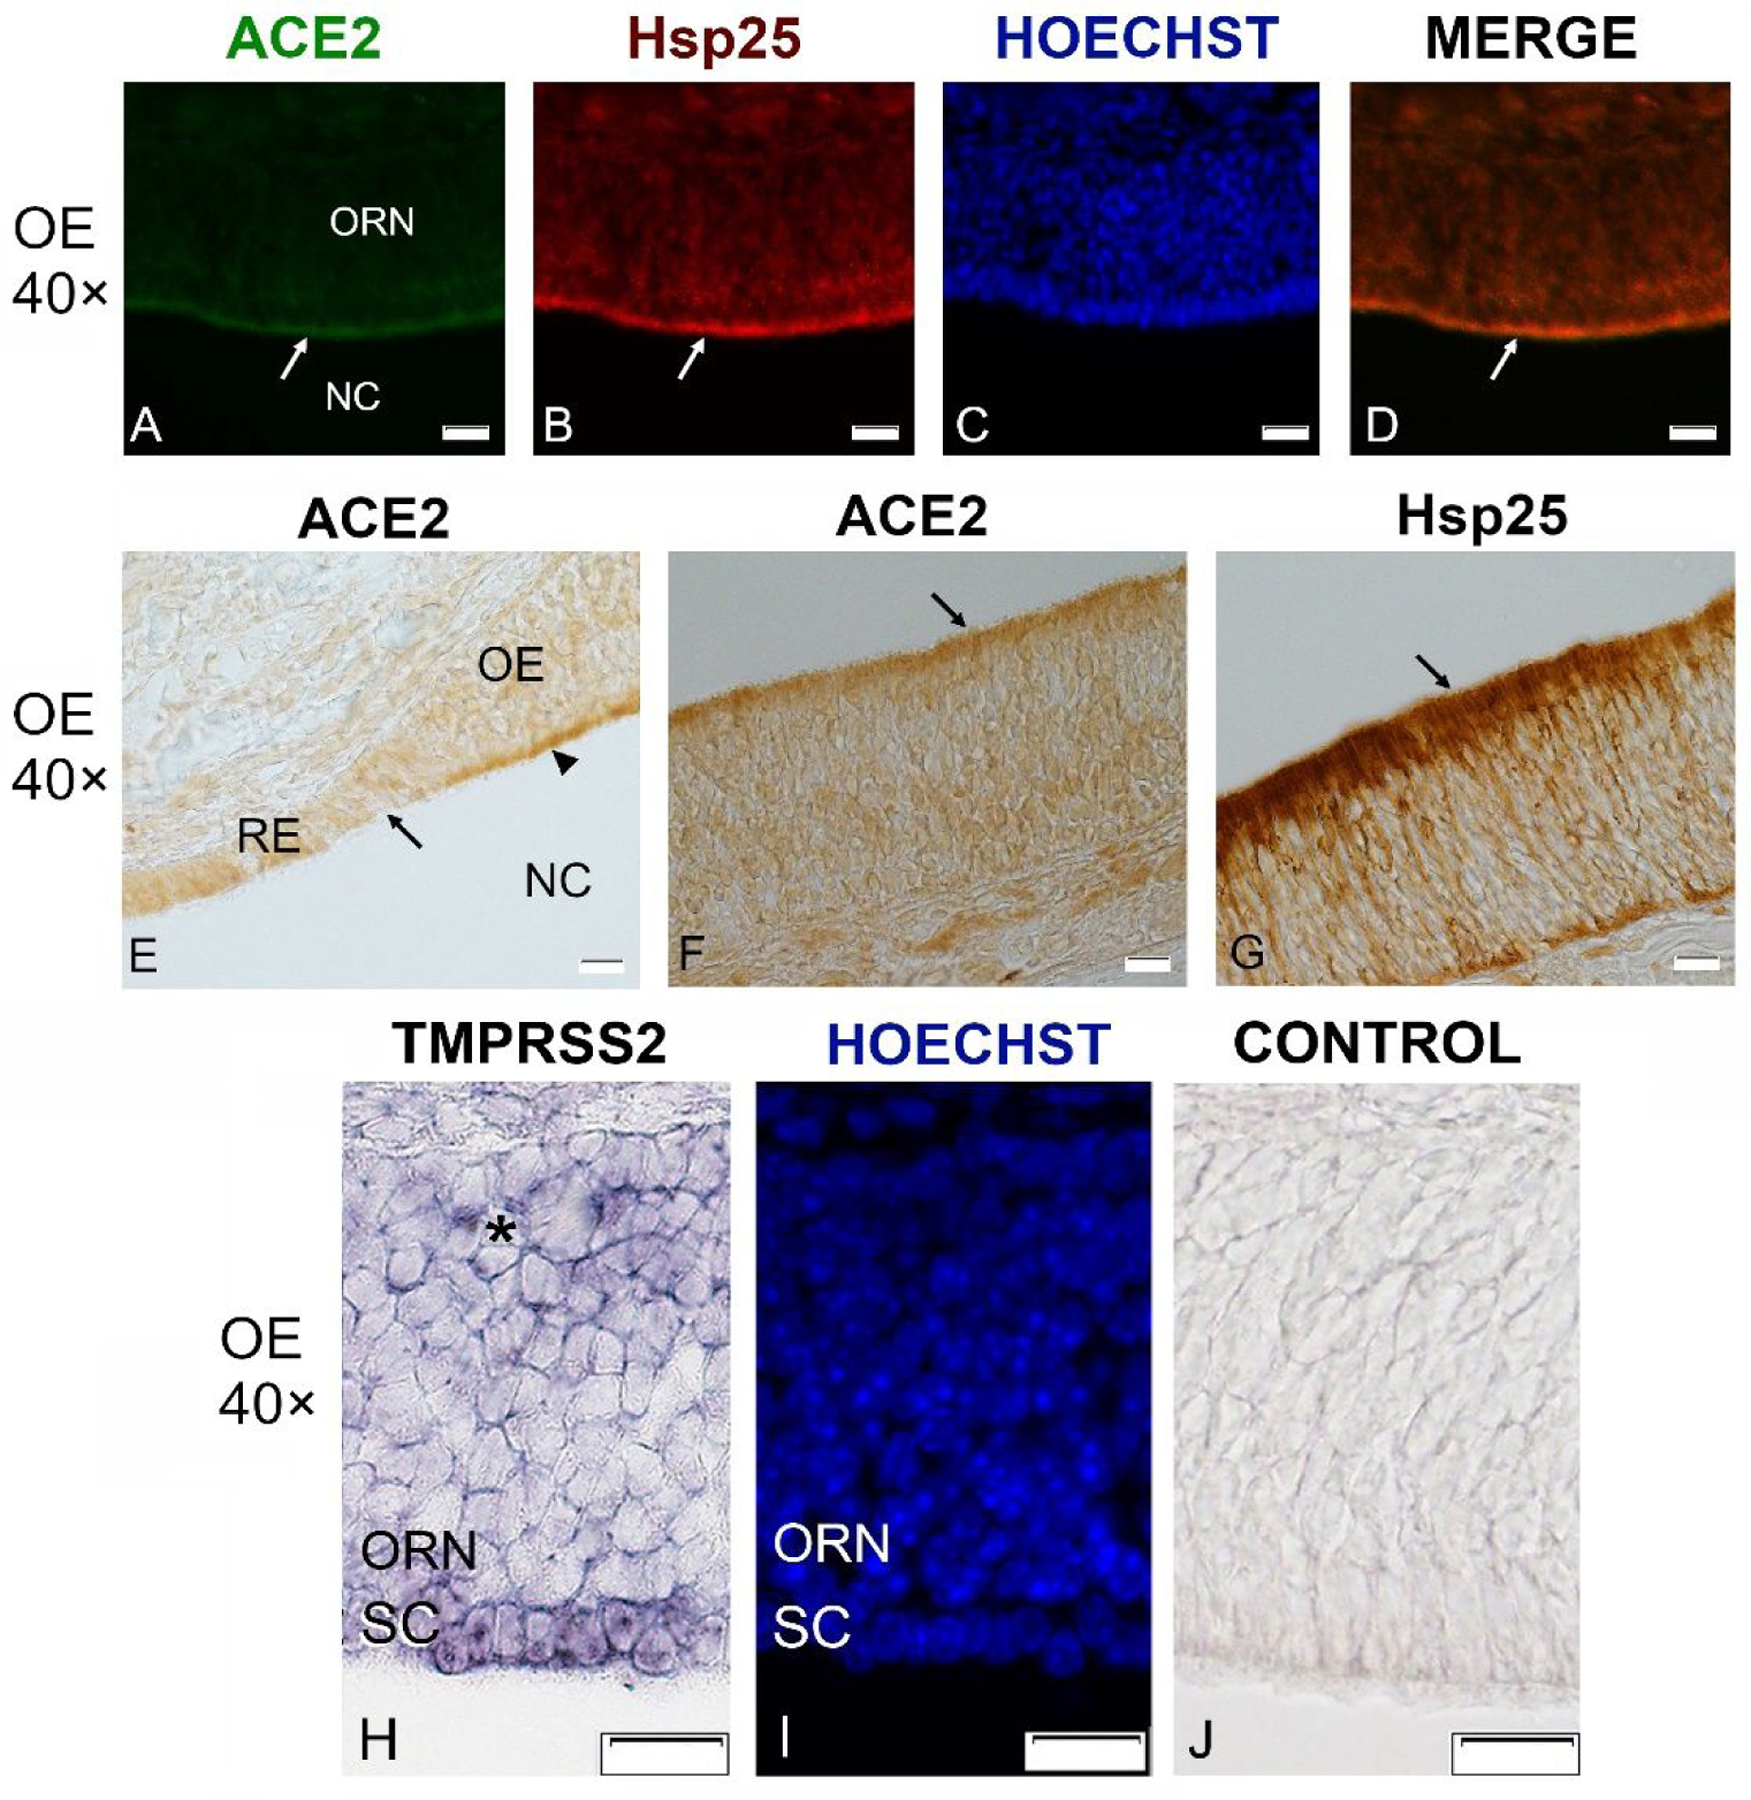
Sections through the olfactory epithelium (OE) probed with antibodies against ACE2 (21115-1-AP, green channel) and Hsp25 (red channel), and with in situ hybridization for TMPRSS2 in a P21 mouse.
ACE2 immunoreactivity is visible mainly at the luminal surface of the OE (A, arrow) where Hsp25 antibodies label sustentacular cells (B, arrow). Nuclei were stained with Hoechst 33258 (C, I). Merging of ACE2 and Hsp25 signal shows that the two fluorescence signals largely overlap (D, arrow). Section stained at the border between the respiratory epithelium (RE) and olfactory epithelium (OE) reveals much stronger labeling of the OE (arrowhead) as compared to the RE (E). ACE2 labeling using chromogenic DAB-based visualization shows the same localization at the OE surface (F). Hsp25 shows the same localization but much stronger label (G). In situ hybridization for TMPRSS2 produces label in the sustentacular cells (SC), but very little or no label in the mature olfactory receptor neurons (ORN), and label in only a few cells of the deeper layers of OE where immature olfactory neurons are located (asterisk, H). The same section is stained with Hoechst to show the nuclei (I), and an adjacent section is the sense control (J). NC- nasal cavity. All scale bars: 20 μm.
To localize TMPRSS2 expression in the OE, we used in situ hybridization, because available antibodies produced high background label. As shown in Fig. 5H–J, TMPRSS2 transcripts were present in the sustentacular cells and also in deeper layers of the OE, which includes immature ORNs and stem cells, but label was low or non-existent in mature ORNs. This localization clarifies previous controversies about TMPRSS2 expression in the OE,10–12,14,18 by confirming low expression in mature ORNs.18 TMPRSS2 expression in deeper layers of the OE is consistent with some of the RNAseq studies.10,11,18
In summary, our mouse model shows that with older age, amounts of ACE2 protein increase in the OE, as does gene expression of TMPRSS2, the two SARS-CoV-2 host receptors. This may explain why animals (and humans) are more susceptible to COVID-19 infection when they reach old age.27 In mice, we have identified the sustentacular cells as the cell type in the OE which expresses both SARS-CoV-2 host receptors required for cell entry. Our results suggest that SARS-CoV-2 virus accumulates in sustentacular cells first and, by interfering with their metabolism, affects the function of olfactory receptor neurons. The damage to these cells caused by the virus may impair smell sensation as is often observed in COVID-19 patients. Whether the virus may be transferred from sustentacular cells to olfactory receptor neurons requires further studies. The dendrites of olfactory receptor neurons are enwrapped by sustentacular cells, and such contacts may engage in cross-communication by exosomes.28 Herpes viruses can hijack host exosomes to infect neighboring cells.29 Therefore, further investigations are needed to verify the sustentacular cells as a primary SARS-CoV-2 target in the human OE and to examine whether the virus can pass from sustentacular cells to olfactory neurons with a potential route to infect the brain. An additional important finding of our work is that the murine OE contains a more intense accumulation of ACE2 protein than the respiratory epithelium. If this is true for the human OE, then the OE (and specifically the sustentacular cells) rather than the respiratory epithelium may be most susceptible to SARS-CoV-2 infection, and for this reason may be the most relevant source of tissues to detect COVID-19 infection in early stages and in asymptomatic carriers. This could reduce the rate of false negative tests in early and in asymptomatic cases of COVID-19.
Methods
Animals and tissue processing
A total of 16 C57BL/6J mice (Jackson Laboratory) were used to obtain tissue material for experiments. Mice were housed at 12/12h light/dark cycle and given access to water and food ad libitum. All animal experiments were approved by the local ethics committee for animal research at Bydgoszcz (Poland). Immediately after cervical dislocation the mice were exsanguinated and tissues dissected. Olfactory epithelium and brain was frozen at −80°C for storage and further used or fixed 3 h at 4°C in 4% (w/v) paraformaldehyde in PBS (pH 7.4) and was then incubated in 25% (w/v) sucrose/PBS at 4°C for 16–24 h, frozen in Tissue-Tek O.C.T. (Sakura Finetek) and cryosectioned at 10 μm.
RNAseq gene expression profiling
PolyA mRNA was isolated using Dynabeads purification kit (Thermo Scientific). Libraries were constructed using standard Illumina protocol. Olfactory mucosa mRNA profiles of 2-month old and 2-year old wild-type male mice were generated by deep sequencing, in triplicate, using Illumina NovaSeq6000. To verify the quality of RNA-Seq data, the 100 most abundant genes were taken from all samples and heatmaps were generated to observe the relation between samples/conditions. The sequence reads that passed the quality filters were analyzed at the transcript isoform level with TopHat followed by Cufflinks. Using our data analysis workflow, we mapped at least 30 million sequence reads per sample to the mouse genome (build mm10) and identified 25,867 transcripts in the olfactory epithelium of WT with TopHat workflow. All raw data were submitted to GEO database (accession GSE147771).
Reverse-transcription polymerase chain reaction
Total RNA was extracted from frozen tissue samples using Qiagen RNeasy plus mini kit with on-column DNAase I digestion according to the manufacturer’s protocol. About 1 μg of total RNA was used for cDNA synthesis using Maxima first strand cDNA synthesis kit (Thermo Scientific). Real-time qPCR reactions were performed on PikoReal 96 real-time PCR apparatus (Thermo Scientific) with 5x hot FIREPol EvaGreen qPCR mix plus (Solis Biodyne). PCR primers were obtained through Harvard PrimerBank (www.pga.mgh.harvard.edu). The following primers were used for relative gene expression quantification:
ACE2-qF1 5’-TCCAGACTCCGATCATCAAGC-3’
ACE2-qR1 5’-GCTCATGGTGTTCAGAATTGTGT-3’;
TMPR2-qF1 5’-CAGTCTGAGCACATCTGTCCT-3’
TMPR2-qR1 5’-CTCGGAGCATACTGAGGCA-3’
TMPR4-qF1 5’-CCAACCCCTCAACAACCGT-3’
TMPR4-qR1 5’-CTCAGCAGCACTGCAATGAT-3’
GAPDH-F1 5’-ATGACATCAAGAAGGTGGTG-3’
GAPDH-R1 5’-CATACCAGGAAATGAGCTGG-3’
BACTIN-F1 5’-ACTCTTCCAGCCTTCCTTC-3’
BACTIN-R1 5’-ATCTCCTTCTGCATCCTGTC-3’
Gene expression was normalized to GAPDH or to beta actin, with similar results. Data were analyzed by the comparative Ct method using the Ct values and the average value of PCR efficiencies obtained from LinRegPCR software. Ct values obtained for GAPDH and actin were in the range of 15–19 cycles, and Ct values obtained for ACE2, TMPRSS2 and TMPRSS4 were in the range of 22–32 cycles. Real-time PCR experiments were performed at least in triplicate and the results were analyzed using GraphPad Prism software and unpaired two-tailed Student’s t test. Results are presented as mean ± SEM.
Western blotting
ACE2 protein in tissue homogenates was detected by Western blotting. Briefly, frozen tissue was homogenized on ice in N-Per Total Protein Extraction reagent (Thermo Scientific) with addition of protease and phosphatase inhibitor cocktails (Sigma-Aldrich). Homogenates were centrifuged at 20,000 g at 4°C and supernatants were collected. Protein content was measured by BCA method (Thermo Scientific). Equal amounts of total proteins were mixed with 4x Laemmli sample buffer and boiled for 10 min at 80°C. Protein extracts were separated on 8% SDS-PAGE denaturing acrylamide gels using approximately 35 μg of total protein per lane and then blotted to nitrocellulose membrane (0.45 μm, Amersham) using standard Tris-glycine wet method. Membranes were blocked with 5% dry milk (Bio-Rad), incubated with anti-ACE2 (Proteintech #21115-1-AP or R&D Systems, #AF3437) at 1/1000 or anti-GAPDH (Proteintech #10494-1-AP) at 1/5000 dilution rabbit polyclonal antibodies overnight at 4°C, washed several times in TBST buffer (pH 8.0) and incubated 60 min with secondary anti-rabbit-HRP antibody (Pierce). Signal was detected using Clarity chemiluminescence substrate (Bio-Rad). Blots were repeated at least three times with comparable results. Densitometric band analysis was performed by Un-scan-it software (Silk Scientific, Inc) on 3 independent blots using GAPDH band for relative comparisons.
Immunocytochemistry and colocalization analysis
For single immunofluorescence labeling frozen sections cut at 10 μm were stained overnight with primary anti-ACE2 (Proteintech 21115-1-AP) at 1/400 dilution, sections were washed 5 times in PBST (0.05% Triton X-100) and incubated with secondary anti-rabbit-AF488 antibody (Jackson) at 1/500 dilution. Next, sections were stained 5 min at RT in Hoechst 33258 (Sigma-Aldrich) and embedded in anti-fade medium (Vector labs). Alternatively, cryosections were stained with anti-ACE2 goat polyclonal Ab at 1/500 (R&D Systems AF3437). Labeling with anti-HSP25/27 (Proteintech # 18284-1-AP) was performed using serial sections on the same slide as labeling for anti-ACE2. The protocol was the same as for single labeling but dilution of the primary anti-HSP25/27 antibody was 1/400. For double labeling, sections were probed overnight at 4°C with antiACE2 at 1/400 and anti-OMP (Wako, #544-10001) at 1/500 dilution in PBST, followed by 5 washes and incubation with mixture of anti-rabbit-AF594 and anti-goat-AF488 at dilution 1/500 in PBST. After staining with Hoechst 33258, sections were embedded in anti-fade medium. Immunocytochemistry for light microscopy was performed using ImmPRESS HRP reagent kit (Vector Laboratories, # MP-7401) following the manufacturer’s protocol. Dilutions of primary anti-ACE2 and anti-HSP25/27 antibodies were the same as for immunofluorescence experiments. After immunocytochemical reactions, sections were analyzed on a Nikon Eclipse 80i microscope and images were taken using a Nikon DP80 camera. Microscopic images were processed using CellSense software (Nikon corp).
In-situ hybridization
Frozen tissue sections obtained from mice at PD21 were prehybridized, hybridized, and washed as described previously.30 Sense and anti-sense Digoxigenin-labeled cRNA probes specific for TMPRSS2 were generated by transcription in vitro using murine TMPRSS2 cDNA fragment (NCBI reference NM_01577.2) located between 5’-GAGGAAAGCCTGGTATCCCG-3’ (F) and 5’-AAATGCCGTCCAGTACCTCG-3’ (R) and subcloned into pGEM-T easy plasmid (Promega). SP6 and T7 RNA polymerases (Roche) and Dig-labeled ribonucleotide mix (Roche) were used according to the manufacturer’s protocol. To increase tissue penetration the final probe size was reduced by hydrolysis in sodium carbonate to approximately 250–300 nt. Sections were developed using anti-Digoxigenin Fab fragments antibody (Roche) and NBT/BCIP chromogenic alkaline phosphatase substrates in the presence of endogenous alkaline phosphatase inhibitor.
Acknowledgments
The authors would like to thank Krzysztof Bilinski for help in developing the graphics and Agnieszka Wyszomirska for assisting in microscopy despite her busy schedule.
Funding Sources
RB was supported by by a grant of Polish National Science Centre (UMO-2013/09/B/NZ3/02359) C.S.v.B. was supported by the National Institute of General Medical Sciences of the National Institutes of Health under grant number GM103554.
References
- (1).Lechien JR, Chiesa-Estomba CM, De Siati DR, Horoi M, Le Bon SD, Rodriguez A, Dequanter D, Blecic S, El Afia F, Distinguin L, Chekkoury-Idrissi Y, Hans S, Delgado IL, Calvo-Henriquez C, Lavigne P, Falanga C, Barillari MR, Cammaroto G, Khalife M, Leich P, Souchay C, Rossi C, Journe F, Hsieh J, Edjlali M, Carlier R, Ris L, Lovato A, De Filippis C, Coppee F, Fakhry N, Ayad T, Saussez S (2020) Olfactory and gustatory dysfunctions as a clinical presentation of mild-to-moderate forms of the coronavirus disease (COVID-19): a multicenter European study [Apr 6]. Eur Arch Otorhinolaryngol 2020;10.1007/s00405-020-05965-1. doi: 10.1007/s00405-020-05965-1 [Epub ahead of print] [DOI] [PMC free article] [PubMed]
- (2).Moein ST, Hashemian SMR, Mansourafshar B, Khorram-Tousi A, Tabarsi P, Doty RL (2020) Smell dysfunction: a biomarker for COVID-19. Int Forum Allergy Rhinol 2020 Apr 17. doi: 10.1002/alr.22587. [Epub ahead of print] [DOI] [PMC free article] [PubMed]
- (3).Netland J, Meyerholz DK, Moore S, Cassell M, Perlman S (2008) Severe acute respiratory syndrome coronavirus infection causes neuronal death in the absence of encephalitis in mice transgenic for human ACE2. J. Virol 82(5):7264–75. [DOI] [PMC free article] [PubMed] [Google Scholar]
- (4).Baig AM, Khaleeq A, Ali U, Syeda H (2020) Evidence of the COVID-19 virus targeting the CNS: host-virus interactions and proposed neurotropic mechanisms. ACC Chem. Neurosci 11(7):995–998. doi: 10.1021/acschemneuro.0c00122 [DOI] [PubMed] [Google Scholar]
- (5).Mao L, Jin H, Wang M, Yu H, Chen S, He Q, Chang J, Hong C, Zhou Y, Wang D, Miao X, Li Y, Hu B (2020) Neurological manifestations of hospitalized patients with coronavirus disease 2019 in Wuhan, China. JAMA Neurol doi: 10.1001/jamaneurol.2020.1127. (ahead of print) [DOI] [PMC free article] [PubMed]
- (6).Butowt R, Bilinska K (2020) SARS-CoV-2: SARS-CoV-2: Olfaction, brain infection and the urgent need for clinical samples allowing earlier virus detection. ACS Chem. Neurosci 10.1021/acschemneuro.0c00172 [DOI] [PubMed]
- (7).Hoffmann M, Kleine-Weber H, Schroeder S, Kruger N, Herrler T, Erichsen S, Schiergens ES, Herrler G, Wu N-H, Nitsche A, Muller MA, Drosten C, Pohlman S (2020) SARS-CoV-2 cell entry depends on ACE2 and TMPRSS2 and is blocked by a clinically proven protease inhibitor. Cell 181(2):271–280. doi: 10.1016/j.cell.2020.02.052. [DOI] [PMC free article] [PubMed] [Google Scholar]
- (8).Sungnak W, Huang N, Bécavin C, Berg M & Network HCALB (2020) SARS-CoV-2 entry genes are most highly expressed in nasal goblet and ciliated cells within human airways. arXiv preprint arXiv:2003.06122
- (9).Zou X, Chen K, Zou J, Han P, Hao J, Han Z (2020) Single-cell RNAseq data analysis on the receptor ACE2 expression reveals the potential risk of different human organs vulnerable to 2019-nCoV infection. Front. Med doi: 10.1007/s11684-020-0754-0. (ahead of print) [DOI] [PMC free article] [PubMed]
- (10).Nickell MD, Breheny P, Stromberg AJ, McClintock TS (2012) Genomics of mature and immature olfactory sensory neurons. J Comp Neurol 520(12):2608–29. doi: 10.1002/cne.23052. [DOI] [PMC free article] [PubMed] [Google Scholar]
- (11).Krolewski RC, Packard A, Schwob JE (2013) Global expression profiling of globose basal cells and neurogenic progression within the olfactory epithelium. J Comp Neurol 521(4):833–59. doi: 10.1002/cne.23204. [DOI] [PMC free article] [PubMed] [Google Scholar]
- (12).Kanageswaran N, Demond M, Nagel M, Schreiner BS, Baumgart S, Scholz P, Altmüller J, Becker C, Doerner JF, Conrad H, Oberland S, Wetzel CH, Neuhaus EM, Hatt. H, Gisselmann G (2015) Deep sequencing of the murine olfactory receptor transcriptome. PLoS One 10(1):e0113170 doi: 10.1371/journal.pone.0113170. [DOI] [PMC free article] [PubMed] [Google Scholar]
- (13).Saraiva LR, Ibarra-Soria X, Khan M, Omura M, Scialdone A, Mombaerts P, Marioni JC, Logan DW (2015) Hierarchical deconstruction of mouse olfactory sensory neurons: from whole mucosa to single-cell RNA-seq. Sci Rep 5:18178. doi: 10.1038/srep18178. [DOI] [PMC free article] [PubMed] [Google Scholar]
- (14).Olender T, Keydar I, Pinto JM, Tatarskyy P, Chien MS, Fischilevich S, Restrepo D, Gilad Y, Lancet D (2016) The human olfactory transcriptome. BMC Genomics 17, 619, doi: 10.1186/s12864-016-2960-3. [DOI] [PMC free article] [PubMed] [Google Scholar]
- (15).Fletcher R,B., Das D, Gadye L, Street KN, Baudhuin A, Wagner A, Cole MG, Flores Q, Choi YG, Yosef N, Purdom E, Dudoit S, Risso D, Ngai. J (2017) Deconstructing olfactory stem cell trajectories at single-cell resolution. Cell Stem Cell 20:817–830. doi: 10.1016/j.stem.2017.04.003. [DOI] [PMC free article] [PubMed] [Google Scholar]
- (16).Deprez M, Zaragosi l.E., Truchi T, Ruiz Garcia S, Arguel M-J, Lebrigand MJ, Paquet A, Pee’r D, Marquette C-H, Leroy S, Barbry P (2019) A single-cell atlas of the human healthy airways. bioRxiv 24, 3000–3049, doi: 10.1101/2019.12.21.884759. [DOI] [PubMed] [Google Scholar]
- (17).Durante MA, Kurtenbach S, Sargi ZB, Harbour JW, Choi R, Goss GM, Matsunami H, Goldstein BJ (2020) Single-cell analysis of olfactory neurogenesis and differentiation in adult humans. Nat. Neurosci 23(3):323–326. doi: 10.1038/s41593-020-0587-9. [DOI] [PMC free article] [PubMed] [Google Scholar]
- (18).Brann DH, Tsukahara T, Weinreb C, Logan DW, Datta SR (2020) Non-neural expression of SARS-CoV-2 entry genes in the olfactory epithelium suggests mechanisms underlying anosmia in COVID-19 patients. bioRxiv preprint doi: 10.1101/2020.03.25.009084 [DOI] [PMC free article] [PubMed]
- (19).Fodoulian L, Tuberosa J, Rossier D, Landis BN, Carleton A, Rodriguez I (2020) SARS-CoV-2 receptor and entry genes are expressed by sustentacular cells in the human olfactory neuroepithelium. bioRxiv preprint doi: 10.1101/2020.03.31.013268 [DOI] [PMC free article] [PubMed]
- (20).Heydel J-M; Coelho A, Thiebaud N, Legendre A, Bon A-M, Faure P, Neiers F, Artur Y, Golebiowski J, Briand (2013) Odorant-binding proteins and xenobiotic metabolizing enzymes: Implications in olfactory perireceptor events. Anat. Rec. (Hoboken) 296(9):1333–1345. doi: 10.1002/ar.22735 [DOI] [PubMed] [Google Scholar]
- (21).Hughes TR ‘Validation’ in genome-scale research. (2009) J. Biol 8(1):3. doi: 10.1186/jbiol104. [DOI] [PMC free article] [PubMed] [Google Scholar]
- (22).Zhang Y, Chen K, Sloan SA., Bennett ML, Scholze AR, O’Keeffe S, Phatnani HP, Guarnieri P, Caneda C, Ruderisch N, Deng S, Liddelow SA, Zhang C, Daneman R, Maniatis T, Barres BA, Wu JQ. (2014) An RNA-sequencing transcriptome and splicing database of glia, neurons, and vascular cells of the cerebral cortex. J. Neurosci 34(36):11929–47. doi: 10.1523/JNEUROSCI.1860-14.2014. [DOI] [PMC free article] [PubMed] [Google Scholar]
- (23).Doobay MF, Talman LS, Obr TD, Tian X, Davisson RL, Lazartigues E (2007) Differential expression of neuronal ACE2 in transgenic mice with overexpression of the brain renin-angiotensin system. Am. J. Physiol. Regul. Integr. Comp. Physiol 292:R373–R381. [DOI] [PMC free article] [PubMed] [Google Scholar]
- (24).Kar S, Gao L, Zucker IH (2010) Exercise training normalizes ACE and ACE2 in the brain of rabbits with pacing-induced heart failure. J. Appl. Physiol 108:923–932. [DOI] [PMC free article] [PubMed] [Google Scholar]
- (25).Strotmann J, Breer H (2011) Internalization of odorant-binding proteins into the mouse olfactory epithelium. Histochem Cell Biol 136(3):357–69. doi: 10.1007/s00418-011-0850-y. [DOI] [PubMed] [Google Scholar]
- (26).Ruiz Garcia S, Deprez M, Lebrigand K, Cavard A, Paquet A, Arguel M-J, Zaragosi L-E (2019) Novel dynamics of human mucociliary differentiation revealed by single-cell RNA sequencing of nasal epithelial cultures. Development 146(20): pii: dev177428. doi: 10.1242/dev.177428. [DOI] [PMC free article] [PubMed] [Google Scholar]
- (27).Bi Q, Wu Y, Mei S, Ye C, Zou X, Zhang Z, Liu X, Wei L, Truelove SA, Zhang T, Gao W, Cheng C, Tang X, Wu X, Wu Y, Sun B, Huang S, Sun Y, Zhang J, Ma T, Lessler J, Feng T (2020) Epidemiology and Transmission of COVID-19 in Shenzhen China: Analysis of 391 cases and 1,286 of their close contacts. medRxiv preprint 10.1101/2020.03.03.20028423doi [DOI] [PMC free article] [PubMed]
- (28).Liang F (2018) Olfactory receptor neuronal dendrites become mostly intra-sustentacularly enwrapped upon maturity. J. Anat 232:674–685. doi: 10.1111/joa.12777. [DOI] [PMC free article] [PubMed] [Google Scholar]
- (29).Sadeghipour S, Mathias RA (2017) Herpesviruses hijack host exosomes for viral pathogenesis. Semin. Cell Dev. Biol 67:91–100. doi: 10.1016/j.semcdb.2017.03.005. [DOI] [PubMed] [Google Scholar]
- (30).Login H, Butowt R, Bohm S (2015) Activity-dependent and graded BACE1 expression in the olfactory epithelium is mediated by the retinoic acid metabolizing enzyme CYP26B1. Brain Struct Funct 220(4):2143–57. doi: 10.1007/s00429-014-0783-z. [DOI] [PubMed] [Google Scholar]