Interleukin 6 regulates the expression of programmed cell death ligand 1 in thyroid cancer (original) (raw)
Abstract
Programmed cell death ligand 1 (PD‐L1), inducing T cell exhaustion to facilitate immune escape of tumor cells, is upregulated by interleukin 6 (IL‐6) in T cell lymphoma and ovarian cancer. The purpose of this study is to investigate the expression of IL‐6 and PD‐L1 in thyroid cancer, and whether IL‐6 regulates PD‐L1 expression. As a result, IL‐6 and PD‐L1 were highly expressed in thyroid cancer tissues. Multivariate logistic analysis showed that tumor size, distant metastasis, and risk stratification were significantly associated with IL‐6 expression (P < .05), and multifocality, lymph node metastasis, distant metastasis, risk stratification, and IL‐6 expression were identified as the independent predictors of PD‐L1 expression (P < .05). The invasiveness of thyroid cancer was significantly enhanced after IL‐6 treatment or PD‐L1 overexpression. PD‐L1 positive rate correlated with IL‐6 expression in cancer tissues (P < .001), and after IL‐6 treatment, the PD‐L1 expression in TPC‐1 and BCPAP significantly increased. The mitogen‐activated protein kinase pathway (MAPK) and the Janus‐activated kinase (JAK)–signal transducers and activators of transcription 3 (STAT3) signaling pathways were activated by IL‐6, and the IL‐6–induced PD‐L1 expression decreased after treatment with these two signaling pathway inhibitors. Knockdown of transcription factors c‐Jun and stat3 suppressed the expression of PD‐L1 induced by IL‐6, and these two factors could bind to PD‐L1 gene promoter directly and promote its transcription. It is concluded that IL‐6 and PD‐L1 are overexpressed in thyroid cancer and are related to tumor invasiveness. IL‐6 upregulates PD‐L1 expression through the MAPK and JAK‐STAT3 signaling pathways, which function via transcription factors c‐Jun and stat3.
Keywords: IL‐6, mechanism, PD‐L1, regulation, thyroid cancer
IL‐6 and PD‐L1 are highly expressed in thyroid cancer and correlate with disease aggressiveness. IL‐6 activates the MAPK and JAK‐STAT3 signaling pathways in thyroid cancer. In addition, IL‐6 promotes PD‐L1 transcription through the MAPK and JAK‐STAT3 signaling pathways, which function via transcription factors c‐Jun and stat3.

Abbreviations
AKT
protein serine‐threonine kinase
ERK
extracellular signal–regulated kinase
GAPDH
glyceraldehyde‐3‐phosphate dehydrogenase
IL‐6
interleukin 6
JAK
Janus‐activated kinase
JNK
C‐Jun NH(2)–terminal kinase
MAPK
mitogen‐activated protein kinase
PD‐1
programmed cell death 1
PD‐L1
programmed cell death ligand 1
PI3K
phosphatidylinositol 3–kinase
SiRNA
small interfering RNA
STAT3
signal transducers and activators of transcription 3
TAM
tumor‐associated macrophage
1. INTRODUCTION
Thyroid cancer is the most common endocrine malignancy, accounting for 1.5% of all newly diagnosed human cancers, with incidence rate on the rise. 1 It has been well established that tumor microenvironment, the primary location where tumor cells communicate with the outside, is closely correlated with tumor initiation and progression. Tumor microenvironment is mainly composed of innate immune cells, adaptive immune cells and stromal cells, 2 all of which could secrete cytokines. Cytokines are small molecular peptides or glycoproteins which mediate the intercellular interactions in a paracrine or autocrine manner, regulating the proliferation, differentiation, and survival of targeted cells. 3 Depending on function, cell target, and structure, cytokines are classified into several categories, including interleukins, chemokines, and lymphokines. 4 Secreted cytokines that bind to specific receptors and act as mediators in the communication among leukocytes are called interleukin. 5 IL‐6, a glycoprotein which is composed of 184 amino acids and consists of four long a‐helices, 6 , 7 could be produced by innate immune cells such as macrophages and monocytes, mesenchymal cells, and fibroblasts. 8 It was originally discovered to regulate the differentiation of B‐cells. 9 Since its high expression was found in serum and tumor tissues of many cancers, researchers have paid more and more attention to its promoting effects on tumor. It is highly expressed in almost all kinds of cancer 10 and plays a critical role in tumorigenesis and progression. 11 The serum level of IL‐6 is also reported to be significantly higher in thyroid cancer patients than in healthy control or patients with benign diseases, and it is associated with disease aggressiveness and poor survival of patients with differentiated thyroid cancer. 12 However, the exact roles of this proinflammation cytokine in thyroid cancer microenvironment have hardly been studied.
Programmed cell death ligand 1 (PD‐L1) is one of the immune checkpoints, which could be detected on the membrane of immune cells, epithelial cells, and tumor cells. Its main receptor, programmed cell death protein 1 (PD‐1), acts as a coinhibitory receptor on the surface of antigen‐stimulated T‐cells. When the extracellular domains of PD‐L1 and PD‐1 recognize each other, the PD‐1 cytoplasmic immune receptor tyrosine–based inhibitory motif is activated to transfer a negative regulatory signal to T‐cells, 13 inhibiting proliferation, survival, and cytokine production. The PD‐L1 pathway promotes immune escape of tumor cells through inducing T‐cell apoptosis, anergy, and exhaustion. In addition, PD‐L1 has also been found to play a tumor‐protective role in CD8+ cytotoxic T‐cell–mediated killing and apoptosis induced by Fas ligation or protein kinase inhibitor. 14 It has been reported that PD‐L1 is expressed in thyroid cancer, 15 , 16 and PD‐L1 expression is associated with tumor aggressiveness and could predict poor survival. 17 , 18 This molecule plays an important role in the development of thyroid cancer and is a potential target for therapy. However, the regulatory mechanism of its expression has not been fully elucidated, which impedes the progress of tumor treatment. It has been reported that PD‐L1 is upregulated by IL‐6 in dendritic cells, cutaneous T‐cell lymphoma, and ovarian cancer, 19 , 20 , 21 but it has never been studied in thyroid cancer. Therefore, the purpose of this study is to investigate the expression levels of IL‐6 and PD‐L1 in thyroid cancer, and whether IL‐6 is involved in the regulation of PD‐L1 expression.
2. MATERIALS AND METHODS
2.1. Patients and immunohistochemistry (IHC)
The present study was performed at Shanghai Jiao Tong University Affiliated Sixth People's Hospital and was approved by the Ethics Committee of it. A total of 100 patients diagnosed with papillary or follicular thyroid cancer were included in this study. IHC staining was performed on the tissue microarrays with primary antibody against IL‐6 (Abcam, ab9324) and PD‐L1 (CST, #13684). Staining results were analyzed by two pathologists. The IHC score was assigned based on staining intensity and percentage of positive cells. The intensity score was assigned as 0 (no staining), 1 (weak staining), 2 (moderate staining), and 3 (strong staining). The proportion score of positive cells was defined as 0 (<5%), 1 (6‐25%), 2 (26‐50%), 3 (51‐75%), and 4 (>75%). The final score was obtained by the multiplication of the intensity and proportion scores, ranging from 0 to 12. For statistical analysis, the cutoff value of 6 was selected to divide the low‐expression (with the final score < 6) and the high‐expression group (with the final score ≥ 6). 18
2.2. Double immunofluorescence analysis
Immunofluorescence colocalization experiments were performed on three thyroid cancer specimens to observe the positional relationship between IL‐6 and M2‐phenotype macrophages within the tumor. Briefly, the tumor tissue sections were incubated with primary antibodies against IL‐6 (21865‐1‐AP, Proteintech Group Inc) and CD206 (18704‐1‐AP, Proteintech Group Inc), a specific marker of the M2 phenotype, and then incubated with Alexa Fluor 492–labelled donkey anti‐rabbit IgG(H + L) and Alexa Fluor 550–labelled donkey anti‐rabbit IgG(H + L). Nuclei were counterstained with DAPI. Fluorescent images were obtained by a confocal laser‐scanning microscope (Ti2‐E‐A1, Nikon).
2.3. Cell lines, reagents, and transfection
Two human thyroid cancer cell lines, TPC‐1 and BCPAP, were purchased from the Chinese Academy of Sciences. All cell lines had been tested and authenticated by DNA analysis. TPC‐1 and BCPAP cells were cultured in Roswell Park Memorial Institute (RPMI)‐1640 medium (HyClone) supplemented with 10% fetal bovine serum (FBS; Gibco). IL‐6 was obtained from R&D systems (206‐IL/CF). U0126, SP600125, and Ruxolitinib were obtained from MedChemExpress (MCE) Company. After being planted for 24 hours, tumor cells were transfected with siRNA for 6 hours using Lipofectamine 2000 (Invitrogen) according to the manufacturer's protocol. All siRNAs were purchased from Asia‐Vector Biotechnology Co. Ltd. After transfection, the cells were cultured for another 48 hours, and the knockout efficiency was detected by qPCR. PD‐L1 overexpression in TPC‐1 and BCPAP was achieved by transfection with pcDNA3.1 (Asia‐Vector Biotechnology Co. Ltd) using Lipofectamine 2000, and the transfection efficiency was illustrated by observing green fluorescent protein under fluorescence microscopy.
2.4. Transwell invasion assay
Invasion assays were performed in Transwell chambers (Costar, Corning Inc) coated with Matrigel (BD Biosciences) on the upper surface. Tumor cells were harvested, suspended in serum‐free medium, and plated into the upper chamber for the invasion assays; medium supplemented with 20% FBS was placed into the lower chamber. After 24 hours of incubation, the cells which invaded through the membrane to the lower surface were fixed, stained, and counted under an inverted microscope.
2.5. Western blotting
Western blotting was performed as described previously. 22 Primary antibodies included anti‐PD‐L1 antibody (CST, #13684), anti‐ERK antibody (CST, #4695), anti‐p‐ERK antibody (CST #4370), anti‐JNK antibody (CST, #9252), anti‐p‐JNK antibody (CST, #4669), anti‐c‐Jun antibody (Abcam, ab31419), anti‐p‐c‐Jun antibody (Abcam, ab32385), anti‐JAK antibody (CST, #3230), anti‐stat3 antibody (CST, #9139), anti‐p‐stat3 antibody (CST, #9145), anti‐AKT antibody (CST, #4695), and anti‐p‐AKT antibody (CST, #4695). HRP‐conjugated secondary antibodies included anti‐mouse IgG (CST, #7076) and anti‐rabbit IgG (CST, #7074). All antibodies were stored in −20°C.
2.6. Quantitative polymerase chain reaction (qPCR)
Total RNA was extracted from TPC‐1 and BCPAP cells by TRIzol Reagent (Invitrogen; Thermo Fisher Scientific, Inc) with the instructions provided by the manufacturer. RNA concentration and purity were evaluated by a Qubit Fluorometer (Thermo Fisher Scientific, Inc). The first‐strand cDNA was synthesized by a total of 1 μg RNA using a reverse transcription kit (TransGen Biotech). qPCR was performed on the Applied Biosystems 7500 Real‐Time PCR System (Applied Biosystems). All primers were synthesized by Sangon Biotech Co., Ltd, and their sequences are listed in Table S1. The reaction system consisted of 4.0 μL cDNA, 25 μL SYBR Green, 4.0 μL of primers, and PCR‐grade water to the final total volume of 50 μL. The PCR thermocycling conditions included a predenaturation at 95°C for 30 seconds, and 40 cycles of 95°C for 5 seconds and 60°C for 30 seconds. The fold change for each gene is calculated using the 2−ΔΔCq method, and the expression levels were normalized to GADPH (glyceraldehyde‐3‐phosphate dehydrogenase).
2.7. Flow cytometry
The PD‐L1 membrane expression on TPC‐1 and BCPAP was quantified by flow cytometry assay. Cells were incubated with anti‐PD‐L1 antibody (16‐5983‐82, Invitrogen; Thermo Fisher Scientific) for 30 minutes at 4°C and then washed twice with staining buffer. Three fresh thyroid cancer tissues were selected for tumor‐associated macrophage (TAM) analysis. Tissues were first minced into small pieces and digested with collagenase type IV, hyaluronidase, and DNase (Sigma) for 1 hour. After digestion, the cells extracted were washed twice in RPMI 1640 medium. The TAM population was characterized using anti‐F4/80 (#17‐4801‐80, eBioscience), and M2‐phenotype macrophage was characterized using CD206 (#12‐2069‐41, eBioscience). For intracellular IL‐6 staining of TAMs, the cells were fixed and permeabilized in fixation/permeabilization solution and stained with FITC‐anti‐IL‐6 (#11‐7069‐81; eBioscience) according to the manufacturer's instructions. The cells were analyzed by flow cytometer (Beckman Coulter FC500) and FlowJo software.
2.8. Chromatin immunoprecipitation (CHIP)‐qPCR
The detailed experimental operations have been described previously. 23 DNA fragments were purified with a purification kit (EP101, TransGen Biotech). Input and immunoprecipitated chromatin were used as DNA templates for qPCR analysis. The primer sequences are presented in Table S2.
2.9. Statistical analysis
Statistical analysis was performed using SPSS Statistics 21.0 (SPSS Inc). The paired‐samples t test was applied to compare the expression of IL‐6 and PD‐L1 in cancer tissues and corresponding paracancer normal thyroid tissues. Multivariate logistic analysis model was used to identify independent factors which influence the expression of IL‐6 and PD‐L1. Pearson's correlation test was used to analyze the association between PD‐L1 and IL‐6 positive rate in cancer tissues. The differences among groups in Transwell invasion assay, Western blotting, flow cytometry, qPCR, and CHIP were estimated using Student's t tests or one‐way ANOVA. All tests were two‐sided, and _P_‐value < .05 was considered statistically significant.
3. RESULTS
3.1. IL‐6 and PD‐L1 overexpression enhance the invasiveness of thyroid cancer
Clinicopathological features of included patients are shown in Table S3. IHC staining results showed that IL‐6 and PD‐L1 were expressed in both thyroid cancer and normal thyroid tissues. However, the expression of these two molecules was higher in cancer tissues (P < .001, Figure 1). Based on the threshold value of 6 in a semiquantitative scoring system, patients were divided into two groups: 50 patients (50%) into the IL‐6 high‐expression group and the remaining patients (50%) into the IL‐6 low‐expression group. Multivariate logistic analysis showed that tumor size, distant metastasis, risk stratification, and PD‐L1 expression were significantly associated with IL‐6 expression (P < .05) (Table 1). From the 100 patients, 35 patients (35%) were in the PD‐L1 high‐expression group and the others (65%) in the PD‐L1 low‐expression group. Factors such as multifocality, lymph node metastasis, distant metastasis, risk stratification, and IL‐6 expression were determined as the independent predictors of PD‐L1 expression. The details are shown in Table 2. It is suggested that IL‐6 and PD‐L1 expression are associated with the invasiveness of thyroid cancer. Two cell lines TPC‐1 and BCPAP were selected to testify the above hypothesis. Transwell invasion assay was performed to investigate whether IL‐6 and PD‐L1 expression increase the invasiveness of thyroid cancer in vitro. The cell lines TPC‐1OE and BCPAPOE with PD‐L1 overexpression were constructed by plasmid transfection. Compared with the control group, after IL‐6 treatment or PD‐L1 overexpression, the invasiveness of thyroid cancer cells was significantly enhanced (Figure 2).
FIGURE 1.
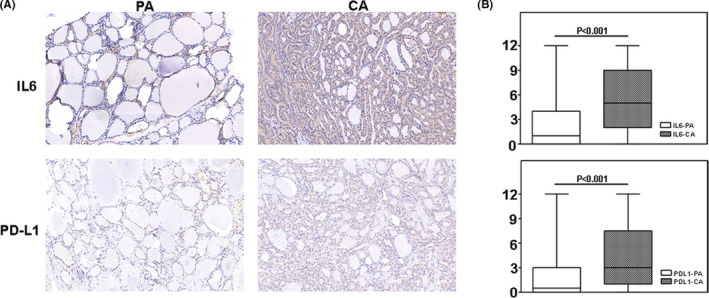
Overexpression of interleukin 6 (IL‐6) and programmed cell death ligand 1 (PD‐L1) in thyroid cancer. A, Immunohistochemistry (IHC) staining results of IL‐6 and PD‐L1 in thyroid cancer and normal control. B, IHC score results showed that IL‐6 and PD‐L1 were overexpressed in thyroid cancer. PA, para‐cancer tissues; CA, cancer tissues
TABLE 1.
The clinicopathological factors influencing IL‐6 expression by multivariate logistic analysis
| Variations | Cases | IL‐6 expression | Multivariate analysis | ||
|---|---|---|---|---|---|
| Low | High | OR (95% CI) | _P_‐value | ||
| Age (y) | |||||
| <55 | 76 | 38 | 38 | 1 | .842 |
| ≥55 | 24 | 12 | 12 | 0.885 (0.265‐2.949) | |
| Sex | |||||
| Male | 28 | 13 | 15 | 1 | .813 |
| Female | 72 | 37 | 35 | 0.881 (0.308‐2.522) | |
| Pathological type | |||||
| FTC | 14 | 8 | 6 | 1 | .082 |
| PTC | 86 | 42 | 44 | 6.095 (0.796‐46.681) | |
| Multifocality | |||||
| No | 69 | 30 | 39 | 1 | .050 |
| Yes | 31 | 20 | 11 | 0.335 (0.112‐0.998) | |
| Tumor size (cm) | |||||
| <2 | 71 | 40 | 31 | 1 | .031 |
| ≥2 | 29 | 10 | 19 | 3.740 (1.128‐12.396) | |
| Extrathyroid extension | |||||
| No | 75 | 40 | 35 | 1 | .642 |
| Yes | 25 | 10 | 15 | 1.341 (0.389‐4.621) | |
| Lymph node metastasis | |||||
| No | 25 | 13 | 12 | 1 | .167 |
| Yes | 75 | 37 | 38 | 0.246 (0.034‐1.797) | |
| Distant metastasis | |||||
| No | 92 | 44 | 48 | 1 | <.001 |
| Yes | 8 | 2 | 6 | A* | |
| Risk stratification | |||||
| Low risk | 18 | 12 | 6 | 1 | <.001 |
| Intermediate risk | 76 | 34 | 42 | A* | |
| High risk | 6 | 2 | 4 | A* | |
| TNM | |||||
| I‐II | 96 | 48 | 48 | 1 | .422 |
| III‐IV | 4 | 2 | 2 | 3.188 (0.188‐54.154) | |
| Lymphocytic thyroiditis | |||||
| No | 74 | 38 | 36 | 1 | .436 |
| Yes | 26 | 12 | 14 | 1.521 (0.529‐4.372) | |
| PD‐L1 expression | |||||
| Low | 65 | 39 | 26 | 1 | .004 |
| High | 35 | 11 | 24 | 4.730 (1.645‐13.602) |
TABLE 2.
The clinicopathological factors influencing PD‐L1 expression by multivariate logistic analysis
| Variations | Cases | PD‐L1 expression | Multivariate analysis | ||
|---|---|---|---|---|---|
| Low | High | OR (95% CI) | _P_‐value | ||
| Age (y) | |||||
| <55 | 76 | 49 | 27 | 1 | .697 |
| ≥55 | 24 | 16 | 8 | 1.262 (0.392‐4.065) | |
| Sex | |||||
| Male | 28 | 20 | 8 | 1 | .304 |
| Female | 72 | 45 | 27 | 1.837 (0.577‐5.848) | |
| Pathological type | |||||
| FTC | 14 | 9 | 5 | 1 | .075 |
| PTC | 86 | 56 | 30 | 0.194 (0.032‐1.182) | |
| Multifocality | |||||
| No | 69 | 47 | 22 | 1 | .032 |
| Yes | 31 | 18 | 13 | 3.391 (1.112‐10.346) | |
| Tumor size (cm) | |||||
| <2 | 71 | 47 | 24 | 1 | .853 |
| ≥2 | 29 | 18 | 11 | 1.115 (0.352‐3.527) | |
| Extrathyroid extension | |||||
| No | 75 | 50 | 25 | 1 | .357 |
| Yes | 25 | 15 | 10 | 1.779 (0.532‐6.049) | |
| Lymph node metastasis | |||||
| No | 25 | 19 | 6 | 1 | .036 |
| Yes | 75 | 46 | 29 | 7.508 (1.144‐49.291) | |
| Distant metastasis | |||||
| No | 92 | 59 | 33 | 1 | <.001 |
| Yes | 8 | 2 | 6 | A* | |
| Risk stratification | |||||
| Low risk | 18 | 13 | 5 | 1 | <.001 |
| Intermediate risk | 76 | 48 | 28 | A* | |
| High risk | 6 | 2 | 4 | A* | |
| TNM | |||||
| I‐II | 96 | 62 | 34 | 1 | .298 |
| III‐IV | 4 | 3 | 1 | 0.195 (0.009‐4.240) | |
| Lymphocytic thyroiditis | |||||
| No | 74 | 49 | 25 | 1 | .977 |
| Yes | 26 | 16 | 10 | 0.985 (0.350‐2.768) | |
| IL‐6 expression | |||||
| Low | 50 | 39 | 11 | 1 | .004 |
| High | 50 | 26 | 24 | 4.754 (1.655‐13.657) |
FIGURE 2.
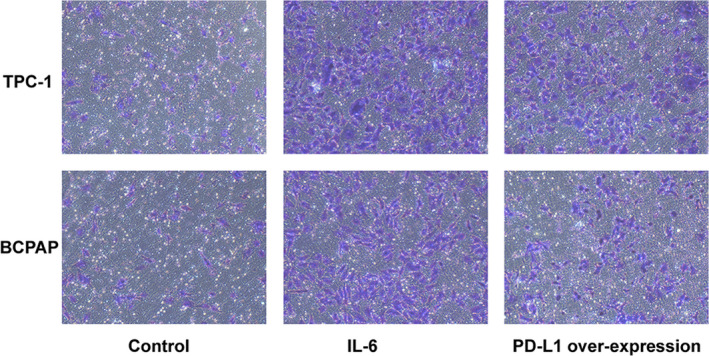
Transwell invasion assay showed that interleukin 6 (IL‐6) and programmed cell death ligand 1 (PD‐L1) overexpression enhance the invasiveness of thyroid cancer
3.2. IL‐6 produced by TAMs induced higher PD‐L1 expression
Multivariate analysis showed that IL‐6 expression was an independent predictor of PD‐L1 expression in thyroid cancer (Table 2). We also found that there was a positive correlation between PD‐L1 and IL‐6 positive rate in cancer tissues (P < .0001, Figure 3A). Therefore, we speculated that IL‐6 may be involved in the regulation of PD‐L1 expression in thyroid cancer. Western blot results showed that total PD‐L1 protein in TPC‐1 and BCPAP significantly increased after IL‐6 treatment (2 ng/mL) for 24 hours (Figure 3B,C). Considering that the PD‐L1 molecule, which actually induces T‐cell exhaustion, is located on the tumor cell membrane, flow cytometry was used to detect the changes of membrane PD‐L1 expression. After IL‐6 treatment, the PD‐L1 expression on the membrane of TPC‐1 and BCPAP increased (Figure 3D). Therefore, it is proved that IL‐6 could upregulate PD‐L1 expression in thyroid cancer. It is reported that IL‐6–producing cells include macrophages, monocytes, and fibroblasts. TAMs account for 50% of tumor microenvironment cells and confers colorectal cancer chemoresistance by IL‐6 production. 24 Moreover, TAMs induce PD‐L1 expression of ovarian cancer through IL‐6 secretion. 21 Therefore, it was studied whether IL‐6 was produced by TAMs in thyroid cancer. Three fresh thyroid cancer tissue samples were selected for flow cytometric analysis. The results showed that IL‐6 was distributed in F4/80‐staining positive TAMs (Figure 4A). TAMs have high plasticity and are predominantly present as M2 phenotype in tumor microenvironment, which is associated with cancer metastasis and poor prognosis. Therefore, we further studied whether M2 phenotype is the subset of IL‐6–producing macrophages. Flow cytometric analysis showed that IL‐6 was distributed in CD206‐staining positive cells (Figure 4B), meaning M2‐phenotype macrophages. In addition, double immunofluorescence analysis illustrated colocalization of IL‐6 and M2 phenotype within thyroid cancer (Figure 4C). It is proved that M2‐phenotype macrophages produce IL‐6 in thyroid cancer.
FIGURE 3.
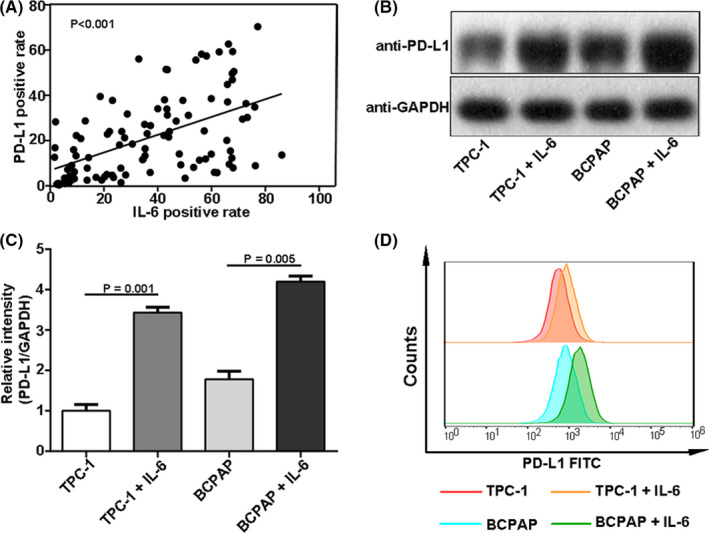
Induction of interleukin 6 (IL‐6) on programmed cell death ligand 1 (PD‐L1) expression in thyroid cancer. A, The PD‐L1 positive rate positively correlated with IL‐6 expression in thyroid cancer. B and C, Western blotting results showed that the total PD‐L1 protein in TPC‐1 and BCPAP increased significantly after IL‐6 treatment. D, Flow cytometry results showed that IL‐6 upregulated the PD‐L1 membrane expression significantly
FIGURE 4.
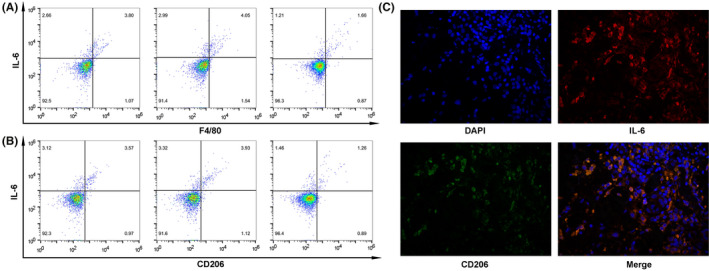
M2‐phenotype macrophages produce interleukin 6 (IL‐6) in thyroid cancer. A, Flow cytometry showed that IL‐6 was distributed in F4/80 staining–positive tumor‐associated macrophages (TAMs). B, Flow cytometry showed that IL‐6 was distributed in CD206‐positive M2‐phenotype macrophages. C, Double immunofluorescence analysis illustrated the colocalization of IL‐6 and M2 phenotype within thyroid cancer
3.3. MAPK and JAK‐STAT3 signaling pathways, but not the PI3K/AKT pathway, are activated by IL‐6 in thyroid cancer
It is reported that IL‐6 promotes tumorigenesis and progression mainly through three signaling pathways, the mitogen‐activated protein kinase pathway (MAPK), Janus‐activated kinase–signal transducers and activators of transcription 3 pathway (JAK‐STAT3), and phosphatidylinositol 3‐kinase/protein serine‐threonine kinase pathway (PI3K‐AKT). 7 Therefore, we tested whether these pathways are also activated by IL‐6 in thyroid cancer. The phosphorylation levels of extracellular signal–regulated kinase (ERK) and c‐Jun NH 2 –terminal kinase (JNK), downstream effectors of the MAPK pathway, significantly increased after IL‐6 treatment in TPC‐1 and BCPAP. Similarly, the expression of phosphorylation‐stat3 (p‐stat3) also increased after IL‐6 stimulation. However, the phosphorylation‐AKT expression was not found to increase (Figure 5A). It is suggested that the MAPK and JAK‐STAT3 pathway, but not the PI3K‐AKT pathway, are activated by IL‐6 in thyroid cancer.
FIGURE 5.
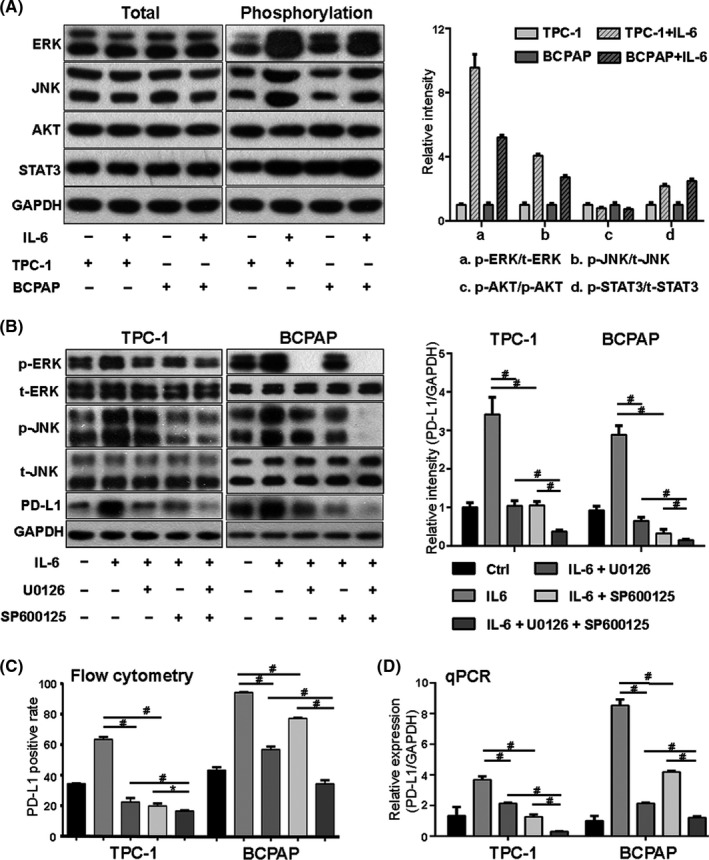
Interleukin 6 (IL‐6) upregulated programmed cell death ligand 1 (PD‐L1) expression through the mitogen‐activated protein kinase (MAPK) pathway. A, In TPC‐1 and BAPCP, after IL‐6 treatment, the phosphorylation levels of extracellular signal–regulated kinase (ERK), C‐Jun NH(2)–terminal kinase (JNK), and signal transducers and activators of transcription 3 (STAT3) significantly increased, while those of protein serine‐threonine kinase (AKT) did not. B, After treatment with U0126 (ERK inhibitor) or SP600125 (JNK inhibitor), the IL‐6–induced total PD‐L1 protein reduced, and combination of them had a synergistic effect on PD‐L1 expression. C, Flow cytometry result showed that the membrane PD‐L1 expression increased after IL‐6 treatment but decreased after subsequent treatment with U0126 or SP600125. D, The level of PD‐L1 mRNA in the IL‐6 group was higher than that in the control group. It was inhibited after treatment with U0126 or SP600125 which worked synergistically. #Indicates P < .05. *Indicates P ≥ .05
3.4. IL‐6 regulates PD‐L1 expression through the MAPK signaling pathway
As IL‐6 could induce PD‐L1 expression and activate the MAPK pathway, experiments were thus performed to investigate whether IL‐6 upregulates PD‐L1 expression through this signaling pathway. We found that two downstream molecules of the MAPK pathway, p‐ERK and p‐JNK, increased by IL‐6 treatment. The ERK and JNK inhibitors (U0126 and SP600125) were used. After treatment with U0126 (10 μmol/L) and SP600125 (10 μmol/L) for 24 hours, the expression levels of p‐ERK and p‐JNK induced by IL‐6 significantly decreased, accompanied by inhibition of PD‐L1 expression (Figure 5B). The positive rate of membrane PD‐L1 increased after IL‐6 treatment but decreased after subsequent treatments with U0126 and SP600125 (Figure 5C). qPCR was used to detect the changes of PD‐L1 mRNA. The results showed that IL‐6 enhanced the transcription of the PD‐L1 gene (Figure 5D).
It is reported that transcription factor c‐Jun could induce the transcription of the PD‐L1 gene. 25 It is also found to be regulated by the MAPK‐ERK and MAPK‐JNK pathways, which was further confirmed in our study. The c‐Jun phosphorylation level (p‐c‐Jun) increased with the activation of the MAPK‐ERK and MAPK‐JNK pathways and decreased with pathway inhibitors (Figure 6A). In addition, we observed that the expression trend of p‐c‐Jun after different treatments was similar to that of PD‐L1 (Figure 6A). It is hypothesized that the MAPK‐ERK and MAPK‐JNK pathways enhance the transcription of the PD‐L1 gene via the transcription factor c‐Jun.
FIGURE 6.
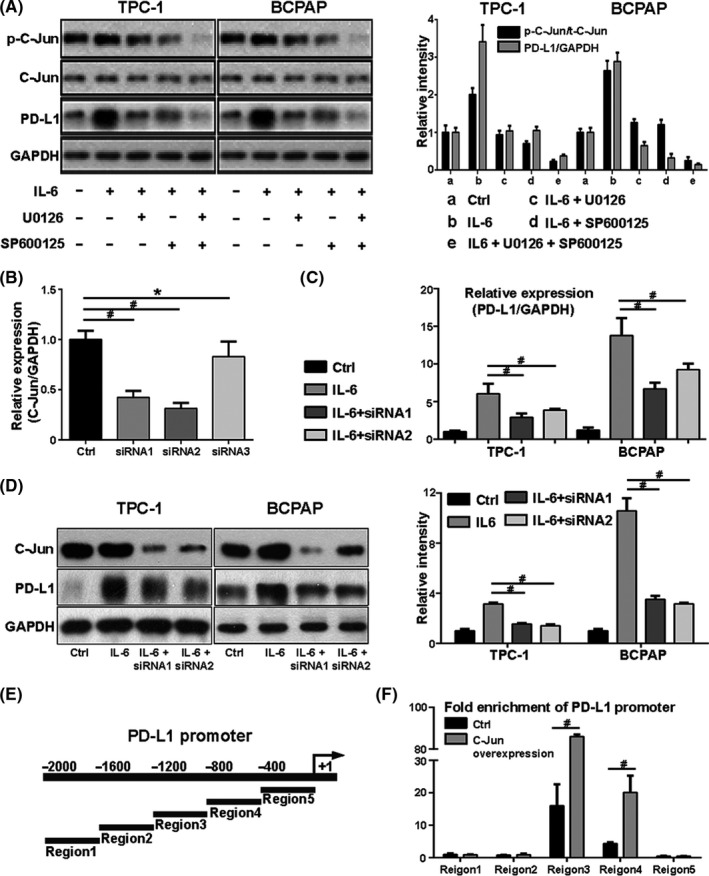
Interleukin 6 (IL‐6) promotes programmed cell death ligand 1 (PD‐L1) gene transcription through the mitogen‐activated protein kinase (MAPK) pathway, which functions via transcription factor c‐Jun. A, The level of p‐c‐Jun increased with the activation of signaling pathways induced by IL‐6 but decreased with the subsequent inhibitors U0126 or SP600125. The expression trend of p‐c‐Jun after different treatments was similar to that of PD‐L1. B, Three small interfering RNAs (siRNAs) were selected to knock down c‐Jun expression. qPCR results showed that the expression of c‐Jun was significantly reduced by siRNA1 and siRNA2 but not by siRNA3. C, qPCR results showed that, compared with IL‐6 treatment alone, the PD‐L1 mRNA level significantly decreased with the combination treatment of IL‐6 and siRNA. D, Western blot results showed that the IL‐6–induced total PD‐L1 protein decreased after treatment with c‐Jun siRNA1 or siRNA2. E, The PD‐L1 gene promoter. F, C‐Jun binding sites were mainly concentrated in region 3, and fold enrichment increased significantly after c‐Jun overexpression. #indicates P < .05. *indicates P ≥ .05
To testify the hypothesis above, three small interfering RNAs (siRNAs) were selected to knock down c‐Jun expression. The expression of c‐Jun mRNA was significantly reduced by siRNA1 and siRNA2, but not siRNA3 (Figure 6B). Therefore, these two siRNAs were used to inhibit the c‐Jun expression in TPC‐1 and BCPAP. Compared with IL‐6 treatment alone, the PD‐L1 mRNA level significantly decreased after combination treatment with IL‐6 and siRNA (Figure 6C). Western blot results showed that the IL‐6–induced PD‐L1 expression decreased after treatment with c‐Jun siRNA1 or siRNA2 (Figure 6D). These results indicate that IL‐6 upregulates PD‐L1 expression through the transcription factor c‐Jun. The PD‐L1 gene promoter was divided into five regions on average (Figure 6E). CHIP‐qPCR results showed that the c‐Jun binding sites were mainly concentrated in region 3, and the fold enrichment of this region increased significantly after c‐Jun overexpression (Figure 6F).
It is evidenced that IL‐6 induces PD‐L1 expression by activating the MAPK‐ERK/JNK pathways, which function through transcription factor c‐Jun.
3.5. IL‐6 regulates PD‐L1 expression through the JAK‐STAT3 signaling pathway
Considering that IL‐6 could also activate the JAK‐STAT3 pathway in thyroid cancer, we further investigated whether this pathway is involved in IL‐6–induced PD‐L1 expression. Ruxolitinib, a small molecular kinase inhibitor targeting JAK, was used to inhibit the function of the JAK‐STAT3 pathway. The results showed that the induced expression of p‐stat3 by IL‐6 was significantly reduced after Ruxolitinib (10 μmol/L) treatment for 24 hours (Figure 7A). With the suppression of p‐stat3 expression, the expression levels of PD‐L1 protein and mRNA decreased (Figure 7A,B), suggesting that the JAK‐STAT3 pathway is also involved in the transcriptional regulation of the PD‐L1 gene by IL‐6. To further prove the above hypothesis, three siRNAs were selected to knock down stat3, and the interference efficiency results are shown in Figure 5C. SiRNA1 and siRNA2 were ultimately used to interfere with stat3 expression in TPC‐1 and BCPAP. After siRNA treatment, the IL‐6–induced p‐stat3 expression was reduced greatly, accompanied by a significant decrease of PD‐L1 expression (Figure 7A). Similarly, the membrane PD‐L1 positive rate induced by IL‐6 decreased to a large extent after siRNA treatment (Figure 7D). CHIP results showed that stat3 could bind to the PD‐L1 promoter (Figure 7E). It is concluded that IL‐6 promotes PD‐L1 expression through the JAK‐STAT3 signaling pathway.
FIGURE 7.
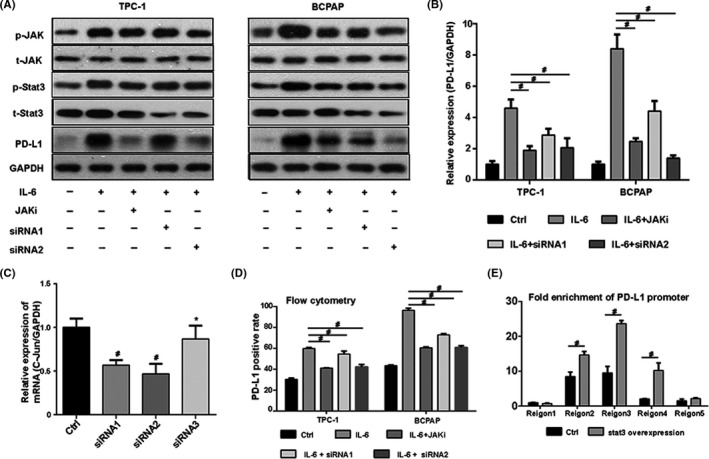
Interleukin 6 (IL‐6) promotes programmed cell death ligand 1 (PD‐L1) gene transcription through the Janus‐activated kinase (JAK)–signal transducers and activators of transcription 3 (STAT3) pathway, which functions via transcription factor stat3. A, The level of p‐stat3 increased after IL‐6 treatment but decreased after subsequent treatment with JAK inhibitor Ruxolitinib or STAT3 small interfering RNA (siRNA). The expression trend of p‐stat3 after different treatments was similar to that of PD‐L1. B, The relative expression of PD‐L1 in different groups. C, Three siRNAs were selected to knock down stat3 expression. Stat3 siRNA1 and siRNA2 significantly reduced the expression of stat3, while siRNA3 did not. D, Flow cytometry result showed that the membrane PD‐L1 expression increased after IL‐6 treatment, but decreased after subsequent treatment with Ruxolitinib or stat3 siRNA. E, Stat3 binding sites were mainly concentrated in promoter regions 2‐4, and fold enrichment increased significantly after stat3 overexpression. #indicates P < .05. *indicates P ≥ .05
3.6. Synergistic effect of the MAPK and JAK‐STAT3 signaling pathways on IL‐6–induced PD‐L1 expression
SiRNAs targeting c‐Jun and stat3 were used to treat TCP‐1 and BCPAP. The results are shown in Figure 6. IL‐6–induced PD‐L1 protein decreased after treatment with c‐Jun siRNA or stat3 siRNA, and its expression further decreased with the combination of both siRNAs (Figure 8A). The constitutive membrane PD‐L1 expression was 24% and 43% on TPC‐1 and BCPAP and increased to 58% and 95% after IL‐6 treatment. After treatment with c‐Jun siRNA or stat3 siRNA, the induced PD‐L1 expression decreased to 40% or 37% on TPC‐1, and to 63% or 61% on BCPAP. After combined treatment with siRNAs targeting c‐Jun and stat3, the membrane positive rate of TPC‐1 and BCPAP further decreased to 31% and 42% (Figure 8B, 8C). The level of PD‐L1 mRNA showed similar results (Figure 8D). It is concluded here that the MPAK and JAK‐STAT3 pathways play a synergistic role in the upregulation of PD‐L1 expression induced by IL‐6.
FIGURE 8.
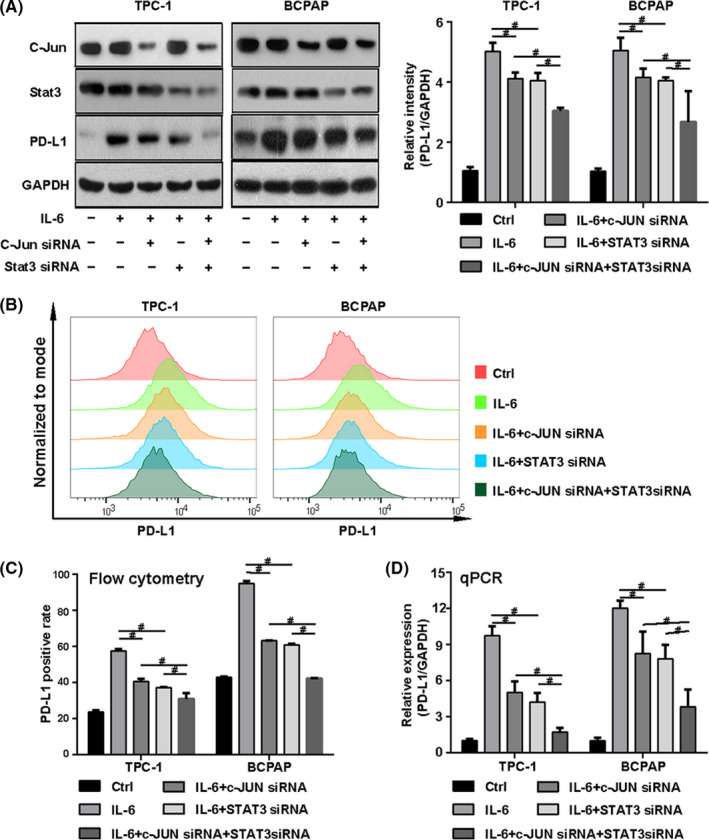
Synergistic effect of the mitogen‐activated protein kinase (MAPK) and Janus‐activated kinase (JAK)–signal transducers and activators of transcription 3 (STAT3) signaling pathways on interleukin 6 (IL‐6)‐induced programmed cell death ligand 1 (PD‐L1) expression. A, IL‐6–induced PD‐L1 expression decreased after treatment with c‐Jun small interfering RNA (siRNA) or stat3 siRNA, and its expression further decreased after treatment with the combination of c‐Jun siRNA and stat3 siRNA. B and C, The constitutive membrane PD‐L1 expression was 24% and 43% on TPC‐1 and BCPAP, and increased to 58% and 95% after IL‐6 treatment. After treatment with c‐Jun siRNA or stat3 siRNA, the induced PD‐L1 expression decreased to 40% or 37% on TPC‐1 and to 63% or 61% on BCPAP. After combining siRNAs target c‐Jun and stat3, the membrane positive rate further decreased to 31% and 42% on TPC‐1 and BCPAP. D, The level of PD‐L1 mRNA increases after IL‐6 treatment, but decreases after subsequent treatment with c‐Jun siRNA or stat3 siRNA. Combination of these two siRNAs has a synergistic effect on the inhibition of IL‐6–induced PD‐L1 mRNA. #indicates P < .05
IL‐6 needs to bind to the IL‐6 receptor (IL‐6R) and exert effects with the help of glycoprotein 130 (gp130). 10 Therefore, it is concluded that IL‐6 is produced by TAMs and upregulates PD‐L1 expression through the MAPK and JAK‐STAT3 pathways, which promote PD‐L1 gene transcription through transcription factors c‐Jun and stat3 (Figure 9).
FIGURE 9.
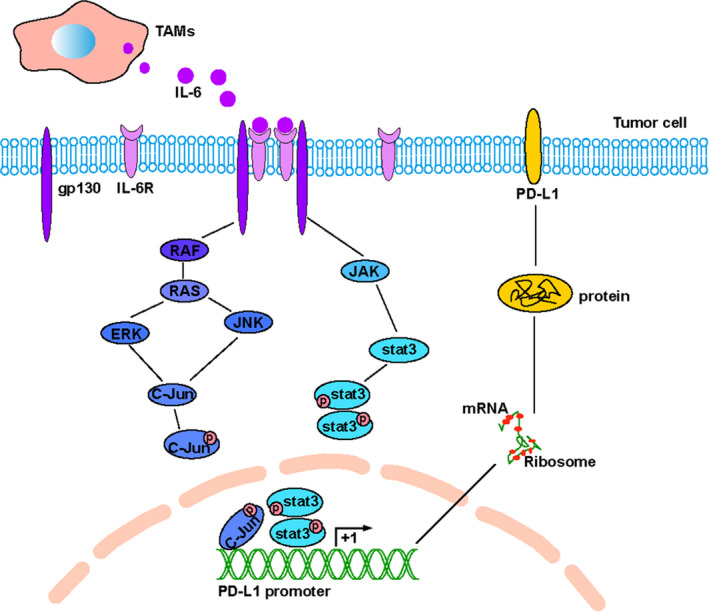
The mechanism by which interleukin 6 (IL‐6) , secreted by tumor‐associated macrophages (TAMs), regulates the expression of programmed cell death ligand 1 (PD‐L1) through the mitogen‐activated protein kinase (MAPK) and Janus‐activated kinase (JAK)–signal transducers and activators of transcription 3 (STAT3) signaling pathway. ERK, extracellular signal–regulated kinase; JNK, C‐Jun NH(2)–terminal kinase
4. DISCUSSION
In the present study, IL‐6 and PD‐L1 are overexpressed in thyroid cancer and enhance the invasion capacity of tumor cells. In thyroid cancer, IL‐6, produced by M2‐phenotype macrophages, could activate the MAPK and JAK‐STAT3 signaling pathways, but not the PI3K‐AKT pathway. The MAPK and JAK‐STAT3 pathways are involved in the regulatory mechanism of IL‐6 on PD‐L1 expression. IL‐6 activates these two pathways, resulting in increased expression of transcription factors p‐c‐Jun and p‐stat3, which bind to the PD‐L1 promoter to enhance gene transcription.
IL‐6, a proinflammation cytokine, has been reported to promote tumorigenesis and progression. In our study, semiquantitative analysis of IHC showed that IL‐6 was overexpressed in thyroid cancer, which is consistent with published results. 10 In addition, IL‐6 expression was related to clinicopathological factors such as tumor size, distant metastasis, and risk stratification. Therefore, there is evidence that IL‐6 is associated with tumor aggressiveness, which is consistent with the report by Kobawala et al. 12 Moreover, we demonstrated that IL‐6 could enhance the invasion of thyroid cancer in vitro through Transwell invasion assay. PD‐L1 overexpression has been repeatedly reported in hematologic and solid tumors. 26 Herein, we found that it was expressed both in thyroid cancer and normal control samples. But the expression was significantly higher in cancer, which is consistent with previous reports by Shi et al. 18 Moreover, PD‐L1 expression was associated with the aggressiveness of thyroid cancer, which is demonstrated by the positive correlation between its expression and clinicopathological factors such as multifocality, lymph node metastasis, distant metastasis, and risk stratification. The results here are consistent with previous reports. 15 , 18 , 27 In addition, we found that thyroid cancer cell lines with PD‐L1 overexpression showed stronger invasion capacity, with mechanisms that need to be investigated in future studies.
Considering that PD‐L1 expression is positively correlated with IL‐6 expression in thyroid cancer, it is speculated that IL‐6 may be involved in the regulation of PD‐L1 expression. Two thyroid cancer cell lines, TPC‐1 and BCPAP, were selected to testify the hypothesis. After IL‐6 treatment, total PD‐L1 protein increased significantly. The membrane PD‐L1 protein has been suggested to be the actual effector ligand for its receptor PD‐1 on the T‐cell membrane, with their mutual recognition inducing T‐cell exhaustion in tumor microenvironment. Therefore, the membrane PD‐L1 expression was detected. The constitutive membrane positive rate of PD‐L1 was 24% on TPC‐1 and 43% on BCPAP. The membrane PD‐L1 expression increased greatly after IL‐6 treatment, with induced membrane positive rates of 57% on TPC‐1 and 95% on BCPAP. It is demonstrated that IL‐6 could upregulate PD‐L1 expression in thyroid cancer, which is consistent with published reports. 19 , 20 , 21 Then, we were interested in what kind of cells produce IL‐6 in thyroid cancer microenvironment. Through flow cytometry and double immunofluorescence analysis of fresh thyroid cancer tissues, we found that it is TAMs that produce IL‐6 in thyroid cancer, with M2‐phenotype macrophages being predominant. Thus, it is concluded that TAMs could upregulate PD‐L1 expression of thyroid cancer through producing IL‐6, which is consistent with the findings in ovarian cancer. 21
After demonstrating that IL‐6 could increase PD‐L1 expression, the regulatory mechanism was further studied. The MAPK‐ERK/JNK and JAK‐STAT3 pathways were activated by IL‐6, which is in agreement with previous reports. 28 However, it was not found that the PI3K‐AKT pathway was activated, which contradicts the findings of Zegeye et al, who reported that the PI3K‐AKT pathway is crucial for IL‐6–induced proinflammation. 29 Pathway inhibitors were added to cell supernatant with IL‐6 in order to block the IL‐6–activated signaling pathways. After treatment with ERK inhibitor U0126, JNK inhibitor SP600125, or JAK inhibitor Ruxolitinib, the IL‐6–induced PD‐L1 total protein and membrane positive rate decreased, suggesting that these pathways are all involved in the regulation of PD‐L1 by IL‐6. Transcription factors c‐Jun and stat3 have been reported to promote PD‐L1 gene transcription, 25 and these two factors significantly increased after IL‐6 treatment in TPC‐1 and BCPAP. However, after treatment with U0126 or SP600125, the phosphorylation level of c‐Jun induced by IL‐6 decreased, and the phosphorylation level of stat3 induced by IL‐6 decreased after Ruxolitinib treatment. Both the decreased phosphorylation levels of c‐Jun and stat3 are accompanied by the inhibition of PD‐L1 expression. It is suggested that c‐Jun and stat3 may be involved in the regulation of PD‐L1 expression in thyroid cancer. SiRNAs that block the expression of c‐Jun and stat3 were applied. The results showed that after treatment with c‐Jun siRNA or stat3 siRNA, the IL‐6–induced PD‐L1 expression was significantly reduced, and the two siRNAs had a synergistic inhibitory effect on PD‐L1 expression. The results of chromatin immunoprecipitation demonstrated that these two factors bind to the PD‐L1 gene promoter, suggesting that they promote gene transcription directly.
It has been reported that IL‐6 binds to its receptor, and the resultant IL‐6/IL‐6R complex associates with gp130 and causes gp130 homo‐dimerization to form a hexameric effector complex, consisting of two molecules each of IL‐6, IL‐6R and gp130, which can activate the downstream signaling pathways and promote tumorigenesis and development. 10 In the present study, we found that IL‐6 could enhance the invasiveness of thyroid cancer and induce negative immune checkpoint PD‐L1 expression. Therefore, we suggest that IL‐6 promotes tumor development not only through its positive stimulation to tumor cells but also through its tumor‐protective effect, which is achieved by increasing PD‐L1 expression to enhance the immune escape of tumor cells. The hypothesis needs to be investigated by further studies. Considering the limitations of current tumor treatment, new therapy models have been explored. The IL‐6/IL‐6R pathway blockade with monoclonal antibodies has shown promising results. 30 With the development of tumor immunology, tumor immunotherapy has attracted the attention of researchers, of which the blockade of the PD‐L1/PD‐1 pathway is predominant. The PD‐L1 inhibitor and PD‐1 inhibitor have been shown to be effective against a variety of cancers including melanoma, non–small cell lung cancer, renal cells cancer, and Hodgkin lymphoma. This therapy achieved a favorable response to Hodgkin lymphoma, relapsed follicular lymphoma, and metastatic bladder cancer, with response rates of 87%, 66%, and 52%, respectively. However, its effects were limited in most cancers. 31 Novel therapy treatments have been investigated to solve the problem and improve the prognosis of patients. Fortunately, the combination model of different inhibitors alleviates this problem to some extent. It is reported that the combination of the IL‐6 and PD‐L1 pathway inhibitor showed a better antitumor response. 32 , 33 , 34 Therefore, it is suggested that the IL‐6 pathway blockade alone or combined with the PD‐L1/PD‐1 pathway inhibitor is a potential treatment to thyroid cancer, which deserves to be further studied.
In summary, the present study demonstrated the higher expression of the IL‐6 and PD‐L1 in thyroid cancer, both of which could enhance the invasiveness of thyroid cancer. The cytokine IL‐6 is released by TAMs and could upregulate PD‐L1 expression via the MAPK and JAK‐STAT3 pathways. The comprehensive effects of IL‐6 on thyroid cancer and the therapeutic value of its pathway blockade deserve to be further investigated.
CONFLICT OF INTEREST
The authors declare no competing interests.
Supporting information
Tab S1
Tab S2
Tab S3
ACKNOWLEDGMENTS
This work was supported by the National Natural Science Foundation of China (No. 81771865) and by the Shanghai Key Discipline of Medical Imaging (No. 2017ZZ02005).
Zhang G‐Q, Jiao Q, Shen C‐T, et al. Interleukin 6 regulates the expression of programmed cell death ligand 1 in thyroid cancer. Cancer Sci. 2021;112:997–1010. 10.1111/cas.14752
Guo‐Qiang Zhang and Qiong Jiao contributed equally to this work.
Contributor Information
Hui‐Zhen Zhang, Email: luoqy@sjtu.edu.cn, Email: qiuzhongling123@163.com, Email: liuyuanblz@aliyun.com.
Zhong‐Ling Qiu, Email: qiuzhongling123@163.com.
Quan‐Yong Luo, Email: luoqy@sjtu.edu.cn.
REFERENCES
- 1.Wiltshire JJ, Drake TM, Uttley L, Balasubramanian SP. Systematic review of trends in the incidence rates of thyroid cancer. Thyroid. 2016;26(11):1541‐1552. [DOI] [PubMed] [Google Scholar]
- 2.de Visser KE, Eichten A, Coussens LM. Paradoxical roles of the immune system during cancer development. Nat Rev Cancer. 2006;6(1):24‐37. [DOI] [PubMed] [Google Scholar]
- 3.Lee M, Rhee I. Cytokine signaling in tumor progression. Immune Netw. 2017;17(4):214‐227. [DOI] [PMC free article] [PubMed] [Google Scholar]
- 4.Yao M, Brummer G, Acevedo D, Cheng N. Cytokine regulation of metastasis and tumorigenicity. Adv Cancer Res. 2016;132:265‐367. [DOI] [PubMed] [Google Scholar]
- 5.Akdis M, Burgler S, Crameri R, et al. Interleukins, from 1 to 37, and interferon‐γ: receptors, functions, and roles in diseases. J Allergy Clin Immunol. 2011;127(3):701‐721.e1‐70. [DOI] [PubMed] [Google Scholar]
- 6.Guo Y, Xu F, Lu T, Duan Z, Zhang Z. Interleukin‐6 signaling pathway in targeted therapy for cancer. Cancer Treat Rev. 2012;38(7):904‐910. [DOI] [PubMed] [Google Scholar]
- 7.Scheller J, Chalaris A, Schmidt‐Arras D, Rose‐John S. The pro‐ and anti‐inflammatory properties of the cytokine interleukin‐6. Biochem Biophys Acta. 2011;1813(5):878‐888. [DOI] [PubMed] [Google Scholar]
- 8.Tanaka T, Narazaki M, Kishimoto T. Interleukin (IL‐6) Immunotherapy. Cold Spring Harb Perspect Biol. 2018;10(8):a028456. [DOI] [PMC free article] [PubMed] [Google Scholar]
- 9.Ara T, Declerck YA. Interleukin‐6 in bone metastasis and cancer progression. Eur J Cancer (Oxford, England: 1990). 2010;46(7):1223‐1231. [DOI] [PMC free article] [PubMed] [Google Scholar]
- 10.Kumari N, Dwarakanath BS, Das A, Bhatt AN. Role of interleukin‐6 in cancer progression and therapeutic resistance. Tumour Biol. 2016;37(9):11553‐11572. [DOI] [PubMed] [Google Scholar]
- 11.Grivennikov S, Karin M. Autocrine IL‐6 signaling: a key event in tumorigenesis? Cancer Cell. 2008;13(1):7‐9. [DOI] [PubMed] [Google Scholar]
- 12.Kobawala TP, Trivedi TI, Gajjar KK, Patel DH, Patel GH, Ghosh NR. Significance of interleukin‐6 in papillary thyroid carcinoma. J Thyroid Res. 2016;2016:6178921. [DOI] [PMC free article] [PubMed] [Google Scholar]
- 13.Sun C, Mezzadra R, Schumacher TN. Regulation and function of the PD‐L1 checkpoint. Immunity. 2018;48(3):434‐452. [DOI] [PMC free article] [PubMed] [Google Scholar]
- 14.Azuma T, Yao S, Zhu G, Flies AS, Flies SJ, Chen L. B7–H1 is a ubiquitous antiapoptotic receptor on cancer cells. Blood. 2008;111(7):3635‐3643. [DOI] [PMC free article] [PubMed] [Google Scholar]
- 15.Ahn S, Kim TH, Kim SW, et al. Comprehensive screening for PD‐L1 expression in thyroid cancer. Endocr Relat Cancer. 2017;24(2):97‐106. [DOI] [PubMed] [Google Scholar]
- 16.Bi Y, Ren X, Bai X, et al. PD‐1/PD‐L1 expressions in medullary thyroid carcinoma: Clinicopathologic and prognostic analysis of Chinese population. Eur J Surg Oncol. 2019;45(3):353‐358. [DOI] [PubMed] [Google Scholar]
- 17.Aghajani MJ, Roberts TL, Yang T, et al. Elevated levels of soluble PD‐L1 are associated with reduced recurrence in papillary thyroid cancer. Endocr Connect. 2019;8(7):1040‐1051. [DOI] [PMC free article] [PubMed] [Google Scholar]
- 18.Shi RL, Qu N, Luo TX, et al. Programmed death‐ligand 1 expression in papillary thyroid cancer and its correlation with clinicopathologic factors and recurrence. Thyroid. 2017;27(4):537‐545. [DOI] [PubMed] [Google Scholar]
- 19.Karakhanova S, Meisel S, Ring S, Mahnke K, Enk AH. ERK/p38 MAP‐kinases and PI3K are involved in the differential regulation of B7–H1 expression in DC subsets. Eur J Immunol. 2010;40(1):254‐266. [DOI] [PubMed] [Google Scholar]
- 20.Kil SH, Estephan R, Sanchez J, et al. PD‐L1 is regulated by interferon gamma and interleukin 6 through STAT1 and STAT3 signaling in cutaneous T‐Cell lymphoma. Blood. 2017;130. [Google Scholar]
- 21.Qu QX, Xie F, Huang Q, Zhang XG. Membranous and cytoplasmic expression of PD‐L1 in ovarian cancer cells. Cell Physiol Biochem. 2017;43(5):1893‐1906. [DOI] [PubMed] [Google Scholar]
- 22.Shen CT, Wei WJ, Qiu ZL, Song HJ, Luo QY. Afamin promotes glucose metabolism in papillary thyroid carcinoma. Mol Cell Endocrinol. 2016;434:108‐115. [DOI] [PubMed] [Google Scholar]
- 23.Koh SA, Lee KH. HGF‐mediated S100A11 overexpression enhances proliferation and invasion of gastric cancer. Am J Transl Res. 2018;10(11):3385‐3394. [PMC free article] [PubMed] [Google Scholar]
- 24.Yin Y, Yao S, Hu Y, et al. The immune‐microenvironment confers chemoresistance of colorectal cancer through macrophage‐derived IL6. Clin Cancer Res. 2017;23(23):7375‐7387. [DOI] [PubMed] [Google Scholar]
- 25.Jiang X, Zhou J, Giobbie‐Hurder A, Wargo J, Hodi FS. The activation of MAPK in melanoma cells resistant to BRAF inhibition promotes PD‐L1 expression that is reversible by MEK and PI3K inhibition. Clin Cancer Res. 2013;19(3):598‐609. [DOI] [PubMed] [Google Scholar]
- 26.Patel SP, Kurzrock R. PD‐L1 expression as a predictive biomarker in cancer immunotherapy. Mol Cancer Ther. 2015;14(4):847‐856. [DOI] [PubMed] [Google Scholar]
- 27.Rosenbaum MW, Gigliotti BJ, Pai SI, et al. PD‐L1 and IDO1 are expressed in poorly differentiated thyroid carcinoma. Endocr Pathol. 2018;29(1):59‐67. [DOI] [PMC free article] [PubMed] [Google Scholar]
- 28.Mihara M, Hashizume M, Yoshida H, Suzuki M, Shiina M. IL‐6/IL‐6 receptor system and its role in physiological and pathological conditions. Clin Sci (London, England: 1979). 2012;122(4):143‐159. [DOI] [PubMed] [Google Scholar]
- 29.Zegeye MM, Lindkvist M, Fälker K, et al. Activation of the JAK/STAT3 and PI3K/AKT pathways are crucial for IL‐6 trans‐signaling‐mediated pro‐inflammatory response in human vascular endothelial cells. Cell Commun Signal. 2018;16(1):55. [DOI] [PMC free article] [PubMed] [Google Scholar]
- 30.Yao X, Huang J, Zhong H, et al. Targeting interleukin‐6 in inflammatory autoimmune diseases and cancers. Pharmacol Ther. 2014;141(2):125‐139. [DOI] [PubMed] [Google Scholar]
- 31.Zou W, Wolchok JD, Chen L. PD‐L1 (B7–H1) and PD‐1 pathway blockade for cancer therapy: mechanisms, response biomarkers, and combinations. Sci Transl Med. 2016;8(328):328rv4. [DOI] [PMC free article] [PubMed] [Google Scholar]
- 32.Liu H, Shen J, Lu K. IL‐6 and PD‐L1 blockade combination inhibits hepatocellular carcinoma cancer development in mouse model. Biochem Biophys Res Comm. 2017;486(2):239‐244. [DOI] [PubMed] [Google Scholar]
- 33.Mace TA, Shakya R, Pitarresi JR, et al. IL‐6 and PD‐L1 antibody blockade combination therapy reduces tumour progression in murine models of pancreatic cancer. Gut. 2018;67(2):320‐332. [DOI] [PMC free article] [PubMed] [Google Scholar]
- 34.Tsukamoto H, Fujieda K, Miyashita A, et al. Combined blockade of IL6 and PD‐1/PD‐L1 signaling abrogates mutual regulation of their immunosuppressive effects in the tumor microenvironment. Can Res. 2018;78(17):5011‐5022. [DOI] [PubMed] [Google Scholar]
Associated Data
This section collects any data citations, data availability statements, or supplementary materials included in this article.
Supplementary Materials
Tab S1
Tab S2
Tab S3