A Previously Unrecognized H-2Db-Restricted Peptide Prominent in the Primary Influenza A Virus-Specific CD8+ T-Cell Response Is Much Less Apparent following Secondary Challenge (original) (raw)
Abstract
Respiratory challenge of H-2b mice with an H3N2 influenza A virus causes an acute, transient pneumonitis characterized by the massive infiltration of CD8+ T lymphocytes. The inflammatory process monitored by quantitative analysis of lymphocyte populations recovered by bronchoalveolar lavage is greatly enhanced by prior exposure to an H1N1 virus, with the recall of cross-reactive CD8+-T-cell memory leading to more rapid clearance of the infection from the lungs. The predominant epitope recognized by the influenza virus-specific CD8+ set has long been thought to be a nucleoprotein (NP366–374) presented by H-2Db (DbNP366). This continues to be true for the secondary H3N2→H1N1 challenge but can no longer be considered the case for the primary response to either virus. Quantitative analysis based on intracellular staining for gamma interferon has shown that the polymerase 2 protein (PA224–233) provides a previously undetected epitope (DbPA224) that is at least as prominent as DbNP366 during the first 10 days following primary exposure to either the H3N2 or H1N1 virus. The response to DbNP366 seems to continue for longer, even when infectious virus can no longer be detected, but there is no obvious difference in the prevalence of memory T cells specific for DbNP366 and DbPA224. The generalization that the magnitude of the functional memory T-cell pool is a direct consequence of the clonal burst size during the primary response may no longer be useful. Previous CD8+-T-cell immunodominance heirarchies defined largely by cytotoxic T-lymphocyte assays may need to be revised.
The murine CD8+-T-cell response to the influenza A viruses is specific largely, although not exclusively, for peptides derived from conserved, internal viral proteins (18). The nucleoprotein (NP) provides a particularly prominent epitope (NP366–374) presented by H-2Db (DbNP366), with lymphocytes that bind a tetrameric complex (tetramer) of DbNP366 constituting as many as one-eighth of the CD8+ T cells recovered by bronchoalveolar lavage (BAL) of H-2b mice following primary infection with the A/HKx31 (HKx31, H3N2) influenza A virus. This DbNP366+ set comprises almost 70% of the CD8+ BAL fluid population following HKx31 challenge of A/PR8/34 (PR8, H1N1)-primed “memory” mice (6). The HKx31 virus is a laboratory recombinant that shares all the PR8 internal proteins (12), and so this is a true secondary response. Comparable results are recorded when BAL T cells are stimulated with high doses of the cognate NP366 peptide in the presence of brefeldin A, permeabilized, and stained for gamma interferon (IFN-γ) (Pepγ assay; see Materials and Methods). The tetramer and the Pepγ results are generally very similar for (at least) the acute phase of the primary and secondary responses to the influenza A viruses.
Previous analysis of BAL fluid populations in this influenza virus model has indicated that CD8+ memory T cells specific for other, unrelated antigens also localize to the site of inflammatory pathology in the lungs. This, together with the massive numbers of CD8+ DbNP366+ T cells detected following the HKx31→PR8 secondary challenge, gave us no reason to suspect that other influenza A virus peptides might be prominent in the response. Although several other potential epitopes have been identified for the H-2b haplotype, not all of them read out as positive in the Pepγ assay (Table 1). The situation for KbNS2114 (Table 1) has been analyzed, establishing that this epitope is much less apparent than DbNP366 in the primary response and considerably less obvious following secondary challenge.
TABLE 1.
Influenza virus CD8+-T-cell epitopes in H-2b mice
| Sequence | Epitopea | CD8+ IFN+b | Reference |
|---|---|---|---|
| ASNENMETM | DbNP366–374 | + | 23, 25 |
| RLIGNSLTI | DbNP55–63 | − | 25 |
| FCGVNSDTV | DbNM430–438 | − | 25 |
| TALANTIEV | DbPB2141–149 | − | 25 |
| SSLENFRAYV | DbPA224–233 | + | This study |
| RFYRTCKL | KbPB2465–472 | − | 25 |
| RTFSFQLI | KbNS2114–121 | + | 25 |
| MGLIYNRM | KbM1128–135 | + | 25 |
Even so, when we dissected the proliferation characteristics of the BAL fluid population recovered from mice with primary or secondary influenza pneumonia, it was apparent that >90% of the inflammatory CD8+ T cells had cycled at least once during the 8 days following the HKx31 challenge (7). Although some of this may reflect bystander activation of CD8+ T cells specific for other antigens, these bromodeoxyuridine (BrdU)-labelling experiments raise the possibility that other influenza virus peptides are involved. Previous studies by Bennink et al. (2) with recombinant vaccinia viruses suggested that a component of the viral polymerase 2 (PA) protein is also recognized by H-2b mice. We have now found that PA indeed provides an epitope that is very prominent in the primary response to both the PR8 and HKx31 influenza A viruses, although it contributes less strongly than does DbNP366 to the recall response following secondary challenge. This finding raises intriguing questions about the establishment and phenotype of CD8+-T-cell memory.
MATERIALS AND METHODS
Mice and tissue sampling.
Female C57BL/6J (B6) mice, 6 weeks old, were purchased from the Jackson Laboratory (Bar Harbor, Maine). They were anesthetized by intraperitoneal (i.p.) injection with avertin (2,2,2-tribromoethanol) and challenged intranasally (i.n.) with 106.8 50% egg infective doses (EID50) of the HKx31 (H3N2) influenza A virus or 20 EID50 of the PR8 (H1N1) influenza A virus diluted in phosphate-buffered saline (PBS). “Memory” mice for secondary challenge experiments were injected i.p. at least 6 weeks previously with 108.5 EID50 of the PR8 influenza virus. There is no cross-neutralization with the H1N1 and H3N2 viruses, and so the magnitudes of the antigen load over the first 4 days or so following primary or secondary challenge should be equivalent (7). Spleen and mediastinal lymph node (MLN) samples were disrupted and enriched for CD8+ T cells by incubation with monoclonal antibodies (MAbs) (Pharmingen, San Diego, Calif.) to CD4 (GK1.5) and major histocompatibility complex (MHC) class II glycoprotein (M5/114.15.2), followed by anti-rat and anti-mouse immunoglobulin-coated magnetic beads (Dynal A.S., Oslo, Norway). Lymphocytes were obtained from the pneumonic lung by BAL, and adherent cells were removed by incubation on plastic for 1 h at 37°C.
Peptides and the Pepγ assay.
The influenza A virus peptides (Table 1) were synthesized at the Center for Biotechnology, St. Jude Children's Research Hospital, using a Perkin-Elmer 433A peptide synthesizer, and then purified by high-pressure liquid chromatography. A panel of overlapping 15-mer peptides spanning the PA protein of the PR8 virus was synthesized and tested at 10 μM. Positive sequences were resynthesized as shorter sequences (9 to 10 amino acids [aa]). Lymphocytes enriched for CD8+ T cells were cultured for 5 h in 96-well round-bottom plates (Costar, Corning, N.Y.) at a concentration of 5 × 10⁵ to 8 × 10⁵ cells per well in 200 μl of RPMI 1640 medium containing 10% fetal calf serum, 10 U of human recombinant interleukin-2 (rIL-2) per ml and 5 μg of brefeldin A (Epicentre Technologies, Madison, Wis.) per ml in the presence or absence of viral peptide. Kinetic analysis of epitope-specific CD8+-T-cell populations was performed with 1 μM viral peptide.
Lymphocytes for the Pepγ assay were washed and stained with anti-mouse CD8α–fluorescein isothiocyanate (FITC) antibody (Pharmingen). Nonspecific Fc binding was blocked using antimouse CD16/32 (Pharmingen). The cells were fixed in 1% formaldehyde in PBS for 20 min, permeabilized in PBS–0.5% saponin for 10 min, and then stained with a conjugated MAb to mouse IFN-γ (PE-XMG 1.2). The specificity of the staining reaction was checked initially by blocking with excess, purified cytokine. An isotype control antibody was also used. The data were acquired on a Becton-Dickinson FACScan apparatus and then analyzed using CELLQuest software (Becton-Dickinson Immunocytometry Systems, San Jose, Calif.). In each assay, the percentage of CD8+ IFN-γ+ T cells without peptide (<0.2%) was subtracted from the percentage of CD8+ IFN-γ+ T cells with peptide to give the percentage of specific CD8+ T cells.
Tetramer staining of virus-specific CD8+ T cells.
Virus-specific CD8+ T cells were identified using tetrameric complexes of the H-2Db glycoprotein and peptides (1) derived from the NP ASNENMETM (23) and PA SSLENFRAYV, referred to as DbNP366 and DbPA224, respectively. We have had the DbNP366 reagent for some time (6), but the tetramer for the newly discovered PA224 became available only toward the end of this set of experiments. Recombinant H-2Db molecules with a BirA biotinylation motif substituted for the carboxyl-terminal transmembrane domain were refolded with human β2-microglobulin plus the appropriate viral peptide, biotinylated with BirA, and complexed at a 4:1 molar ratio with neutravidin-phycoerythrin (Molecular Probes, Eugene, Oreg.). Lymphocytes were stained for 60 min at room temperature with the tetrameric complexes in PBS-bovine serum albumin-azide and then were stained with CD8α-FITC for 30 min on ice, washed twice, and analyzed by flow cytometry.
Cytotoxic T-lymphocyte assays.
Cell suspensions of spleen obtained from mice 2 months or more after i.n. infection with HKx31 virus were cultured with HKx31-infected or peptide-pulsed (1 μM) syngeneic feeders in the presence of 10 U of rIL-2 per ml. These stimulator cells were washed twice, irradiated (3,000 rads), and incubated (106/ml) with responder lymphocytes (1.5 × 10⁶/ml) for 5 days in complete medium at 37°C under 5% CO2. The cultures were restimulated at 5-day intervals. RMA (H-2b)-, EL4 (H-2b)-, H-2Db-, or H-2Kb-transfected L-929 target cells were labeled with Na251CrO4 for 1 h, pulsed with viral peptides, or infected with the HKx31 influenza A virus for 60 min and then plated at 5,000 targets per well. The target cells were washed twice and incubated with the effector populations for 5 h before the supernatants were removed for γ-counting. Twofold lymphocyte dilutions were assayed in triplicate, while untreated and Triton-disrupted controls were measured in quadruplicate. The percent specific lysis was calculated as 100 × (51Cr release from targets with effectors − 51Cr release from targets alone)/(51Cr release from targets with Triton). The level of 51Cr release from targets incubated in the absence of T cells did not exceed 20% of the total, Triton-mediated Cr release.
Restimulation in bulk culture and cell lines.
Naive B6 spleen cells were infected with A/HKx31 for 1 h in complete medium. They were washed once, irradiated (3,000 rad), and incubated (106/ml) with responder lymphocytes (1.5 × 10⁶/ml) for 5 days in complete medium at 37°C under 5% CO2. Polyclonal cell lines were generated from mice infected i.n. with the HKx31 virus 2 to 3 months previously and then maintained by restimulation with peptide-pulsed irradiated spleen cells every 5 to 6 days in medium incorporating 10 U of rIL-2 per ml.
RMA-S Db/Kb peptide stabilization assay.
RMA-S cells (14) were incubated for 16 h at 26°C in complete medium and then incubated in 96-well plates in the presence of twofold dilutions of peptide (100 μM to 760 pM) for 30 min at room temperature followed by 3 h at 37°C. The cells were then stained with MAbs to H-2Db (28.14.85) or H-2Kb (AF6.88.5.3) followed by FITC-conjugated rabbit anti-mouse immunoglobulin G (Dako A/S, Copenhagen, Denmark) and analyzed for mean geometric fluorescence using a FACScan flow cytometer and the CELLQuest program.
ELISpot assay.
The numbers of IFN-γ producing cells in spleen populations from memory mice were determined by enzyme-linked immunospot (ELISpot) analysis (13). Nitrocellulose-bottom 96-well plates (Millipore, Bedford, Mass.) were coated overnight at 4°C with rat anti-mouse IFN-γ antibody (clone R4-6A2; Pharmingen). Twofold dilutions of responder cells in complete medium were cultured with 5 × 10⁵ syngeneic feeders that had been pulsed with 1 μM peptide or not pulsed and 10 U of human rIL-2 per ml. The cells were cultured for 48 h, and then the plates were washed and incubated with biotinylated IFN-γ antibody (clone XMG 1.2) and developed using 5-bromo-4-chloro-3-indolylphosphate–nitroblue tetrazolium (BCIP-NBT) alkaline phosphatase substrate (Sigma Chemical Co., St. Louis, Mo.). The frequency of peptide-specific CD8+ T cells present in the responding population was calculated by subtracting the mean number of spots for feeders with no peptide from the mean number of spots with peptide-pulsed feeders. Responses were considered positive when there were >10 spots/well and the number of peptide-pulsed feeder spots was at least twice the number of unpulsed feeder spots.
BrdU treatment and cell staining.
Mice were given BrdU (Sigma) dissolved in sterile drinking water at a dose of 0.8 mg/ml for an 8-day “pulse” period. The control mice were given drinking water not containing BrdU, to establish the level of background staining. Briefly, cells were surface stained with tetramer and anti-CD8α antibody, washed in 0.15 M NaCl, fixed in 70% ethanol for 30 min at 4°C, and washed in PBS (7, 22). The lymphocytes were further fixed and permeabilized in 1% formaldehyde–0.01% Tween 20 in PBS for 30 min at room temperature, washed in PBS, incubated in 50 Kunitz units of DNase I (Sigma) for 10 min at 37°C, stained with anti-BrdU–FITC (Becton Dickinson, Mountain View, Calif.), and washed twice in PBS. The staining profiles were determined using a FACScan flow cytometer. A minimum of 2,000 CD8+ tetramer-positive events were analyzed for each sample.
RESULTS
Characterization of the H-2Db-restricted PA peptide.
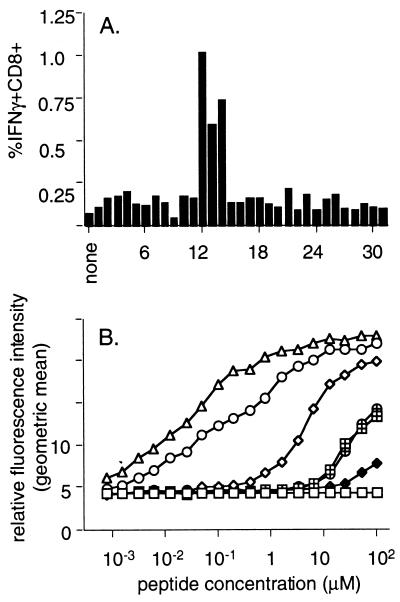
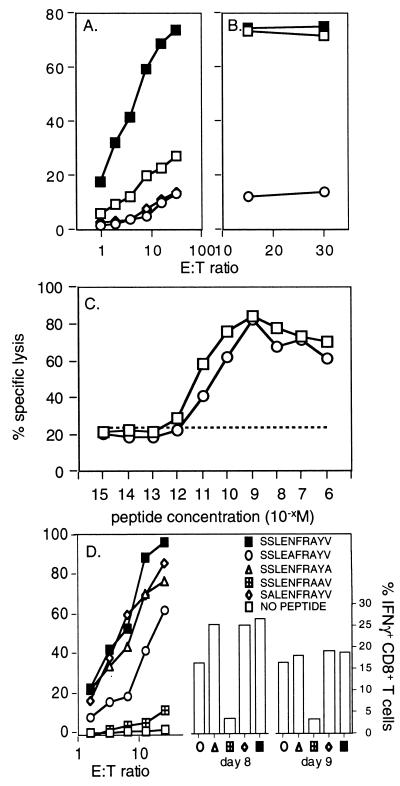
Overlapping peptides (15 aa) derived from the PR8 PA gene (2) were tested for their ability to stimulate IFN-γ production (Pepγ assay) in splenic CD8+ T cells generated following acute infection with the HKx31 influenza A virus. One segment elicited a clear CD8+ IFN-γ response. Shorter peptides (9 to 10 aa) spanning the positive sequence were tested for the most efficient IFN-γ production (Fig. 1A) and upregulation of MHC class I molecules in TAP-2-deficient RMAS cells (Fig. 1B). The sequence presented by H-2Db is defined by PA224–233 SSLENFRAYV (PA224). Effector cells derived from bulk culture and from polyclonal cell lines lysed virus-infected EL4 or RMA (data not shown) cell lines at low levels (Fig. 2A), while no cross-reactivity was recognized for peptide-stimulated CD8+-T-cell lines specific for DbNP366 and DbPA224 tested on either virus-infected or peptide-pulsed target cells (data not shown).
FIG. 1.
Identification of the H-2Db-restricted PA224–233 (DbPA224) epitope. (A) Overlapping 15-aa PA peptides, sharing 5 aa with both the preceding and the subsequent peptides, were used to stimulate enriched CD8+ splenocytes pooled from two B6 mice at 10 days after i.n. infection with 106.8 EID50 of the HKx31 influenza A virus. The incubations were continued for 5 h in the presence of brefeldin A, and the percentage of CD8+ IFN-γ+ cells was determined by flow cytometry after surface staining for CD8, fixation, and permeabilization followed by staining for intracellular IFN-γ (Pepγ assay). (B) The epitope identified from the overlapping set responding in panel A did not conform to the H-2Db consensus motif XXXXNXXXM/I/L (5). Peptides encompassing α1 aa of the flanking regions were therefore examined for upregulation of surface expression of H-2Db on RMAS cells. The cells were incubated in titrated amounts of each peptide for 3 h and then stained for H-2Db with 28.14.85 rabbit anti-mouse–FITC and examined by flow cytometry for the geometric mean fluorescence intensity. The NP366 peptide (ASNENMETM) (▵) was used as a positive control. Data are representative of three independent experiments: ○, SSLENFRAYV; ◊, SLENFRAYV; ⧫, PSSLENFRAYV; ⊕, LENFRAYV; ⊞, SSLENFRAY.
FIG. 2.
Assaying functional CD8+ T cells specific for DbPA224 and variant peptides. (A) Spleen cells from B6 mice primed 2 months previously by i.n. challenge with 106.8 EID50 of the HKx31 influenza A virus were cultured for 5 days with syngeneic, PA224-pulsed stimulator cells. The lymphocytes were then assayed (6 h) on 51Cr-labeled EL4 cells (H-2b) that were pulsed with 1 μM PA224 (■) or NP366 (◊), infected for 1 h with the HKx31 virus (□), or left untreated (○). (B) Lytic activity was measured for primary CD8+ T cells stimulated with PA224-pulsed cells and then assayed on 51Cr-labeled EL4 targets that had been incubated with 10−6 M (■) or 10−9 M (□) PA224 or left untreated (○). (C) Memory CD8+ T cells from mice infected 2 months previously with HKx31 were restimulated with HKx31-infected syngeneic splenocytes for 5 days and then assayed for lytic activity against EL4 cells pulsed with log dilutions of either DbNP366 or DbPA224 peptide. ○, DbNP366; □, DbPA224 peptide; –––, unpulsed targets. (D) The lytic activity of a CD8+-T-cell line specific for DbPA224 was measured (left y axis) using EL4 target cells pulsed with 1 μM PA224 analogues in which single alanine substitutions were made at position 2, 5, 9, or 10. These peptides were used to stimulate BAL fluid cells obtained 8 or 9 days after challenge with the HKx31 virus for analysis by the Pepγ assay (right y axis).
The PA224 peptide sensitized targets with equal efficiency at concentrations from 10−6 to 10−15 M (Fig. 2B and C). Since PA224 does not rigidly conform to the consensus motif for monomeric H-2Db sequences (5), we asked whether the anchor residues (positions 5 and 9 or 10) might also influence recognition. Alanine-monosubstituted analogues of PA224 were made with substitutions at key positions and analyzed for fine specificity using polyclonal DbPA224-specific cell lines in a standard 51Cr release assay (Fig. 2D, left y axis). The most critical positions were clearly 5 and 9, a result that was confirmed by the Pepγ assay (Fig. 2D, right y axis) for BAL populations obtained 8 and 9 days after primary i.n. infection with the HKx31 virus. Substituting alanine at position 2 did not alter CD8+-T-cell recognition (Fig. 2D), suggesting that CTL reactivity to the A/NT60/68 influenza virus PA that has a change from serine to cysteine at this site would not be compromised. This was checked for pooled BAL cells obtained 10 days after i.n. HKx31 challenge, with the percentage of CD8+ IFN-γ+ cells being 15.8 for the standard DbPA224–233 peptide and 13.8 for the NT/60/68 variant.
Kinetic analysis of primary-peptide-specific CD8+-T-cell responses.
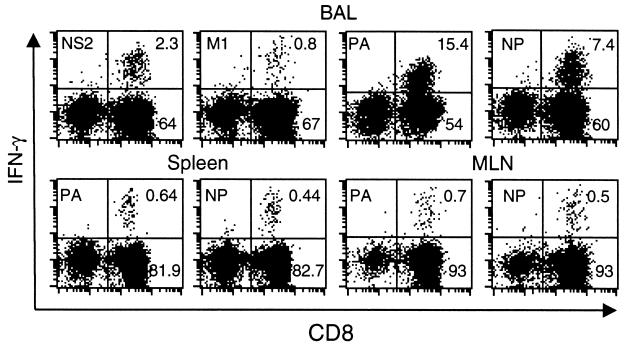
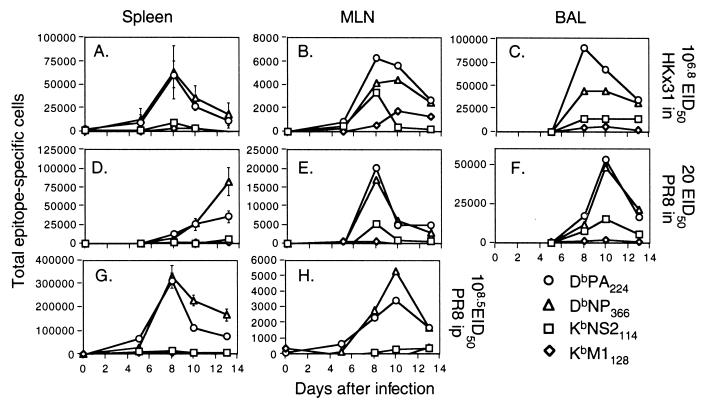
Typical flow cytometry plots for the Pepγ assay are illustrated in Fig. 3 for CD8+ T cells that were first recovered by BAL of HKx31-infected B6 mice and then stimulated with the PA224, NP366, M1128, and NS2114 (Table 1) peptides. The primary CD8+-T-cell response to these H-2Kb (NS2 and M1) and H-2Db (NP and PA) epitopes was then analyzed in detailed kinetic studies using spleen, MLN, and BAL fluid populations from mice infected i.n. with the HKx31 (Fig. 4A to C) or PR8 (Fig. 4D to F) viruses. We also characterized the response characteristics for the spleen and MLN of mice challenged i.p. with the PR8 virus (Fig. 4G and H), the method used to establish CD8+-T-cell memory. In every situation, KbM1128 and KbNS2114 were shown to be relatively minor epitopes (Fig. 4).
FIG. 3.
Flow cytometric assay of peptide-specific CD8+ T cells recovered directly from acutely infected mice. Freshly isolated BAL fluid (upper panel), spleen (lower left panels), and MLN (lower right panels) populations from B6 mice infected i.n. with the HKx31 influenza virus 8 days previously were cultured for 5 h in the presence or absence of viral peptide and brefeldin A, stained for CD8α, fixed and permeabilized, and then stained for intracellular IFN-γ (Pepγ assay). Adherent cells were first removed from pooled (three mice) BAL fluid suspensions by incubation on plastic for 60 min at 37°C, while CD8+ T cells were enriched from the spleen and MLN samples (see Materials and Methods). The percentages of CD8+ cells in a lymphocyte/lymphoblast gate staining for IFN-γ after incubation without peptide were 0.16, 0.14, and 0.04 for BAL fluid, spleen, and MLN populations, respectively.
FIG. 4.
Kinetic analysis of peptide-specific CD8+-T-cell responses following primary challenge with the HKx31 (H3N2) or PR8 (H1N1) influenza A virus. Naive B6 mice were infected i.n. with 106.8 EID50 of the HKx31 virus (A to C) or 20 EID50 of the PR8 virus (D to F). Spleen cells (A, D, and G) were assayed from individual mice (results are shown as mean and SE), while the populations recovered from the MLN (B, E, and H) and the BAL fluid (C and F) were pooled (n = 5 or 6). The lymphocytes were then processed, stimulated with 1 μM peptide, and stained for CD8 and IFN-γ (Pepγ assay). The percentages of CD8+ T cells specific for DbNP366 (NP), DbPA224 (PA), KbNS2114 (NS2), and KbM1128 (M1) were determined by flow cytometry (Fig. 3), and then the numbers of epitope-specific CD8+ T cells in each anatomical site were calculated using the percentage of staining and the total counts recovered. The percentages of CD8+ T cells were also analyzed statistically: the spleen results for DbNP366 and DbPA224 were significantly different (P<0.005) on day 10 and day 13 for the mice primed i.p. with PR8 (G) and on day 13 for those challenged i.n. with this virus (D).
Evidence of a response to the DbPA224 epitope was apparent as early as day 5 in the MLN and spleens of mice given HKx31 i.n. or PR8 i.p. (Fig. 4A, B, G, and H). The greatest numbers of CD8+ DbPA224+ T cells were found in the spleen on day 8, concurrent with the presence of an NP366-specific set of equal magnitude (Fig. 4A and G). However, the spleen profiles then differed for these two groups of mice. Although the rate of decline in prevalence was equivalent through day 13 for the DbPA224- and DbNP366-specific sets in the mice given HKx31 i.n., the frequency of the PA224-specific population decreased significantly more quickly in those primed i.p. with a high titer of the PR8 virus. The somewhat delayed response to the low-dose i.n. challenge with the more virulent PR8 virus showed comparable profiles for the DbPA224- and DbNP366-specific CD8+ T cells in the spleen, MLN, and BAL fluid on day 10 (Fig. 4D and F). However, the day 13 spleen values for the PA224-specific population were again significantly lower than for NP366 in these mice with respiratory PR8 infection (Fig. 4D). The CD8+ DbPA224+ set peaked (day 8) at a higher level than did the CD8+DbNP366+ population in the MLN and BAL fluid of the HKx31-primed mice but diminished to equivalent prevalence by day 13 (Fig. 4B and C).
This prominence of the CD8+ DbPA224+ population in the BAL fluid of HKx31-primed mice (Fig. 4C) was confirmed in a more detailed kinetic study with individual BAL fluid samples. The percentages of CD8+ IFN-γ+ T cells (mean ± standard error [SE]) on days 7, 8, 10, and 13 were as follows: DbPA224, 12.5 ± 1.7, 15.2 ± 1.0, 12.9 ± 1.2, and 14.6 ± 2.0; DbNP366, 5.1 ± 0.6, 10.1 ± 1.7, 9.8 ± 1.0, and 16.5 ± 2.5. The values for DbPA224 were significantly higher (P < 0.05) than those for DbNP366 on days 7, 8, and 10. A further experiment with pooled BAL fluid cells showed the same trend. Analysis of CD8+ T cells recovered from the site of inflammatory pathology thus indicates that the effector phase of the primary response (days 7 to 10) to this previously unrecognized PA224 peptide is at least as prominent as that to the “immunodominant” DbNP336 epitope following challenge with both the HKx31 (H3N2) and PR8 (H1N1) influenza A viruses (see above) (Fig. 4C and F). Furthermore, it is now possible to account for at least 25 to 30% of the CD8+ T cells in the pneumonic lung as being influenza virus specific.
Secondary response.
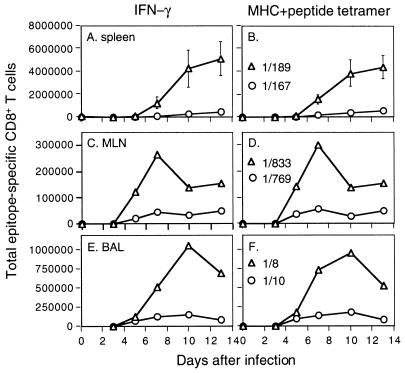
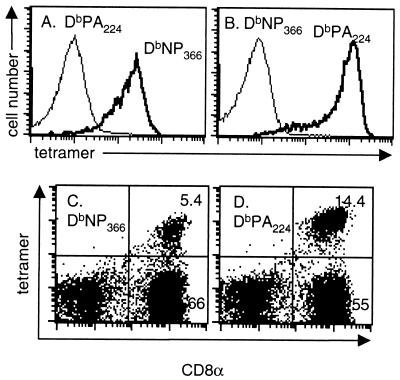
Previous experiments (6) showed that the DbNP366-specific set comprised >60% of the CD8+ T cells in the BAL fluid following i.n. HKx31 (H3N2) challenge of memory mice primed i.p. with the PR8 (H1N1) virus. The prominence of the CD8+-T-cell response to the DbPA224 epitope in naive mice given either a high dose of the HKx31 virus (Fig. 4A to C) or a low dose of the more virulent PR8 viruses (Fig. 4D to F) was thus surprising. The next experiment compared the primary and secondary (HK→PR8) responses to the HKx31 virus (Table 2). The hierarchy for the CD8+ DbNP366+ and CD8+ DbPA224+ populations in the BAL fluid, MLN, and spleen established for the acute phase of the primary response (Fig. 4, HKx31; Table 2) was reversed by secondary challenge (HK→PR8) (Table 2). The dominance of the DbNP366 set in the HK→PR8 response was confirmed in a further experiment using both the Pepγ assay and staining with tetrameric complexes of H-2Db plus NP366–374 and H-2Db plus PA224–233 (Fig. 5). The specificity characteristics of the DbNP366 tetramer and the newly developed DbPA224 tetramer are shown in Fig. 6.
TABLE 2.
Contemporary comparison of the primary and secondary DbNP366 and DbPA224 responses
| Time (days) after infection withb: | % of CD8+ T cells producing IFN-γab in: | ||||||||||||
|---|---|---|---|---|---|---|---|---|---|---|---|---|---|
| Spleen | MLN | BAL fluid | |||||||||||
| HKx31 | HK→PR8 | HKx31 | HK→PR8 | HKx31 | HK→PR8 | ||||||||
| HKX31 | PR8 | NP | PA | NP | PA | NP | PA | NP | PA | NP | PA | NP | PA |
| 0 | 60 | 0 | 0 | 0.5 ± 0.1 | 0.4 ± 0.1 | 0 | 0 | 0.12 | 0.13 | NDc | ND | ND | ND |
| 5 | 65 | 0.1 ± 0.1 | 0.1 ± 0.1 | 1.4 ± 0.6 | 0.4 ± 0.1 | 0.2 | 0.8 | 14.2 | 2.4 | 1.1 | 0.9 | 22.5 | 12.6 |
| 8 | 68 | 0.6 ± 0.2 | 0.6 ± 0.1 | 14.6 ± 3.2 | 1.4 ± 0.4 | 0.1 | 0.8 | 7.2 | 3.2 | 11.0 | 22.3 | 55.6 | 9.3 |
| 10 | 70 | 0.5 ± 0.1 | 0.4 ± 0.1 | 24.3 ± 6.5 | 1.7 ± 0.5 | 0.5 | 0.4 | 16.5 | 3.8 | 11.0 | 16.7 | 62.8 | 9.0 |
| 13 | 73 | 0.3 ± 0.1 | 0.2 ± 0.1 | 23.6 ± 5.8 | 2.2 ± 0.6 | 0.3 | 0.3 | 12.0 | 3.7 | 11.9 | 13.3 | 44.2 | 5.5 |
FIG. 5.
Contemporary analysis of the secondary CD8+-T-cell response using the Pepγ and tetramer-staining protocols. The B6 mice were primed by i.p. injection with 108.5 EID50 of the PR8 virus and challenged i.n. 42 days later with 106.8 EID50 of the HKx31 virus. The percentage of peptide-specific CD8+ T cells was determined by the Pepγ assay (A, C, and E) or by tetramer staining (B, D, and F). Spleen cells (A and B) were assayed from individual mice (results shown as mean and SE), while the populations recovered from the MLN (C and D) and the BAL fluid (E and F) were pooled (n = 3 to 5). The lymphocytes were then processed, stimulated with 1 μM peptide, and stained for CD8 and IFN-γ (Pepγ assay). The percentages of CD8+ T cells specific for DbNP366 (NP) (▵) and DbPA224 (PA) (○) were determined by flow cytometry, and the numbers of epitope-specific CD8+ T cells in each anatomical site were calculated using the percentage of cells staining and the total counts recovered. Estimates of memory-T-cell frequency prior to secondary challenge are also shown as ratios in panels B, D, and F, although the percentage of cells staining with the tetrameric reagents is too low for the MLN results to be meaningful. Also, although the percentage of tetramer-positive cells in the BAL fluid population is high on day 0, the numbers recovered from the lung are minuscule.
FIG. 6.
Specificity of the tetrameric complexes. (A and B) Peptide-specific CD8+-T-cell lines were generated by successive rounds of bulk culture from HKx31 immune splenocytes exposed to peptide-pulsed stimulators in the presence of human rIL-2. The staining profiles for the DbNP366 (A) and DbPA224 (B) specific sets are shown for the CD3+ CD8+ lymphoblast gate. The results for unstained cells were comparable to those for the irrelevant tetrameric complex. (C and D) BAL fluid cells were obtained from B6 mice 8 days after primary infection with the HKx31 influenza virus, adhered for 1 h to remove adherent mononuclear cells, and then stained for DbNP366 (C) and DbPA224 (D).
Magnitude and quality of memory.
The declining phase of the primary CD8+-T-cell response measured by Pepγ analysis of the spleen (Fig. 4A, D, and G) showed a greater fall in prevalence for DbPA224-specific than for DbNP366-specific CD8+ T cells, although this effect was not obvious for the MLN and BAL fluid populations (Fig. 4B, C, E, and F). Because of the size of the organ, there will always be more memory T cells present in the spleen than in any other anatomical site. The twofold differences in splenic T-cell numbers specific for DbNP366 and DbPA224 on days 10 and 13 after primary challenge were statistically significant for the mice given the PR8 virus i.p., the method used in the secondary-challenge experiments (Table 2; Fig. 5). This implies a lesser capacity of the acutely stimulated DbPA224-specific T cells to transit to memory status, offering an obvious explanation for the dominance of the DbNP366+ set in the secondary response (Table 2; Fig. 5).
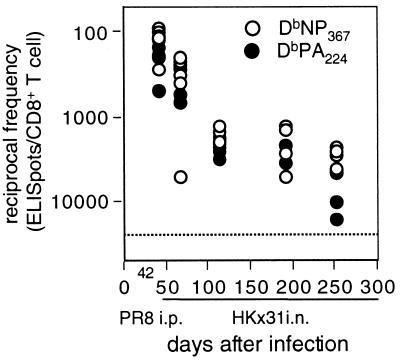
However, the day 0 results immediately prior to secondary HKx31 challenge (ratios in Fig. 5B, D, and F) of PR8-primed mice did not indicate any difference in prevalence for the DbNP366- and DbPA224-specific sets, although we are clearly at the limit of sensitivity for tetramer staining at these frequencies (<0.5%). The question was analyzed further for serially diluted lymphocyte populations using the ELISpot assay. Here, however, we saw no significant difference in frequency for NP366- and PA224-specific memory T cells at 42 days after i.p. priming with the PR8 virus or from 50 to 200 days after i.n. exposure to the HKx31 virus (Fig. 7). There is thus no obvious reason to assume that the magnitude of T-cell memory to DbPA224 is quantitatively smaller than that to DbNP366.
FIG. 7.
ELISpot analysis of CD8+-T-cell memory established by primary infection. The mice were infected i.p. with the PR8 virus or i.n. with the HKx31 virus and tested 42 days (PR8) or from 50 to 250 days (HKx31) later. The results show the reciprocal frequency of spot-forming cells specific for DbNP366 or DbPA224. Unfractionated cells from four or five individual spleens were incubated on IFN-γ-coated ELISpot plates with peptide-pulsed (1 μM) syngeneic spleen cells. The extent of IFN-γ secretion was determined after 44 to 48 h with a second biotinylated anti-IFN-γ MAb and streptavidin-alkaline phosphatase. The limit of detection in this assay (dotted line) was approximately 25,000 cells/peptide-specific ELISpot.
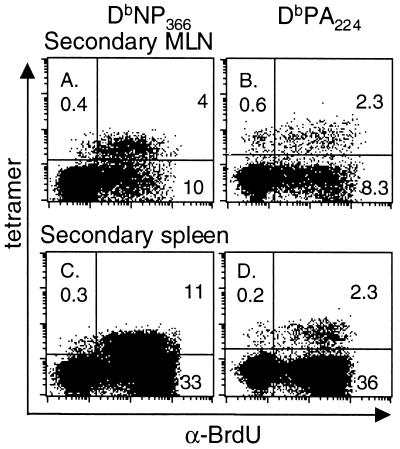
Is there a difference in the proliferative capacity of these two memory T-cell populations? Mice that had been primed i.p. with the PR8 virus were given BrdU in their drinking water throughout the course of secondary i.n. challenge with the HKx31 virus. The great majority of tetramer-positive cells in the BAL fluid (data not shown) and lymphoid tissue incorporated BrdU for both CD8+-T-cell populations, although the numbers were (Table 2; Fig. 5) much larger for the DbNP366-specific set (Fig. 8). Comparison of four spleens removed on day 8 following primary or secondary challenge with the HKx31 virus gave values for the CD8+ tetramer+ BrdU+ population as follows: primary, NP366 86.3% ± 3.9%, PA224 84.6% ± 5.4%; secondary, NP366 96.6% ± 1.0%, PA224 81.9% ± 2.4%. The values for the secondary response were significantly different (P < 0.02). The fact that 15% fewer of the DbPA224-specific T cells showed evidence of cycling at the end of an 8-day pulse period may reflect a real difference, since the proliferating T cells will rapidly dilute those that do not divide. This observation will be pursued further in experiments that analyze concurrently the spectrum of in vivo antigen expression.
FIG. 8.
Determination of cell cycling in DbNP366- and DbPA224-specific CD8+-T-cell populations during secondary influenza virus infection. Mice were primed i.p. with the PR8 virus and rested for 84 days before being infected i.n. with the HKx31 influenza virus. They were fed continuously with BrdU-containing water and analyzed 8 days after the HKx31 challenge. The MLN (A and B) and spleen (C and D) populations were enriched for CD8+ T cells and surface stained for CD8α and the relevant Db-tetramer, followed by fixation and intracellular staining for BrdU. The prevalence of the tetramer+ BrdU+ set was determined for the CD8+ population. The profiles shown are for pooled MLN from five mice and for an individual spleen.
DISCUSSION
The identification of the DbPA224 epitope has established that >25 to 30% of the CD8+ population recoverable by BAL of mice with primary influenza pneumonia are indeed virus specific. This rises to 70 to 80% in the secondary response. In general, these findings and findings with other pathogens point to the preponderance of the responding CD8+-T-cell population in virus-induced inflammatory processes (16, 20).
The assumption prior to the present analysis was that most of the CD8+ T cells generated in H-2b mice infected with an influenza A virus are specific for DbNP366. Some CD8+ T cells were known to recognize KbNS2114, although this minor epitope is less prominent following secondary challenge. The in vivo response to KbM1128 (25) is minimal. Earlier analysis with the PR8 (H1N1) influenza A virus identified a number of candidate peptides that failed to elicit an in vivo response after infection, although they did bind effectively to H-2Db or H-2Kb and protective CD8+-T-cell populations were generated by peptide immunization procedures (17, 25).
The discovery that DbPA224 is very prominent in the primary response to both the PR8 and HKx31 influenza A viruses was somewhat surprising. That it was found at all reflects the use of the relatively recently developed Pepγ assay. Although CTL directed against PA224-pulsed targets are readily generated by stimulating influenza virus-immune spleen cells with peptide, these effectors are not very lytic (5-h 51Cr release assay) for virus-infected cells. This could indicate that virus-infected targets simply express less of the PA224Db epitope, a possibility that we aim to probe later with hybridoma cell lines (8, 24). Other experiments indicate that the CD8+-T-cell-mediated elimination of influenza virus-infected respiratory epithelium operates either via perforin/granzyme- or Fas-mediated cytotoxicity (21). However, the 5-h 51Cr release assay reads out only perforin/granzyme CTL activity (10), and so the relative lack of lysis in vitro does not necessarily indicate that the DbPA224-specific T cells are ineffectual in vivo. Virus recombinants expressing PA224 are currently being generated to analyze whether this epitope generates a protective response.
The primary DbPA224-specific response is equivalent in magnitude to the response to DbNP366 and may even be detected a little earlier in the BAL fluid population recovered from the pneumonic lung. The paradox is that this pattern is not repeated following secondary challenge, even though the growth characteristics of this virus are equivalent for the first 4 days of the primary (HKx31) or secondary (HKx31→PR8) response. Even if the DbPA224 epitope is expressed first, why would this effect not be seen again following secondary stimulation? There is an obvious need to probe the duration and kinetics of in vivo antigen expression in these two situations. We are currently developing hybridoma cell lines for such analyses (8, 24).
Although the NP366 and PA224 peptides are apparently equivalent in their capacity to upregulate MHC class I molecules on RMAS cells, peptide affinity does not necessarily determine the signaling events that are required to induce T-cell stimulation and thus ligand potency (11). It is possible that the observed differences in magnitude for the secondary response are related to the avidity of each peptide for the MHC (19). A higher dissociation rate for DbPA224 than for DbNP366 could lead to the diminished entry of DbPA224-specific T cells into the memory pool, although the numbers of memory T cells responsive to these two epitopes seem to be equivalent when the T cells are stimulated with high concentrations of peptide in either the Pepγ or ELISpot assay. Also, the correspondence between the Pepγ and DbPA224 staining profiles in the secondary response gives no indication that the DbPA224-specific set contains T cells that are anergic.
A further possibility is that DbPA224 engages a much broader spectrum of T-cell receptor (TCR) αβ pairs, many of which have low affinity/avidity for the antigen. A smaller, naive CD8+-T-cell pool with higher-affinity/avidity TCRs specific for DbNP366 would take longer to reach maximal numbers but would then tend to dominate the secondary response. The kinetics of the primary response between days 10 and 13 also suggests that the duration of stimulation may be longer for DbNP366 than for DbPA224. Enhanced repertoire selection and affinity focusing could lead to preferential expansion of the DbNP366-specific CD8+ T cells following secondary antigenic challenge. The obvious experiment is to look at the profiles of TCR Vβ usage for CD8+ T cells responding to these two epitopes at different stages of the primary and secondary response.
In general, the perception derived from dissection of the Listeria monocytogenes model (3), i.e., that the response profiles demonstrable following the recall of CD8+-T-cell memory reflect those detected after primary challenge, does not hold up for the influenza A viruses. In addition, our earlier idea that the overall magnitude of the memory CD8+-T-cell pool is a direct reflection of the initial clonal burst size (9) is clearly too simplistic. It is also obvious that direct analysis of the events occurring at the site of virus-induced pathology is essential if the relative prominence of particular epitopes in the primary response to pathogens with a localized (as opposed to systemic) pathogenesis is to be assessed accurately. Furthermore, any of the conclusions made in the past about CD8+-T-cell immunodominance heirarchies from the analysis of CTL activity (4, 15) may need to be revised as these issues are addressed again using more sensitive, and thus more quantitative, techniques.
ACKNOWLEDGMENTS
We thank Joe Miller for technical help, and Vicki Henderson for assistance with the manuscript.
These experiments were supported by National Institutes of Health grants AI29579 and CA21765 and The American Lebanese Syrian Associated Charities (ASLAC). G.T.B. is a C. J. Martin Fellow of the Australian National Health and Medical Research Council (Fellowship regkey 977 309).
REFERENCES
- 1.Altman J D, Moss P, Goulder P, Barouch D H, McHeyzer-Williams M, Bell J I, McMichael A J, Davis M M. Phenotypic analysis of antigen-specific T lymphocytes. Science. 1996;274:94–96. [PubMed] [Google Scholar]
- 2.Bennink J R, Yewdell J W, Smith G L, Moss B. Anti-influenza virus cytotoxic T lymphocytes recognize the three viral polymerases and a nonstructural protein: responsiveness to individual viral antigens is major histocompatibility complex controlled. J Virol. 1987;61:1098–1102. doi: 10.1128/jvi.61.4.1098-1102.1987. [DOI] [PMC free article] [PubMed] [Google Scholar]
- 3.Busch D H, Pilip I M, Vijh S, Pamer E G. Coordinate regulation of complex T cell populations responding to bacterial infection. Immunity. 1998;8:353–362. doi: 10.1016/s1074-7613(00)80540-3. [DOI] [PubMed] [Google Scholar]
- 4.Doherty P C, Biddison W E, Bennink J R, Knowles B B. Cytotoxic T-cell responses in mice infected with influenza and vaccinia viruses vary in magnitude with H-2 genotype. J Exp Med. 1978;148:534–543. doi: 10.1084/jem.148.2.534. [DOI] [PMC free article] [PubMed] [Google Scholar]
- 5.Falk K, Rötzschke O, Stevanovic S, Jung G, Rammensee H-G. Allele-specific motifs revealed by sequencing of self-peptides eluted from MHC molecules. Nature. 1991;351:290–296. doi: 10.1038/351290a0. [DOI] [PubMed] [Google Scholar]
- 6.Flynn K J, Belz G T, Altman J D, Ahmed R, Woodland D L, Doherty P D. Virus-specific CD8+ T cells in primary and secondary influenza pneumonia. Immunity. 1998;8:683–691. doi: 10.1016/s1074-7613(00)80573-7. [DOI] [PubMed] [Google Scholar]
- 7.Flynn K J, Riberdy J M, Christensen J P, Altman J D, Doherty P D. In vivo proliferation of naive and memory influenza-specific CD8(+) T cells. Proc Natl Acad Sci USA. 1999;96:8597–8602. doi: 10.1073/pnas.96.15.8597. [DOI] [PMC free article] [PubMed] [Google Scholar]
- 8.Hamilton-Easton A, Eichelberger M. Virus-specific antigen presentation by different subsets of cells from lung and mediastinal lymph node tissues of influenza virus-infected mice. J Virol. 1995;69:6359–6366. doi: 10.1128/jvi.69.10.6359-6366.1995. [DOI] [PMC free article] [PubMed] [Google Scholar]
- 9.Hou S, Hyland L, Ryan K W, Portner A, Doherty P C. Virus-specific CD8+ T-cell memory determined by clonal burst size. Nature. 1994;369:652–654. doi: 10.1038/369652a0. [DOI] [PubMed] [Google Scholar]
- 10.Kägi D, Seiler P, Pavlovic J, Ledermann B, Bürki K, Zinkernagel R M, Hengartner H. The roles of perforin- and Fas-dependent cytotoxicity in protection against cytopathic and noncytopathic viruses. Eur J Immunol. 1995;25:3256–3262. doi: 10.1002/eji.1830251209. [DOI] [PubMed] [Google Scholar]
- 11.Kersh G J, Kersh E N, Fremont D H, Allen P M. High- and low-potency ligands with similar affinities for the TCR: the importance of kinetics in TCR signaling. Immunity. 1998;9:817–826. doi: 10.1016/s1074-7613(00)80647-0. [DOI] [PubMed] [Google Scholar]
- 12.Kilbourne E D. Further influenza vaccines and the use of genetic recombinants. Bull W H O. 1969;41:643–645. [PMC free article] [PubMed] [Google Scholar]
- 13.Lalvani A, Brookes R, Hambleton S, Britton W J, Hill A V, McMichael A J. Rapid effector function in CD8+ memory T cells. J Exp Med. 1997;186:859–865. doi: 10.1084/jem.186.6.859. [DOI] [PMC free article] [PubMed] [Google Scholar]
- 14.Ljunggren H-G, Stam N J, Öhlén C, Neefjies J J, Höglund P, Heemels M T, Bastin J, Schumacher T N M, Townsend A, Karre K, Pleogh H. Empty MHC class I molecules come out in the cold. Nature. 1990;346:476–480. doi: 10.1038/346476a0. [DOI] [PubMed] [Google Scholar]
- 15.Mullbacher A. Neonatal tolerance to alloantigens alters major histocompatibility complex-restricted response patterns. Proc Natl Acad Sci USA. 1981;78:7689–7691. doi: 10.1073/pnas.78.12.7689. [DOI] [PMC free article] [PubMed] [Google Scholar]
- 16.Murali-Krishna K, Altman J D, Suresh M, Sourdive D J, Zajac A J, Miller J D, Slansky J, Ahmed R. Counting antigen-specific CD8 T cells: a reevaluation of bystander activation during viral infection. Immunity. 1998;8:177–187. doi: 10.1016/s1074-7613(00)80470-7. [DOI] [PubMed] [Google Scholar]
- 17.Oukka M, Rich N J, Kosmatopoulos K. A nonimmunodominant nucleoprotein-derived peptide is presented by influenza A virus-infected H-2b cells. J Immunol. 1994;152:4843–4851. [PubMed] [Google Scholar]
- 18.Palese P, Young J F. Variation of influenza A, B and C viruses. Science. 1982;215:1468–1474. doi: 10.1126/science.7038875. [DOI] [PubMed] [Google Scholar]
- 19.Savage P A, Boniface J J, Davis M M. A kinetic basis for T cell receptor repertoire selection during an immune response. Immunity. 1999;10:485–492. doi: 10.1016/s1074-7613(00)80048-5. [DOI] [PubMed] [Google Scholar]
- 20.Stevenson P G, Belz G T, Altman J D, Doherty P C. Virus-specific CD8(+) T cell numbers are maintained during gamma- herpesvirus reactivation in CD4-deficient mice. Proc Natl Acad Sci USA. 1998;95:15565–15570. doi: 10.1073/pnas.95.26.15565. [DOI] [PMC free article] [PubMed] [Google Scholar]
- 21.Topham D J, Tripp R A, Doherty P C. CD8+ T cells clear influenza virus by perforin or Fas-dependent processes. J Immunol. 1997;159:5197–5200. [PubMed] [Google Scholar]
- 22.Tough D F, Sprent J. Lifespan of gamma/delta T cells. J Exp Med. 1998;187:357–365. doi: 10.1084/jem.187.3.357. [DOI] [PMC free article] [PubMed] [Google Scholar]
- 23.Townsend A R M, Rothbard J, Gotch G, Bhadur G, Wraith D, McMichael A J. The epitopes of influenza nucleoprotein recognized by cytotoxic T lymphocytes can be defined with short synthetic peptides. Cell. 1986;44:959–968. doi: 10.1016/0092-8674(86)90019-x. [DOI] [PubMed] [Google Scholar]
- 24.Usherwood E J, Hogg T L, Woodland D L. Enumeration of antigen-presenting cells in mice infected with Sendai virus. J Immunol. 1999;162:3350–3355. [PubMed] [Google Scholar]
- 25.Vitiello A, Yuan L, Chestnut R W, Sidney J, Southwood S, Farness P, Jackson M R, Peterson P A, Sette A. Immunodominance analysis of CTL responses to influenza PR8 virus reveals two new dominant and subdominant Kb-restricted epitopes. J Immunol. 1996;157:5555–5562. [PubMed] [Google Scholar]
