T-type α1H Ca2+ channels are involved in Ca2+ signaling during terminal differentiation (fusion) of human myoblasts (original) (raw)
Abstract
Mechanisms underlying Ca2+ signaling during human myoblast terminal differentiation were studied using cell cultures. We found that T-type Ca2+ channels (T-channels) are expressed in myoblasts just before fusion. Their inhibition by amiloride or Ni2+ suppresses fusion and prevents an intracellular Ca2+ concentration increase normally observed at the onset of fusion. The use of antisense oligonucleotides indicates that the functional T-channels are formed by α1H subunits. At hyperpolarized potentials, these channels allow a window current sufficient to increase [Ca2+]i. As hyperpolarization is a prerequisite to myoblast fusion, we conclude that the Ca2+ signal required for fusion is produced when the resting potential enters the T-channel window. A similar mechanism could operate in other cell types of which differentiation implicates membrane hyperpolarization.
At terminal differentiation, skeletal muscle myoblasts fuse to form multinucleated myotubes. This fusion process is crucial for the development of skeletal muscles and, in the adult, for muscle repair and hypertrophy. Fusion is strictly Ca2+-dependent (1, 2), as it is inhibited by low extracellular or intracellular Ca2+ concentrations (3, 4), and there is evidence that a net Ca2+ influx into myoblasts is a prerequisite for myotube formation (5, 6).
The mechanism by which Ca2+ enters myoblasts before fusion is still a matter of debate (7–10). Using clonal myoblast cultures, we have examined how Ca2+ enters human myoblasts at the onset of fusion. The results presented here indicate that voltage-gated T-type Ca2+ channels are required for myoblast fusion. We found that the biophysical properties of human T-type Ca2+ channels of fusion-competent myoblasts allow a substantial window current at hyperpolarized potentials. As myoblasts hyperpolarize just before fusion (11–13), we suggest that the Ca2+ signal required for human myoblasts to fuse is mediated by calcium ions entering into the cells via this window current.
Experimental Procedures
Dissociation and Culture Procedures and Electrophysiological Recordings.
Human skeletal muscle and clonal cultures of myoblasts were prepared as described (11, 14). Voltage-clamp recordings were obtained at 20–22°C by using the whole-cell version of the patch-clamp technique (11, 15). Solutions to record T-type Ca2+ currents were as follows. Intracellular (pipette) solution (in mM): KCl 115, TEA-Cl 30, MgCl2 2, Hepes 10, glucose 5, 1,2-bis(2-aminophenoxy)ethane-N,N,_N_′,_N_′-tetraacetate (BAPTA) 1, MgATP 3 (pH 7.3). Bath (extracellular) solution (in mM): CaCl2 1.8, TEA-Cl 130, KCl 5, Hepes 5, MgCl2 2, glucose 8, tetrodotoxin 0.01, 4-AP 2, nifedipine 0.01 (pH 7.4).
Antisense Oligonucleotide Injection into Small Myotubes.
Oligonucleotides were synthesized (Eurogentec, Brussels) based on available sequences of human T-channel α1 subunits: Antisense against α1G: 5′-GCACCTGTACTCTGTGTCTC-3′ (nucleotides 2,084–2,103, GenBank accession no. AF126966); antisense against α1H: 5′-GCGCCCTCGGTCATGGTGGC-3′ (nucleotides 72–91, GenBank accession no. AF051946); antisense against α1I: 5′-CCTTGTATGGTGAAGTTCTC-3′ (nucleotides 727–746, GenBank accession no. AF129133). A scrambled oligonucleotide (5′-CTAGGTAGTCGCTCCTGCGT-3′) was used as control.
Myotubes (200–400 pF) were injected with an INJECT + MATIC microinjector system (INJECT + MATIC, Geneva). The solution of the injection pipette contained (in mM) antisense oligonucleotides 0.4, KCl 135, NaCl 5, MgCl2 1, Hepes 5, BAPTA 0.05, glucose 5 (pH 7.3). To identify the injected myotubes 48 h after the injections, the pipette solution contained 2.5 μg/ml neutral dextran rhodamine B, 70 kDa (Molecular Probes).
Intracellular Free Ca2+ ([Ca2+]i) Measurements_._
(i_) Evaluation of resting [Ca_ 2+ ] i using fura-2-AM (Fig.
1).
Myoblasts were cultured for 3–4 days at low density in proliferation or differentiation medium, with or without drugs. On the day of the experiment, myoblasts were preincubated in differentiation medium containing 4 μM fura-2-AM. Free [Ca2+]i was evaluated as in ref. 12. Calibration was achieved by using the equation: [Ca2+] = _K_d ⋅ (_F_380min/_F_380max) ⋅ [(R − _R_min)/(_R_max − R)], where _K_d was 225 nM, R is the ratio of the two fluorescence intensities (340 nm/380 nm excitation light), _R_min was measured in a solution containing no Ca2+ (10 mM BAPTA), _R_max was measured in a solution containing 1.8 mM Ca2+, and _F_380min and _F_380max were the fluorescence intensities of all wavelengths longer than 520 nm of the calibration solutions containing no Ca2+ or 1.8 mM Ca2+, respectively (excitation at 380 nm). The calibration parameters (_R_min, _R_max, _F_380min, _F_380max) were measured before each experiment.
(ii_) Evaluation of [Ca_ 2+ ] i increase using indo-1 (Fig.
6).
Free [Ca2+]i and simultaneous whole-cell voltage-clamp measurements were performed on small myotubes (100–230 pF; 7–10 days in differentiation medium). Pipette and bath solutions were as described above, except that, in the pipette solution, the BAPTA was replaced by 100 μM indo-1. Emitted fluorescence was recorded at 405 and 485 nm (excitation 334 nm) with two Nikon P100 photometers. The use of 8 standard solutions (between 12 and 1,000 nM free Ca2+) allowed a direct evaluation of [_K_d ⋅ (_F_485min/_F_485max)], which was 1033 ± 189 nM. Mean _R_min and _R_max were 0.039 ± 0.004 and 0.49 ± 0.04 (n = 5), respectively.
T-Channel Subunit Expression Analysis by Reverse Transcription–PCR.
Reverse transcription–PCR was performed to detect α1 subunit transcripts of T-type Ca2+ channels. The primers (Microsynth, Balgach, Switzerland) used to amplify the 5′coding region included _Eco_RV and _Stu_I restriction sites (italicized) for subcloning. H1GF4: 5′-CG_GATATC_CGCTCATGCTGCCACCACC-3′ (nucleotides 1,769–1,785, GenBank accession no. AF126966); H1GR4: 5′-GA_AGGCCT_TCCACCTGTACTCTGTGTC-3′ (nucleotides 2,086–2,102, GenBank accession no. AF126966); H1HF1: 5′-CG_GATATC_CGGTTCGAGCTCGGCGTGTCAC-3′ (nucleotides 203–222, GenBank accession no. AF051946); H1h1: 5′-GA_AGGCCT_TCCGTTGCGTGCAGCGCCCACC-3′ (nucleotides 1,061–1,080, GenBank accession no. AF051946); H1IF2: 5′-CG_GATATC_CGCAAGGGGATGTGGCCTTGCC-3′ (nucleotides 742–761, GenBank accession no. AF129133); H1IR1: 5′-GA_AGGCCT_TCTAGTAACGGTTCCAGTTGAC-3′ (nucleotides 949–968, GenBank accession no. AF129133).
Statistics.
Unless specified, results are expressed as the means ± SEM.
Results
Human Myoblasts Require Both Extra and Intracellular Ca2+ To Fuse.
Human myoblasts can be induced to fuse into multinucleated myotubes by replacing the proliferation medium with differentiation medium (14), and maximum fusion is usually reached within 2–3 days. Reducing the Ca2+ concentration of the differentiation medium from 1.8 mM to 14 μM inhibited fusion by 95 ± 3%. To evaluate the need for intracellular Ca2+, myoblasts were loaded with the Ca2+ chelator BAPTA to reduce [Ca2+]i. The presence of 30 μM BAPTA-AM for 36 h in differentiation medium reduced fusion by 49 ± 3%. Higher concentrations of BAPTA-AM were toxic to the cells. These results indicate that a reduction of either extra or intracellular Ca2+ affects human myoblast fusion.
A Subpopulation of Fusion-Competent Myoblasts with an Increased [Ca2+]i.
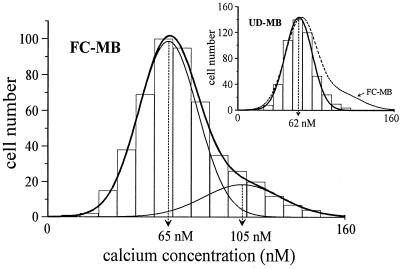
As Ca2+ is required for fusion to occur, we examined whether the resting [Ca2+]i of undifferentiated myoblasts was lower than that of fusion-competent myoblasts. These latter cells are myoblasts cultured at low density in the differentiation medium for 2–3 days. In these conditions, myoblasts are induced to proceed through the steps preceding fusion but, as they cannot contact neighboring cells, they remain mononucleated (16). Fig. 1 shows that undifferentiated myoblasts have a homogenous resting [Ca2+]i of 62 ± 14 nM (mean ± SD), whereas the population of fusion-competent myoblasts consists of two subpopulations characterized by different resting [Ca2+]i. Eighty percent of the fusion-competent myoblasts have a resting [Ca2+]i similar to that of undifferentiated myoblasts (65 ± 14 nM, n = 393); the remaining 20% have a significantly (P < 0.001) increased resting [Ca2+]i (105 ± 21 nM, n = 98).
Figure 1.
A subpopulation with increased resting [Ca2+]i appears in fusing myoblasts. Myoblasts have been distributed in 16 bins of 10 nM according to their resting [Ca2+]i. Distributions were fitted with either a simple (Inset, undifferentiated myoblasts: UD-MB) or a double (fusion-competent myoblasts: FC-MB) Gaussian equation. To emphasize the difference, the double Gaussian fit from the main graph is shown in the inset as a broken line.
The molecular mechanisms responsible for the high resting [Ca2+]i in some fusion-competent myoblasts were investigated in myoblasts exposed to selected drugs for 3–4 days. In the presence of nifedipine (10 μM), an L-type channel antagonist, the two subpopulations with low and high [Ca2+]i were present (60 ± 17 nM and 99 ± 20 nM, respectively). The culture medium was renewed every day to avoid nifedipine degradation. On the other hand, when either Ni2+ (200 μM) or amiloride (100 μM) (17), two T-type Ca2+ channel antagonists, was added to the differentiation medium, the cells remained as a homogenous population of cells with low resting [Ca2+]i (data not shown).
These results indicate that voltage-gated T-type Ca2+ channels, rather than L-type, could be responsible for the increase of [Ca2+]i that precedes fusion. This prompted us to explore for the presence of T-type Ca2+ channels in fusion-competent myoblasts.
Voltage-Gated T-Type Ca2+ Channels Are Expressed in FusionCompetent Myoblasts.
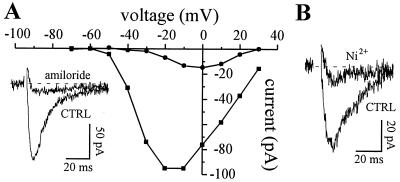
Undifferentiated myoblasts do not express T-type Ca2+ channels. The earliest recording of T-current was obtained in fusion-competent myoblasts 24 h after transfer to differentiation medium. After 3–4 days in differentiation medium, about 25% of recorded myoblasts expressed T-channels. Fig. 2 A and B shows typical T-currents, carried here by Ba2+. The T-current has a low threshold of activation, inactivates quickly during depolarizing voltage steps, and is inhibited by amiloride (Fig. 2A) and Ni2+ (Fig. 2B). A dihydropyridine-sensitive Ca2+ current was also seen in a small fraction of fusion-competent myoblasts (about 10%) after 3–4 days in differentiation (data not shown). This current was considered to be an L-type current.
Figure 2.
Currents through T-type Ca2+ channels in fusion-competent myoblasts. Ba2+ (10 mM) was used as a charge carrier. (A) The cell was held steadily at −90 mV and stepped to values between −70 mV and +30 mV for 80 ms. Peak T-currents were plotted in the absence (squares) and in the presence of 300 μM amiloride (circles). Leak current was estimated by adding 1 mM Cd2+ and was subtracted. (Inset) Voltage step to −20 mV. (B) Another cell. Voltage step to −10 mV. Ni2+ (50 μM) also blocks T-channels.
Before testing the effect of amiloride and Ni2+ on myoblast fusion (see below), we examined the ability of these agents to discriminate between T- and L-channels in fusion-competent myoblasts and small myotubes. For convenience, as L-current is expressed only in a small fraction of fusion-competent myoblasts but in all small myotubes, the pharmacology of the L-current was mostly done in small myotubes. As expected, T-type current is very sensitive to amiloride (IC50 = 25 μM, n = 6) whereas L-type current is not affected by 100 μM amiloride (P = 0.74, n = 5). Conversely, Ni2+, which has been described to block more efficiently T- than L-current in neurons (18), inhibits T- and L-currents recorded in fusion-competent myoblasts and small myotubes with almost the same potency (T-current: IC50 = 13 μM, n = 14; L-current: IC50 = 31 μM, n = 6). We therefore conclude that human myogenic cells express T-channels just before fusion and that, unlike L-channels, these channels can be inhibited by amiloride.
Molecular Characterization of T-Type Ca2+ Channels.
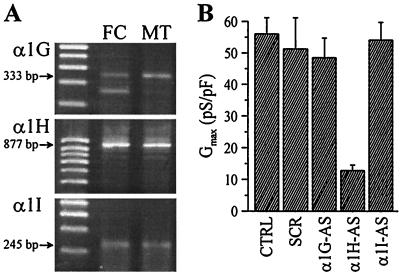
We examined whether the T-channels expressed in fusing myoblasts could be encoded by one of the three α1 subunit genes recently identified. These three subunits (α1G, α1H, and α1I) encode T-type Ca2+ channels in neurons and heart cells (19–23). The presence of T-channel α1 subunit transcripts in fusing myoblasts and myotubes was evaluated by reverse transcription–PCR using sets of primers to amplify 5′ coding regions. PCR fragments of expected size for all three T-channel α1 subunits could be detected in both preparations of myogenic cells (Fig. 3A).
Figure 3.
Presence of T-channel α1 subunits in fusing myoblasts and myotubes. (A) PCR products of expected sizes for the three α1 subunits were obtained from human fusion-competent myoblasts (FC) and myotubes (MT). Sequencing revealed 100% identity with sequences of human Ca2+ channel subunits. (B) Whole-cell T-type Ca2+ conductances recorded in small myotubes 48 h after cytoplasmic injection of antisense (AS) or scrambled (SCR) oligonucleotides. Between 10 and 13 cells were recorded in each condition.
To characterize further the α1 subunit gene(s) forming the T-channels recorded in fusing myoblasts, antisense oligonucleotides were designed to specifically hybridize to nonconserved 5′-regions of the α1G, α1H, or α1I transcripts. As T-channels are expressed in only about 25% of fusion-competent myoblasts, oligonucleotides were injected into small myotubes, shortly after fusion, which always express a T-current. This procedure is justified by the fact that the biophysical properties of the T-current in fusion-competent myoblasts and myotubes are identical (see below; Table 1). Fig. 3B shows that exclusively antisense oligonucleotides directed against the α1H transcript could significantly reduce the T-type Ca2+ conductance. The remaining small conductance not affected by the α1H antisense is probably attributable to T-channels that escaped the antisense strategy (e.g., slow protein turnover).
Table 1.
Summary of the voltage-dependent properties of T-currents recorded in fusion competent myoblasts and small myotubes
| Fusion-competent myoblasts, n = 11 | Myotubes, n = 15 | |
|---|---|---|
| Cell capacity | 37 ± 7 pF | 139 ± 12 pF |
| Maximum conductance | 0.27 ± 0.05 nS | 3.18 ± 0.66 nS |
| Activation curve: _V_o and Q | −42 ± 2 mV and 4.6 ± 0.2 e.c. | −42 ± 1 mV and 5.3 ± 0.3 e.c. |
| Inactivation curve: _V_o and Q | −63 ± 2 mV and 5.9 ± 0.5 e.c. | −65.1 ± 1 mV and 5.9 ± 0.4 e.c. |
| _V_m for maximum window current | −58 ± 2 mV | −57 ± 1 mV |
| Maximum window current size | −0.37 ± 0.08 pA | −2.57 ± 0.64 pA |
From these data, we propose that α1H subunits form the main functional T-channel in these cells. This conclusion is further supported by the pharmacological profile of the α1H subunit. Indeed, recent work indicates that the Ni2+ IC50 value for α1H is around 13 μM whereas the corresponding IC50 values for α1I and α1G are 17- to 19-fold higher (216 and 250 μM, respectively) (24). We found a Ni2+ IC50 value of 13 μM for the T-current expressed in human myoblasts (see above).
Myoblast Fusion Requires Voltage-Gated T-Type Ca2+ Channels.
Our results suggest that the expression of T-type Ca2+ channels and the increase of resting [Ca2+]i in a subpopulation of myoblasts may be linked events that precede fusion. As both T-channel activity and the increase of resting [Ca2+]i can be suppressed by either Ni2+ or amiloride, we tested whether fusion was indeed blocked in the presence of these compounds.
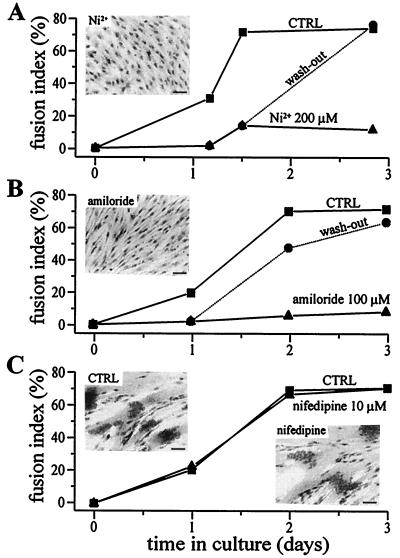
Both Ni2+ (200 μM) and amiloride (100 μM) inhibited fusion drastically (Fig. 4 A and B, triangles) with respect to control (Fig. 4 A and B, squares). To rule out possible toxic effects of these compounds on myoblasts, they were removed from the culture medium after 24–36 h, and fusion was evaluated 36–48 h later. Fig. 4 A and B, circles and “wash-out” dotted line, shows that fusion proceeded normally after Ni2+ or amiloride removal.
Figure 4.
Ni2+ and amiloride, but not nifedipine, inhibit myoblast fusion. (A and B) Myoblast fusion is inhibited by Ni2+ (A) and amiloride (B), and the effect is reversible. Fusion was induced with differentiation medium and was assessed three times within 3 days in culture. The fusion index is defined as the number of nuclei in myotubes divided by the total number of nuclei counted (16). Fusion in control conditions is represented by squares. In sister cultures, the two compounds were added to the differentiation medium either during the entire experiment (triangles) or for a period of 24–36 h (circles). Error bars are omitted because they are smaller than symbols. (C) Myoblast fusion is not affected by nifedipine. Squares represent the fusion rate in control conditions and triangles in the presence of 10 μM nifedipine. Photographs represent hematoxylin-stained cultures after 3 days in differentiation medium without (CTRL) and with Ni2+, amiloride, or nifedipine. (Bars = 40 μm.)
Similar inhibitions of myoblast fusion by Ni2+ and amiloride were observed in three independent experiments. In contrast, when nifedipine (10 μM) is added for 3 days to the differentiation medium, fusion proceeds normally (Fig. 4C; similar results were observed in two other experiments).
These observations indicate that the inhibition of myoblast fusion by amiloride and Ni2+ is not a result of a toxic effect of these compounds and that, unlike L-type Ca2+ channel activity, T-type Ca2+ channel activity appears required for the normal fusion process to occur.
To exclude that the observed effect of amiloride and Ni2+ on fusion was attributable to an interference with any Na+/H+ exchanger, ethylisopropyl amiloride, a compound that inhibits these exchangers with a much higher potency than amiloride, was tested on myoblast fusion. Ethylisopropyl amiloride, at a concentration of 20 μM, which should massively inhibit amiloride-sensitive Na+/H+ exchangers (25, 26), was applied on the cells for 36 h and produced only a small decrease in myoblast fusion from 72 ± 2% to 64 ± 2%. These results show that most of the effect of amiloride on fusion is not caused by an inhibition of Na+/H+ exchangers. In addition, it is important to mention that amiloride-sensitive Na+ channels do not seem to be involved in the fusion process. Indeed, 10 μM amiloride, which should block any type of amiloride-sensitive Na+ channel (27), does not affect fusion (P = 0.9; data not shown).
T-Type Ca2+ Channels Generate a Window Current at Hyperpolarized Potentials.
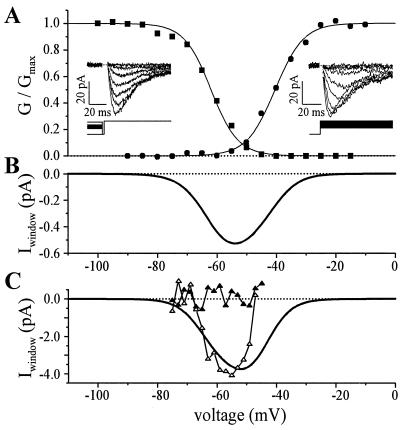
T-type Ca2+ channels produce a transient inward current during depolarizing steps as they activate and then inactivate during sustained membrane depolarizations. A complete inactivation of the T-channels during a depolarizing step will lead to a current that is entirely transient. On the other hand, if a tiny fraction of the channels does not inactivate during the step, there will be a small steady-state current. This steady-state current, referred to as a window current, can exist when there is an overlap of the voltage range for activation and inactivation. Because a small but sustained inward Ca2+ current (even smaller than 1 pA) can potentially generate a relatively large increase in [Ca2+]i, we looked for the presence of a T-window Ca2+ current in fusion-competent myoblasts.
We found that the T-channels expressed in fusion-competent myoblasts should be able to generate a window current at hyperpolarized potential (Fig. 5 A and B). From the voltage dependence of activation and inactivation evaluated in 11 fusion-competent myoblasts, we computed that a maximum window current was generated at a potential of −58 ± 2 mV (Fig. 5B), and that its amplitude would amount to −0.37 ± 0.01 pA (for details, see Table 1). Because of the effects on surface charge screening by most divalent cations (28), window currents were always evaluated in a bath solution containing a physiological Ca2+ concentration (1.8 mM).
Figure 5.
Whole-cell properties of the T-type Ca2+ current. Ca2+ (1.8 mM) was used as a charge carrier. (A) Fusion-competent myoblast. Circles represent the normalized activation conductance curve (holding potential between steps was −100 mV) and squares the normalized inactivation conductance curve (steady holding potential between steps lasted 10 s). Conductances were normalized to the maximum conductance and were fitted with a Boltzmann equation. (Left Inset) Current traces from steady-state inactivation voltage protocol (test potential was to −30 mV). (Right Inset) Current traces during depolarizing steps. Leak current was obtained by adding 1 mM Cd2+, and was subtracted. (B) Predicted T-window current, same cell as in A. The predicted T-window current was obtained by multiplying the predicted T-window conductance by the driving force on calcium ions. Predicted T-window conductance was calculated by multiplying the activation conductance curve (not normalized) by the normalized inactivation conductance curve. (C) T-window current recorded in a small myotube. The voltage protocol to obtain the continuous line representing the computed window current was the same as in B. Open triangles represent the inward Ca2+ current directly measured when the cell was held steadily for 3 s at potentials between −45 mV and −75 mV (steps of −2 mV). Ca2+ currents were measured at the end of the 3-s holding potentials to ensure that T-channels were at steady-state. Leak current was estimated by linear extrapolation of the current record at potential between −69 and −75 mV, and was subtracted. Closed triangles represent the currents evaluated during the same voltage protocol but after addition of 1 mM Cd2. The difference between computed and directly measured window current at potentials more depolarized than −50 mV could be explained by a residual activation of Ca2+-dependent outward currents.
To confirm that the computed T-window Ca2+ current exists at hyperpolarized potentials, we voltage-clamped cells at potentials between −45 and −75 mV for several seconds and looked for a steady-state inward current (Fig. 5C). As the amplitude of the window current was expected to be below the resolution of whole-cell recordings in fusion-competent myoblasts, these experiments were performed in small myotubes, which have higher T-current densities. We believe that this is legitimate because the voltage-dependent characteristics of the T-current in fusion-competent myoblasts and myotubes are statistically identical (Table 1). In six small myotubes (113 ± 14 pF), a steady inward current of −3.00 ± 0.65 pA was measured. This sustained inward current was generated by a holding potential of −57 ± 1 mV. In the same six myotubes, the T-window current computed from the voltage dependence of activation and inactivation was maximum at −59 ± 3 mV and had a mean amplitude of −2.77 ± 0.5 pA. Taken together, these results demonstrate that fusion-competent myoblasts and freshly formed myotubes are endowed with a T-window Ca2+ current that is activated at potentials near −60 mV.
A T-Window Current Is Sufficient to Increase [Ca2+]i.
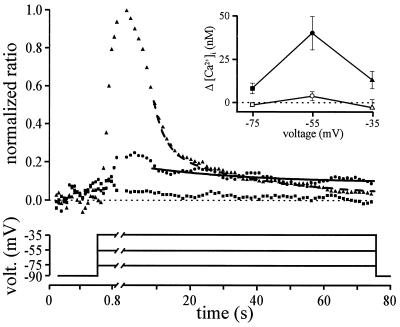
The aim of the next experiment was to demonstrate that a T-window current elicited at hyperpolarized potentials can generate an increase in [Ca2+]i. For this purpose, small myotubes were stepped to three different membrane potentials, and [Ca2+]i was simultaneously evaluated with indo-1. The first voltage step moved the potential below the activation range for T-channels (−75 mV) and hence should not generate any Ca2+ current or [Ca2+]i change. The second voltage step was to a voltage range in which T-channels activation and inactivation curves overlap (−55 mV) and should thus generate a sustained Ca2+ current and consequently a sustained [Ca2+]i change. The third voltage step was to a range in which all T-channels inactivate with time (−35 mV). This step potential should only generate a transient Ca2+ current, and thus no sustained [Ca2+]i change should be seen. Step potentials were maintained constant for more than 60 s, which is the necessary time for [Ca2+]i to reach a steady-state (especially after a step that induced a transient Ca2+ current).
Fig. 6 illustrates that stepping the potential of small myotubes to −75 mV did not modify much the [Ca2+]i and that, as expected, stepping the potential for 60 s to −55 mV, a potential at which the window T-current is elicited, led to a steady increase in [Ca2+]i. In five different cells, the steady increase in [Ca2+]i generated at −55 mV was 39 ± 9 nM. Fitting a decaying exponential to the data points confirmed that, after 60 s, [Ca2+]i has reached a steady-state. Fig. 6 also shows that a step to −35 mV only elicited a transient [Ca2+]i, and that no significant steady-state increase of [Ca2+]i was observed at this potential. Furthermore, the sustained [Ca2+]i increase seen at −55 mV did not occur when mibefradil, a potent T-channel blocker (10), was added to the superfusion solution (Fig. 6 Inset). We therefore conclude that T-channels can be activated steadily at hyperpolarized potentials and can carry a current that is large enough to modify [Ca2+]i.
Figure 6.
The T-window Ca2+ current is large enough to induce a change in [Ca2+]i. Myotubes had a mean capacitance of 160 ± 28 pF. Ca2+ (1.8 mM) was used as the charge carrier. The main graph represents the mean 405 nm/485 nm indo-1 ratio variations of five small myotubes during three different voltage steps. The cells were stepped at −75 mV (squares), −55 mV (circles), and −35 mV (triangles) for 75 s because it is the required time for [Ca2+]i to reach a steady-state. Maximum ratio increases during the step to −35 mV were normalized to 1. Continuous and dashed lines are decaying exponential fitted to the data points. (Inset) Indo-1 fluorescence ratios were evaluated during the last 10 s of the three voltage steps. Closed symbols represent the [Ca2+]i in control conditions, and open symbols the [Ca2+]i when mibefradil (10 μM) was added. Same five cells as main graph. Note that mibefradil was used rather than amiloride or Ni2+ because these agents affected the fluorescent signal of the extracellular solution.
Discussion
Ca2+ signaling plays an essential role in the terminal differentiation (fusion) of skeletal muscle myoblasts. The goal of this study was to document this Ca2+ signal and identify the mechanism responsible for it. Using human myoblast clonal cultures, we evaluated the precise temporal expression and role of voltage-gated Ca2+ channels in the fusion process. Human myogenic cells can either be maintained in an undifferentiated state or, by a simple change of culture medium composition, rapidly triggered to differentiate and fuse (14). This property allows us to investigate events at the onset of fusion using fusion-competent myoblasts (16).
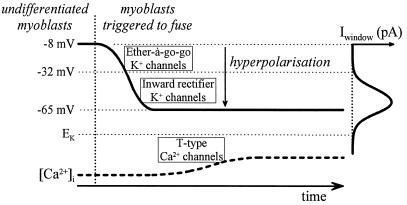
In previous work, we found that myoblasts, as they acquire fusion-competency, hyperpolarize because of the sequential expression of two different K+ currents (Fig. 7). An ether-à-go-go K+ current is expressed first and hyperpolarizes fusion-competent myoblasts to an intermediate resting potential of approximately −30 mV (12, 29, 30). Then, slightly before fusion, the expression of an inward rectifier K+ current causes fusion-competent myoblasts to hyperpolarize further to approximately −65 mV (11). Inhibiting the inward rectifier K+ current prevents fusion (11).
Figure 7.
Model of the events leading to an increase in [Ca2+]i in fusing myoblasts.
In the present study, we show that T-type Ca2+ channels are expressed before fusion and can induce an increase in [Ca2+]i. Inhibiting T-channel activity prevents both the increase in [Ca2+]i in fusion-competent myoblasts and the process of fusion. Interestingly, at hyperpolarized resting potentials, the T-type channels expressed can give rise to a window Ca2+ current large enough to increase [Ca2+]i in fusion-competent myoblasts. We suggest that the Ca2+ signal necessary for fusion is produced when the resting potential of myoblasts enters the domain of the T-window current, at hyperpolarized resting potentials.
A [Ca2+]i Increase Is Observed in a Subpopulation of Fusion-Competent Myoblasts.
We found that about 20% of fusion-competent myoblasts had an elevated [Ca2+]i after 2–4 days in differentiation medium. We should make it clear that this subpopulation represents myoblasts with an elevated [Ca2+]i at the time of the evaluation in low density cultures. It is possible that the small proportion of fusion-competent myoblasts with T-channels act as pioneer cells that promote fusion in surrounding cells. We do not favor this possibility because T-channel density is higher in freshly formed myotubes than in fusion-competent myoblasts, and a smaller T-channel density would be expected in freshly formed myotubes if they were generated mainly from cells without T-channels. However, an up-regulation of T-channel expression immediately after fusion cannot be excluded. Another explanation for the low percentage of fusion-competent myoblasts with high [Ca2+]i is that myoblasts normally stimulate one another by autocrine mechanisms (31) and that this is less likely to occur in low density cultures. Finally, as we shall discuss below, it is also possible that the [Ca2+]i oscillates in fusion-competent myoblasts so that, at a given time, only a fraction of the cells can be detected with a high [Ca2+]i. It should be mentioned that, as the direct demonstration of T-channel expression and myoblast fusion is not presently feasible in the same cell for technical reasons, we cannot exclude that another molecular mechanism leading to Ca2+ entry and fusion may coexist with the one described in this paper.
T-Type Ca2+ Channel Openings and Ca2+ Entry.
Our initial hypothesis was that T-channels, in combination with voltage-gated Na+ and K_+_ channels, would contribute to the generation of bursts of action potentials just before fusion (11). However, as a high concentration of tetrodotoxin does not affect fusion (10 μM, data not shown), it seems unlikely that Na+ channel-linked action potentials are necessary to activate T-channels.
The data presented here point to another mechanism of Ca2+ entry via T-channels: i.e., the activation of a T-window Ca2+ current. This window current, generated by the overlap of the T-channel activation and inactivation voltage range, is situated in the domain of voltages in which fusion-competent myoblasts operate when they have expressed inward rectifier K+ channels (−65 ± 12 mV, mean ± SD). Thus, the hyperpolarization from approximately −30 mV to −65 mV induced by inward rectifier K+ channels and observed just before fusion (11) would, on its own, suffice to open T-channels and to induce the increase in [Ca2+]i we observe in fusion-competent myoblasts (Fig. 7). We cannot exclude, however, that other forms of activation of T-channels could occur during fusion.
It is worth mentioning that a sustained inward window Ca2+ current of about 0.5 pA (caused by steady T-channels activation) would rapidly load the cell with Ca2+ if no compensatory mechanisms are activated. Although myoblasts are partially dialyzed by the patch electrode, we found that holding them for 1 min at −55 mV increased the [Ca2+]i by about 40 nM (see Fig. 6). A possible mechanism to avoid Ca2+ overload could be an up-regulation of Ca2+-ATPase pumps at the time of fusion. A Ca2+-ATPase muscle-specific isoform is expressed at myotube formation in mouse C2 myoblasts (32). Another possible way of reducing Ca2+ entry would be the activation of Ca2+-activated K+ channels, which would drive the membrane potential toward EK, i.e., away from the window domain, allowing Ca2+ extrusion mechanisms to reduce [Ca2+]i.
Interestingly, an effect of the window T-current could be mediated by an acetylcholine-like compound that human myoblasts synthesize and release in a Ca2+ dependent way (31). As acetylcholine has been shown to accelerate fusion (16), Ca2+ entering through the window of the α1H T-channel of fusion-competent myoblasts could trigger release of this compound and thereby favor differentiation of neighboring cells, or contribute to further increase [Ca2+]i through muscle nicotinic acetylcholine receptors, which are permeable to Ca2+ (33).
Acknowledgments
We thank M. Berti and P. Brawand for their excellent technical assistance on cell cultures, Dr. A. Kaelin for providing the muscle biopsies, and T. Occhiodoro for her help in the early part of this work. This work was supported by grants from the Fonds National Suisse pour la Recherche Scientifique (No. 31-054177.98 and 31-46893.96) and the Fondation Suisse pour la Recherche sur les Maladies Musculaires.
Abbreviation
BAPTA
1,2-bis(2-aminophenoxy)ethane-N,N,_N_′,_N_′-tetraacetate
References
- 1.Shainberg A, Yagil G, Yaffe D. Exp Cell Res. 1969;58:163–167. doi: 10.1016/0014-4827(69)90127-x. [DOI] [PubMed] [Google Scholar]
- 2.Wakelam M J. Biochem J. 1985;228:1–12. doi: 10.1042/bj2280001. [DOI] [PMC free article] [PubMed] [Google Scholar]
- 3.Przybylski R J, MacBride R G, Kirby A C. In Vitro Cell Dev Biol. 1989;25:830–838. doi: 10.1007/BF02623667. [DOI] [PubMed] [Google Scholar]
- 4.Przybylski R J, Szigeti V, Davidheiser S, Kirby A C. Cell Calcium. 1994;15:132–142. doi: 10.1016/0143-4160(94)90052-3. [DOI] [PubMed] [Google Scholar]
- 5.David J D, See W M, Higginbotham C A. Dev Biol. 1981;82:297–307. doi: 10.1016/0012-1606(81)90453-x. [DOI] [PubMed] [Google Scholar]
- 6.Rapuano M, Ross A F, Prives J. Dev Biol. 1989;134:271–278. doi: 10.1016/0012-1606(89)90099-7. [DOI] [PubMed] [Google Scholar]
- 7.Entwistle A, Zalin R J, Bevan S, Warner A E. J Cell Biol. 1988;106:1693–1702. doi: 10.1083/jcb.106.5.1693. [DOI] [PMC free article] [PubMed] [Google Scholar]
- 8.Seigneurin-Venin S, Parrish E, Marty I, Rieger F, Romey G, Villaz M, Garcia L. Exp Cell Res. 1996;223:301–307. doi: 10.1006/excr.1996.0085. [DOI] [PubMed] [Google Scholar]
- 9.Constantin B, Cognard C, Raymond G. Cell Calcium. 1996;19:365–374. doi: 10.1016/s0143-4160(96)90109-8. [DOI] [PubMed] [Google Scholar]
- 10.Liu J-H, Bijlenga P, Occhiodoro T, Fischer-Lougheed J, Bader C R, Bernheim L. Br J Pharmacol. 1999;126:245–250. doi: 10.1038/sj.bjp.0702321. [DOI] [PMC free article] [PubMed] [Google Scholar]
- 11.Liu J-H, Bijlenga P, Fischer-Lougheed J, Occhiodoro T, Kaelin A, Bader C R, Bernheim L. J Physiol (London) 1998;510:467–476. doi: 10.1111/j.1469-7793.1998.467bk.x. [DOI] [PMC free article] [PubMed] [Google Scholar]
- 12.Bijlenga P, Occhiodoro T, Liu J-H, Bader C R, Bernheim L, Fischer-Lougheed J. J Physiol (London) 1998;512:317–323. doi: 10.1111/j.1469-7793.1998.317be.x. [DOI] [PMC free article] [PubMed] [Google Scholar]
- 13.Shin K S, Park J Y, Kwon H, Chung C H, Kang M S. Am J Physiol. 1997;272:C894–C900. doi: 10.1152/ajpcell.1997.272.3.C894. [DOI] [PubMed] [Google Scholar]
- 14.Baroffio A, Aubry J P, Kaelin A, Krause R M, Hamann M, Bader C R. Muscle Nerve. 1993;16:498–505. doi: 10.1002/mus.880160511. [DOI] [PubMed] [Google Scholar]
- 15.Hamill O P, Marty A, Neher E, Sakmann B, Sigworth F J. Pflügers Arch. 1981;391:85–100. doi: 10.1007/BF00656997. [DOI] [PubMed] [Google Scholar]
- 16.Krause R M, Hamann M, Bader C R, Liu J-H, Baroffio A, Bernheim L. J Physiol (London) 1995;489:779–790. doi: 10.1113/jphysiol.1995.sp021091. [DOI] [PMC free article] [PubMed] [Google Scholar]
- 17.Tang C M, Presser F, Morad M. Science. 1988;240:213–215. doi: 10.1126/science.2451291. [DOI] [PubMed] [Google Scholar]
- 18.Nowycky M C, Fox A P, Tsien R W. Nature (London) 1985;316:440–443. doi: 10.1038/316440a0. [DOI] [PubMed] [Google Scholar]
- 19.Cribbs L L, Lee J H, Yang J, Satin J, Zhang Y, Daud A, Barclay J, Williamson M P, Fox M, Rees M, et al. Circ Res. 1998;83:103–109. doi: 10.1161/01.res.83.1.103. [DOI] [PubMed] [Google Scholar]
- 20.Perez-Reyes E, Cribbs L L, Daud A, Lacerda A E, Barclay J, Williamson M P, Fox M, Rees M, Lee J H. Nature (London) 1998;391:896–900. doi: 10.1038/36110. [DOI] [PubMed] [Google Scholar]
- 21.Lee J H, Daud A N, Cribbs L L, Lacerda A E, Pereverzev A, Klockner U, Schneider T, Perez-Reyes E. J Neurosci. 1999;19:1912–1921. doi: 10.1523/JNEUROSCI.19-06-01912.1999. [DOI] [PMC free article] [PubMed] [Google Scholar]
- 22.Mittman S, Guo J, Emerick M C, Agnew W S. Neurosci Lett. 1999;269:121–124. doi: 10.1016/s0304-3940(99)00319-5. [DOI] [PubMed] [Google Scholar]
- 23.Williams M E, Washburn M S, Hans M, Urrutia A, Brust P F, Prodanovich P, Harpold M M, Stauderman K A. J Neurochem. 1999;72:791–799. doi: 10.1046/j.1471-4159.1999.0720791.x. [DOI] [PubMed] [Google Scholar]
- 24.Lee J H, Gomora J C, Cribbs L L, Perez-Reyes E. Biophys J. 1999;77:3034–3042. doi: 10.1016/S0006-3495(99)77134-1. [DOI] [PMC free article] [PubMed] [Google Scholar]
- 25.Attaphitaya S, Park K, Melvin J E. J Biol Chem. 1999;274:4383–4388. doi: 10.1074/jbc.274.7.4383. [DOI] [PubMed] [Google Scholar]
- 26.Park K, Olschowka J A, Richardson L A, Bookstein C, Chang E B, Melvin J E. Am J Physiol. 1999;276:G470–G478. doi: 10.1152/ajpgi.1999.276.2.G470. [DOI] [PubMed] [Google Scholar]
- 27.Waldmann R, Champigny G, Bassilana F, Voilley N, Lazdunski M. J Biol Chem. 1995;270:27411–27414. doi: 10.1074/jbc.270.46.27411. [DOI] [PubMed] [Google Scholar]
- 28.Wilson D L, Morimoto K, Tsuda Y, Brown A M. J Membr Biol. 1983;72:117–130. doi: 10.1007/BF01870319. [DOI] [PubMed] [Google Scholar]
- 29.Bernheim L, Liu J-H, Hamann M, Haenggeli C A, Fischer-Lougheed J, Bader C R. J Physiol (London) 1996;493:129–141. doi: 10.1113/jphysiol.1996.sp021369. [DOI] [PMC free article] [PubMed] [Google Scholar]
- 30.Occhiodoro T, Bernheim L, Liu J-H, Bijlenga P, Sinnreich M, Bader C R, Fischer-Lougheed J. FEBS Lett. 1998;434:177–182. doi: 10.1016/s0014-5793(98)00973-9. [DOI] [PubMed] [Google Scholar]
- 31.Hamann M, Chamoin M C, Portalier P, Bernheim L, Baroffio A, Widmer H, Bader C R, Ternaux J P. J Physiol (London) 1995;489:791–803. doi: 10.1113/jphysiol.1995.sp021092. [DOI] [PMC free article] [PubMed] [Google Scholar]
- 32.Brandt P, Vanaman T C. J Neurochem. 1994;62:799–802. doi: 10.1046/j.1471-4159.1994.62020799.x. [DOI] [PubMed] [Google Scholar]
- 33.Decker E R, Dani J A. J Neurosci. 1990;10:3413–3420. doi: 10.1523/JNEUROSCI.10-10-03413.1990. [DOI] [PMC free article] [PubMed] [Google Scholar]
