Ornithine decarboxylase, kidney size, and the tubular hypothesis of glomerular hyperfiltration in experimental diabetes (original) (raw)
Abstract
In early diabetes, the kidney grows and the glomerular filtration rate (GFR) increases. This growth is linked to ornithine decarboxylase (ODC). The study of hyperfiltration has focused on microvascular abnormalities, but hyperfiltration may actually result from a prior increase in capacity for proximal reabsorption which reduces the signal for tubuloglomerular feedback (TGF). Experiments were performed in Wistar rats after 1 week of streptozotocin diabetes. Kidney weight, ODC activity, and GFR were correlated in diabetic and control rats given difluoromethylornithine (DFMO; Marion Merrell Dow, Cincinnati, Ohio, USA) to inhibit ODC. We assessed proximal reabsorption by micropuncture, using TGF as a tool for manipulating single-nephron GFR (SNGFR), then plotting proximal reabsorption versus SNGFR. ODC activity was elevated 15-fold in diabetic kidneys and normalized by DFMO, which also attenuated hyperfiltration and hypertrophy. Micropuncture data revealed an overall increase in proximal reabsorption in diabetic rats too great to be accounted for by glomerulotubular balance. DFMO prevented the overall increase in proximal reabsorption. These data confirm that ODC is required for the full effect of diabetes on kidney size and proximal reabsorption in early streptozotocin diabetes and are consistent with the hypothesis that diabetic hyperfiltration results from normal physiologic actions of TGF operating in a larger kidney, independent of any primary malfunction of the glomerular microvasculature.
Introduction
At the onset of diabetes mellitus, the kidney begins to grow and GFR increases. Some time later, structural changes can occur in the glomerulus which form the basis for progressive diabetic nephropathy. Intrarenal hemodynamic abnormalities, as manifest by glomerular hyperfiltration, are thought to be among the foremost factors responsible for the onset and progression of diabetic glomerulopathy. To account for these hemodynamic abnormalities, investigators have characterized the functional effects of diabetes on the various segments of the glomerular microvasculature (reviewed in ref. 1), and many substances have been invoked as humoral mediators of vasodilation in the diabetic glomerulus (reviewed in ref. 2). However, no single cause has emerged to account for glomerular hyperfiltration in diabetes. The principal idea behind the present study is that glomerular hyperfiltration in diabetes does not develop mainly because of disordered microvascular function or from imbalanced hormones impinging directly on the glomerulus. Instead, we propose that glomerular hyperfiltration results mainly from a primary increase in proximal tubular reabsorption which causes GFR to increase through the physiologic actions of tubuloglomerular feedback (TGF). Furthermore, we propose that this primary increase in reabsorption results, in good part, from hypertrophy of the tubule. This “tubular hypothesis” of diabetic hyperfiltration reverses the order of events as typically envisioned for the diabetic kidney, in which a primary reduction in vascular resistance causes GFR to increase and the tubule then grows larger in order to accommodate the increased filtered load.
If the TGF response were slow enough, one could confirm the tubular hypothesis of glomerular hyperfiltration by recording a lag time between enlargement of the kidney and the onset of hyperfiltration. However, the time required for TGF to evoke a change in GFR is on the order of several seconds (3), whereas diabetic hypertrophy proceeds continuously over days. Therefore, a TGF-mediated cause and effect relationship between kidney size and GFR will not be revealed by their temporal relationship. In fact, the most that can be said of the temporal relationship between hyperfiltration and renal hypertrophy in human type I diabetes is that they both occur early (4). Similarly, in rats with diabetes induced by streptozotocin, kidney size (5), kidney protein/DNA ratio (6), and GFR all increase within 24 hours of the onset of diabetes, the latter notwithstanding a concomitant decrease in plasma volume which would otherwise oppose an increase in GFR (7).
It is also not fully understood what mediates renal enlargement at the onset of diabetes or how growth of the tubule and tubular reabsorption might be linked in diabetes. Nonetheless, an arginine-ornithine-polyamine pathway has been implicated in enlargement of the diabetic kidney. For instance, it has been shown that the activity of ornithine decarboxylase (ODC) in the kidney increases after only 1 day of streptozotocin diabetes, and that the ODC inhibitor, difluoromethylornithine (DFMO), attenuates renal hypertrophy during the first week of streptozotocin diabetes (8). In the present study, ODC activity was manipulated in order to demonstrate that renal hypertrophy, increased proximal reabsorption, and glomerular hyperfiltration are all linked to increased renal ODC activity in rats with early diabetes. We also studied the activity of arginine decarboxylase (ADC), an enzyme whose product, agmatine, has been shown to deactivate ODC through induction of ODC antizyme (9).
Methods
Overview.
Studies were performed in male Wistar rats after 7–8 days of insulin-treated diabetes and in weight-matched controls. First, the role of ODC in renal hypertrophy and hyperfiltration was assessed by measuring ODC activity in kidney cortex and by measuring the effects of the ODC inhibitor, DFMO (Marion Merrell Dow, Cincinnati, Ohio, USA), on kidney weight and GFR. Then micropuncture experiments were performed, in which the TGF signal was artificially manipulated as a means for changing single-nephron GFR (SNGFR) so that proximal tubular reabsorption could be characterized over a range of SNGFR in individual nephrons. The effects of diabetes and/or DFMO on this relationship between kidney size, proximal reabsorption, and SNGFR were analyzed as a direct test of the tubular hypothesis. All animal experiments were conducted in accordance with the NIH Guide for the Care and Use of Laboratory Animals.
The TGF paradigm and the tubular hypothesis of hyperfiltration.
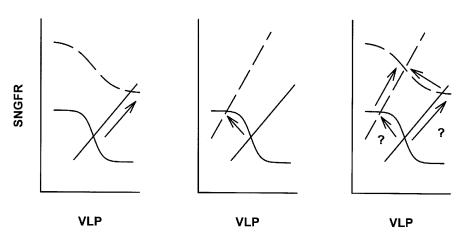
This “tubular hypothesis” of hyperfiltration is easily understood in terms of a familiar framework for describing interactions between the glomerulus and tubule which comprise the TGF system (shown in Figure 1). According to this framework, glomerular filtration and tubular reabsorption are linked by two physiologic processes. The first of these is glomerulotubular balance (GTB), which confers a forward effect of SNGFR on the fluid delivered to the distal nephron. The second process is TGF. TGF operates in the juxtaglomerular apparatus of each nephron and causes SNGFR to vary inversely with changes in the amount of salt reaching the macula densa at the end of Henle’s loop. Together, GTB and TGF comprise a closed-loop negative-feedback control system which stabilizes nephron function.
Figure 1.
Framework for interactions between glomerulus and proximal tubule and pathways to hyperfiltration. VLP, late proximal flow. SNGFR and VLP are linked by TGF (sigmoid curves) and GTB (straight lines) which intersect at a single operating point. The operating point cannot change unless there is a change in TGF or GTB. Hyperfiltration can result from a shift in TGF (left panel) or an increase in proximal reabsorption (center panel). A primary increase in proximal reabsorption can induce TGF to reset thus obscuring increased reabsorption as the primary cause of hyperfiltration (right panel).
The nephron must operate at the point where curves representing GTB and TGF intersect, and it follows that diabetic hyperfiltration cannot occur unless diabetes affects either the TGF curve or the GTB curve. Changes in glomerular hemodynamics that are not mediated by movement along the TGF curve are represented by a shift in the TGF curve itself, and changes in reabsorption which are not explained by the direct action of GTB are represented by a shift in the GTB curve. Therefore, hyperfiltration might be explained by a shift in either the TGF curve (a primary vascular event) or the GTB curve (a primary tubular event). If hyperfiltration is initiated by a primary vascular event, then the operating point must initially move rightward as well as upward, and hyperfiltration must be accompanied by increased late proximal flow (VLP) (shown in Figure 1, left panel). On the other hand, if hyperfiltration is initiated by a primary increase in proximal reabsorption, then the operating point must initially move leftward as well as upward, and hyperfiltration should be accompanied by a reduction in VLP (shown in Figure 1, center panel). Therefore, by testing for changes in VLP, one should be able to determine whether diabetic hyperfiltration is mainly the result of defective tone in the glomerular microvasculature or the consequence of increased proximal reabsorption. However, to actually measure VLP at the operating point is not trivial, since fluid cannot be collected from the proximal tubule without interrupting TGF, thereby rendering the operating point indeterminate. Another difficulty in establishing whether a change in reabsorption has led to a change in SNGFR or vice versa is that a primary shift in GTB will elicit a secondary resetting of TGF that maintains the operating point on the steep portion of the TGF curve (10, 11). In other words, a primary across-the-board increase in proximal reabsorption is expected to elicit a secondary shift in base-line arteriolar resistance, making it difficult to discern which came first (shown in Figure 1, right panel). In the present study, we applied micropuncture methods designed to overcome these difficulties in order to test the hypothesis that diabetic hyperfiltration results from a primary increase in proximal reabsorption.
The diabetic model.
Male Wistar rats were made diabetic with streptozotocin (65 mg/kg, injected intraperitoneally; Sigma Chemical Co., St. Louis, Missouri, USA). Blood glucose concentration was measured after 24 hours and rats with levels greater than 300 mg/dl were carried on into studies. Insulin (PZI; Blue Ridge Pharmaceuticals, Memphis, Tennessee, USA) was administered daily by subcutaneous injection and titrated to maintain blood glucose concentrations of 300–400 mg/dl. To inhibit ODC, 200 mg/kg DFMO was administered intraperitoneally 12 hours in Ringer saline beginning 12 hours after the streptozotocin. Animals not receiving DFMO were injected with Ringer saline placebo.
Bioassay of ODC/ADC activity.
ODC and ADC activity were assayed in kidney cortex as previously described (9). After 7 days of diabetes, and 2–4 hours after the final dose of DFMO, animals were anesthetized with Brevital (75 mg/kg), and the kidneys were removed. A slice of renal cortex was placed in ice-cold reaction buffer (10 mM Tris [pH 7.4], 2.5 mM dithiothreitol [DTT], 0.3 mM pyridoxyl-5-phosphate, 0.1 mM EDTA, and 0.5 mM Pefabloc [Roche, Chicago, Illinois, USA]), lysed (polytron for 5 seconds), and centrifuged (30,000 g for 40 minutes). Supernatant was collected for ODC assay. The pellet was resuspended in ADC reaction buffer (10 mM TRIS, 2.5 mM DTT, 0.8 mM MgSO4, 0.5 mM Pefabloc [pH 8.5]) for ADC assay. 250 μl was added to a glass reaction tube and incubated for 10 minutes with or without DFMO to establish specificity in ODC assay and in D-fluoromethyl arginine (DFMA, a specific ADC blocker) to establish specificity in ADC assay. 100 μM 14C-ornithine or 14C-L-arginine (Dupont NEN Research Products, Boston, Massachusetts, USA) were added (0.1 μCi) for ODC or ADC assays, respectively. Tubes were vortexed and capped with trapping wells (Kontes, Vineland, New Jersey, USA) containing 250 μl CO2 trapping agent (Solvall; Dupont NEN Research Products). After incubation for 1 hour at 37°C, trichloroacetic acid was added to stop the reaction. Radioactivity in the trapping well was counted after overnight equilibration of 14CO2 gas between the solution and trapping well. ODC and ADC activities were normalized to total protein by the Lowry method (12).
Measurement of kidney weight.
To determination wet weight, kidneys were removed and decapsulated. The decapsulated kidney was placed on tissue paper for 1 minute, then transferred to a scale and weighed. In 22 of these kidneys, the mass of fat-free dry solids was also determined after drying overnight in an oven at 50°C.
Measurement of GFR.
Experiments were performed 4–6 hours after the final dose of DFMO. Rats were anesthetized with Inactin (100 mg/kg injected intraperitoneally) and body temperature maintained on a servo-controlled heating table. Tracheostomy was performed (PE240) and catheters placed in the left femoral artery, right internal jugular vein, and urinary bladder (PE50). Ringer saline containing 5–10 μCi/ml 3H-inulin was infused as a marker of GFR. Diabetic animals received 3.5 ml/h, and nondiabetics received 2 ml/h to account for the effect of hyperglycemia on urine output. One hour was allowed for equilibration, then GFR was measured by 3H-inulin clearance in two 30-minute periods. The two values for each rat were averaged. Subsequently, animals were euthanized and kidneys removed for weighing.
Assessment of proximal reabsorption.
Micropuncture experiments were performed to assess the impact of diabetes ± DFMO on overall reabsorption and GTB in the proximal tubule. Because of GTB, reabsorption will vary with SNGFR, and hyperfiltration will confound other effects of diabetes on proximal reabsorption. To correct for this, we manipulated the TGF signal to determine the relationship of proximal reabsorption to SNGFR in individual nephrons, then tested for the effects of diabetes ± DFMO on this relationship. Experiments were performed 3–7 hours after the last dose of DFMO. Animals were anesthetized and catheters placed as described above. The left kidney was exposed and prepared for micropuncture according to standard protocols employed in this laboratory (13). 3H-inulin (80–100 μCi/ml in Ringer saline) was infused as a marker of SNGFR. Diabetic animals received Ringer saline at 3.5 cm3/h. Nondiabetic animals received Ringer saline at 2 cm3/h. After 1 hour for equilibration, late proximal nephrons were localized on the kidney surface, and an obstructing wax block was inserted immediately upstream from the most downstream accessible segment. A microperfusion pipette containing artificial tubular fluid (ATF) was inserted downstream from the wax block to perfuse Henle’s loop. Controlled perfusion of Henle’s loop was performed in order to activate TGF and thereby cause SNGFR to change. During perfusion, timed collections of tubular fluid were taken upstream from the wax block in order to measure SNGFR and VLP. Collections were taken from each nephron during minimal TGF activation (Henle’s loop microperfusion at 0 nl/min) and maximal TGF activation (Henle’s loop microperfusion at 40 nl/min). Perfusions were in random order. Nephrons were vented upstream from the wax block before each collection to prevent pressure from building up in the proximal tubule. Tubular fluid samples were assayed for volume by transfer to a constant-bore glass capillary, then counted for radioactivity to determine SNGFR. Data from these paired collections were employed to characterize the dependence of proximal reabsorption on SNGFR.
Statistical analysis.
Data were analyzed by ANOVA or by Student’s t test with Bonferroni correction as appropriate. Where new variables were created by mathematically combining measured variables, standard errors were determined based on the principle that
Equation 1
 |
1 |
|---|
Where x_i_ are random variables, ς_2_ refers to the mean square error, and rxi_,_ xj the correlation between xi and xj.
Results
GFR, kidney weight, and ODC activity.
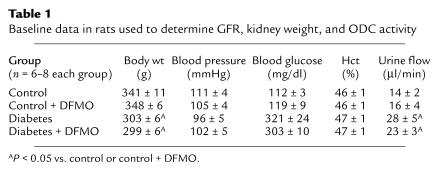
Body weight, blood pressure, blood glucose concentration, hematocrit, and urine flow rate are depicted in Table 1, n = 6–8 animals per group. Rats with diabetes had elevated blood sugar, greater urine output, and weighed slightly less than controls. Body weight, blood pressure, blood glucose concentration, hematocrit, and urine flow were not affected by DFMO.
Table 1.
Baseline data in rats used to determine GFR, kidney weight, and ODC activity
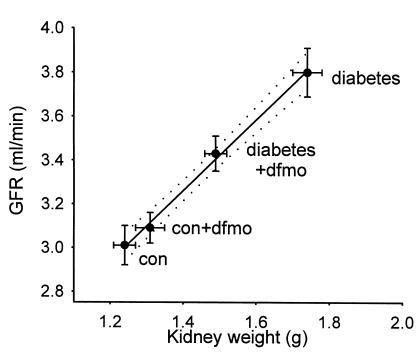
Although body weight was somewhat less in the diabetic rats, diabetic kidneys weighed 50% more than control kidneys (P < 0.00005), and GFR in diabetes was 25% greater than in controls (P < 0.0002). Diabetic rats receiving DFMO had less kidney mass (P = 0.0004) and lower GFR (P = 0.0012). In contrast, control rats receiving DFMO tended to manifest greater kidney weight and GFR than untreated controls, but these effects did not achieve statistical significance. Kidney weight was a strong predictor of GFR (r = 0.998 for the group means, Figure 2). For the subset of kidneys in which both wet and dry weights were measured, the two were tightly correlated (r = 0.962). Therefore, changes in wet weight corresponded to changes in the mass of fat-free dry solids.
Figure 2.
GFR vs. kidney weight in diabetic and control rats ± treatment with DFMO. GFR is for two kidneys. Kidney weight is wet-weight of left kidney. Dashed lines are 95% confidence intervals for linear regression. _r_2 = 0.996.
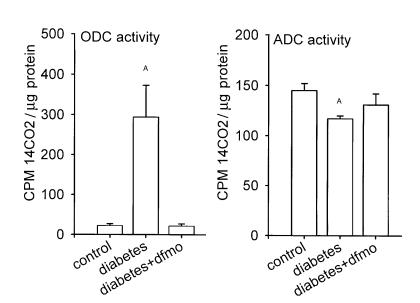
ODC activity in kidney cortex was elevated 15-fold in diabetes. In diabetic rats treated with DFMO and studied 2–4 hours after the final dose of DFMO, ODC activity was not different from control rats (Figure 3). When compared to control kidneys, ADC activity was lower by 20% in rats with early diabetes. In diabetic rats receiving DFMO, the kidney ADC activity level was between that of control and diabetic rats not receiving DFMO (Figure 3).
Figure 3.
Activities of ODC and ADC in control and diabetic rats. A_P_ < 0.05 vs. control.
Micropuncture results.
Micropuncture data were obtained from 177 nephrons in 29 rats (control n = 11, other groups n = 6) weighing 295 ± 26 grams (mean ± SD, P = not significant between groups). SNGFR and VLP were measured in each nephron during orthograde perfusion of Henle’s loop at both 0 and 40 nl/min. In this way, TGF was used a tool for manipulating SNGFR so that proximal reabsorption could be characterized at more than one delivered load. The results are depicted in Table 2 and Figure 4. The value of SNGFR obtained during zero TGF stimulus is referred to as SNGFR0. The value for SNGFR obtained during maximum TGF stimulus is referred to as SNGFR40. SNGFR0 was greater in diabetics than controls (P = 0.016), consistent with typical diabetic hyperfiltration. In diabetic rats receiving DFMO, SNGFR0 was significantly less than in nontreated diabetics (P = 0.001) and not different from control rats (P = 0.65). In contrast, DFMO had no significant effect on SNGFR0 in control rats (P = 0.5). By two-way ANOVA the effect of DFMO on SNGFR0 differed between diabetic and control rats (P < 0.0003). SNGFR40 was less than SNGFR0 in all nephrons indicating successful activation of TGF.
Table 2.
Micropuncture data (mean ± SEM)
Figure 4.
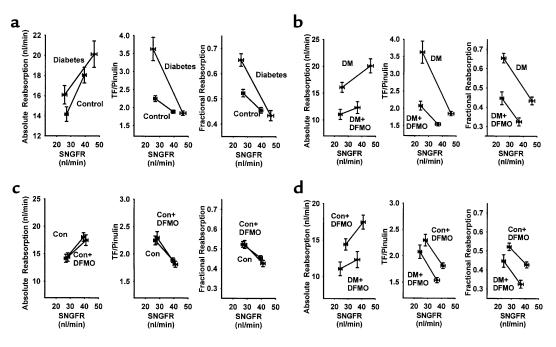
Pairwise intergroup comparisons of different indices of proximal reabsorption, each shown as a function of SNGFR. Line segments connect data obtained at minimum (higher SNGFR) and maximum (lower SNGFR) TGF activation. Group mean ± SEM is also shown in Table 2. Statistical significance of intergroup differences are described in the text for the regions of overlapping SNGFR. (a) Effects of diabetes. (b) Effects of DFMO in diabetes. (c) Effects of DFMO in controls. (d) Diabetes + DFMO vs. control + DFMO. DM, diabetes mellitus; Con, control.
The main point of these microperfusion experiments was to evaluate proximal reabsorption as a function of SNGFR. This was done in order to overcome the confounding effect of differences in SNGFR as the apparent cause of differences in proximal reabsorption. In Figure 4 these results are expressed as absolute proximal reabsorption (APR), fractional proximal reabsorption, or late proximal TF/Pinulin. (TF/Pinulin = 1/fractional delivery, and is a standard index for tracking water flux along the nephron). When comparing diabetic to control rats (Figure 4a), each of these indices suggests that proximal reabsorption is increased in diabetes. From these data it is also clear that fractional reabsorption was not constant, but declined with increasing SNGFR. The rate at which fractional reabsorption declined with increasing SNGFR was greater in diabetes, such that regression lines drawn for the data in each group converged near the SNGFR0 values for diabetes. In other words, the impact of diabetes on proximal reabsorption was obscured when SNGFR was maximized by eliminating flow past the macula densa.
Intergroup comparisons for APR, late proximal TF/Pinulin, and proximal fractional reabsorption (FPR) were made as follows: First, the range of overlapping SNGFR was determined for the two groups being compared. Second, values for the index being examined and its SE were calculated as functions of SNGFR by linear interpolation between the values at SNGFR0 and SNGFR40. Third, intergroup comparisons were made by Student’s t test at each end of the overlapping range with Bonferroni correction for multiple group comparisons. The results are apparent in Figure 4. Comparing diabetics with controls, APR was greater in diabetics at the lower end of the SNGFR overlap (P = 0.02), while TF/Pinulin and FPR were greater in diabetes at both ends of the overlap region (P < 0.02 for each relevant comparison, Figure 4a). Among diabetics, treatment with DFMO reduced APR, TF/Pinulin, and FPR throughout the entire region of SNGFR overlap (P < 0.0003 for each relevant comparison, Figure 4b). In control rats, DFMO had no effect on APR, TF/Pinulin, or FPR anywhere within the region of overlapping SNGFR (Figure 4c). Comparing control + DFMO with diabetes + DFMO, APR, TF/Pinulin, and FPR were each less in the diabetes + DFMO group throughout the region of overlapping SNGFR (P < 0.01 for each relevant comparison, Figure 4d).
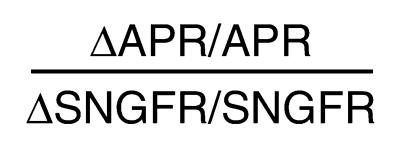
These data also permit assessment of proximal tubular function in terms of the efficiency of GTB. An index of autoregulatory efficiency for GTB was calculated analogous to the index used to describe autoregulatory efficiency of blood flow in an organ. For GTB, this index is given by:
Equation 2
 |
2 |
|---|
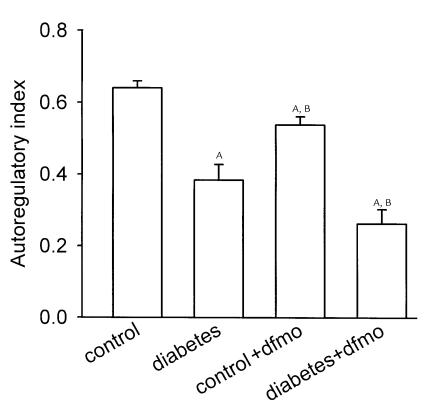
This dimensionless index will equal unity when fractional reabsorption is constant over the range tested and will equal zero when absolute reabsorption is independent of SNGFR. This index also reduces the noise inherent in the simpler index, ΔAPR/ΔSNGFR, arising from variability in the location along the nephron where the micropuncture samples are obtained. Group mean indices for GTB efficiency were calculated from the data and variances determined as described under Methods. The results are depicted in Figure 5 and illustrate that, while overall proximal reabsorption is increased in diabetes, GTB efficiency is reduced in diabetes and not restored by DFMO.
Figure 5.
Autoregulation of tubular reabsorption by GTB. Refer to text for formula of index. Index is unity when fractional reabsorption is constant across SNGFR. Index is zero when net reabsorption is constant across SNGFR. A_P_ < 0.05 vs. control. B_P_ < 0.05 vs. diabetes.
Discussion
These studies were performed to test the hypothesis that glomerular hyperfiltration in diabetes begins with growth of the kidney, which increases proximal reabsorption and reduces the signal for TGF. This departs from the usual notion that diabetic hyperfiltration results from intrinsic loss of tone in some element of the glomerular microvasculature. Normal GTB dictates that proximal reabsorption will change monotonically with SNGFR. Hence, there is no surprise in finding increased net tubular reabsorption in the hyperfiltering diabetic kidney. However, in the present case, proximal reabsorption remained elevated even after correcting for hyperfiltration, implying an increase in reabsorption beyond the amount attributable to GTB. Therefore, the difference in proximal reabsorption between control and diabetic rats was too great to have resulted from the difference in SNGFR. On the other hand, TGF-mediated vasodilation of the glomerular arterioles is the expected consequence of a primary increase in proximal reabsorption and likely accounts for hyperfiltration in this model of early diabetes. This impression is reinforced by the finding that diabetic hyperfiltration is only manifest to the degree that the kidney has grown larger. Based on prior work of others we anticipated that growth of the diabetic kidney would be linked to increased ODC activity (8). The present findings confirm this observation and extend it by demonstrating that chronic ODC blockade also mitigates the characteristic increases in proximal reabsorption and GFR in rats with diabetes, while bearing no significant effect on glomerular filtration or proximal reabsorption in nondiabetic rats. Since it is the tubule which mainly accounts for enlargement of the kidney in diabetes, it is likely that DFMO mitigates diabetic hyperfiltration by preventing the tubule from growing.
As illustrated in Figure 1, when a primary increment in tubular reabsorption leads to a TGF-mediated increase in SNGFR, there should be a telltale reduction in the remaining TGF stimulus. In other words, salt concentration at the macula densa, or ambient VLP, should be reduced in diabetes. Because the collection of late proximal fluid for the purpose of measuring VLP interrupts TGF and renders the operating point indeterminate, it is not possible to assess natural VLP by simple micropuncture of the late proximal tubule. Nonetheless, late proximal collections have been made by various investigators in the course of studying glomerular hemodynamics in diabetes which are analogous to those presently obtained during zero perfusion of Henle’s loop. Under these conditions, fractional reabsorption does not appear to be affected by diabetes. From this, one might simply conclude that diabetic and nondiabetic nephrons operate at different points along identical GTB curves and that net reabsorption is greater in the hyperfiltering diabetic due to the normal action of GTB. Misstatements in some textbooks which equate GTB with constant fractional reabsorption reinforce this impression. In fact, the present data confirm that fractional reabsorption increases with TGF activation, especially in diabetes. Manipulating TGF to adjust SNGFR reveals a major primary increase in proximal reabsorption attributable to diabetes. This is concealed when flow past the macula densa is reduced to zero and fractional reabsorption converges to the same value in diabetic and nondiabetic nephrons. Since nephrons do not naturally operate with zero distal flow, convergence at this particular point has no intrinsic physiological significance.
The limitations of micropuncture notwithstanding, there are published data consistent with the present finding that diabetes causes a shift toward greater proximal reabsorption. In a prior study, we employed a noninvasive optical technique to measure late proximal flow in rats after 5 weeks of diabetes. Under those conditions, which allowed for normal operation of TGF during the measurements, VLP was not increased in diabetes, even though there was marked hyperfiltration (14). In micropuncture experiments, the “late proximal tubule” is the most-downstream segment of the proximal tubule visible on the kidney surface. Assuming that some effect of diabetes on proximal reabsorption continues downstream from this site, if flow in a hyperfiltering diabetic nephron declines to normal by the time it reaches the last surface segment of the proximal tubule, then the amount of salt actually reaching the macula densa will fall below normal as is required for the tubular hypothesis of hyperfiltration. In fact, the salt content of fluid slightly downstream of the macula densa has been estimated from its condosity measured in vivo and has been measured directly in tubular fluid collected by micropuncture. By both of these methods, the early distal salt concentration was found to be reduced in diabetes (14–16). Furthermore, acutely normalizing early distal salt delivery by blocking sodium-glucose cotransport in diabetic rats also reduced SNGFR to normal (16).
In the present study, TGF was used as a tool to manipulate SNGFR. The main purpose was not to study TGF itself. However, as a condition of being able to manipulate SNGFR, it was necessary for there to be a TGF response. As it turned out, the range over which SNGFR could be manipulated by activating TGF with ATF was extended beyond normal in diabetes. This is somewhat surprising, since we previously demonstrated that diabetes reduces the sensitivity with which the TGF system compensates for small perturbations in ambient tubular flow (14). However, the sensitivity to small perturbations depends on the slope of the TGF curve at the operating point rather than on the maximum range of the TGF response that was tested in the present study. With caveats regarding the perfusate composition, and noting that the prior study was conducted in 5-week diabetics, the combined studies suggest a TGF curve in diabetes which is flatter at its steepest point, but which operates over a wider range.
The present data reveal that, within the physiologic range over which SNGFR can be made to vary by TGF, diabetes causes a primary increase in proximal reabsorption. However, they also reveal that the efficiency of GTB is reduced in diabetes. This is suggested by contrasting the slopes in Figure 4a and is revealed more explicitly by the efficiency calculated for GTB and shown in Figure 5. Furthermore, DFMO prevented the overall increase in proximal reabsorption (presumably by preventing the tubule from growing), but did not normalize the efficiency of GTB. This combination is what one would expect if growth of the tubule leads to a generalized increase in the many transporters that contribute to proximal reabsorption, while diabetes, independent of growth, further increases transport by a saturable high-affinity transporter, i.e., the sodium-glucose cotransporter which is pressed into service by hyperglycemia. Indeed, it was recently reported that hyperfiltration can be postponed by aggressive insulin treatment in the first days of streptozotocin diabetes even though the kidney becomes larger (17).
Overall proximal reabsorption was lower in diabetics receiving DFMO than in controls receiving DFMO. This likely resulted from osmotically-mediated reductions in late proximal TF/P for Na and Cl, which normally drives passive reabsorption in this segment (18).
The effects of DFMO imply that ODC-polyamine pathways participate in diabetic renal hypertrophy. Biogenic polyamines are required for cell-cycle progression and proliferative growth (19, 20). However, the diabetic kidney enlarges through hypertrophy, not hyperplasia. Since induction of ODC is a mid-G1 cell-cycle event, the role of ODC in early diabetes might be to increase activity and fidelity of protein translation (20), consistent with the increased protein/DNA ratio in early diabetic kidneys (6).
In the present study, DFMO given to diabetic animals completely normalized ex vivo ODC activity, whereas its effects on renal hypertrophy and hyperfiltration were incomplete. The growth-inhibitory effects of DFMO in cancer trials have likewise been incomplete (21, 22) due to enhanced cellular uptake of polyamines which circumvent ODC (23, 24). The current results may be due to the bioassay for ODC having been performed 4 hours into a 12-hour DFMO dosing interval. However, it is also possible that the DFMO-treated diabetic kidney compensates by taking up exogenous polyamines, or that the dependence of hypertrophy on polyamines is incomplete.
We previously reported that agmatine, which is made from L-arginine by ADC, is present in micromolar concentrations in the kidney (25) and that agmatine reduces the polyamine content of cultured cells by inducing ODC antizyme and by blocking polyamine transporters (9). However, the degree to which endogenous agmatine normally governs the polyamine content or size of the proximal tubule is not known. This issue is difficult to address in vivo where DFMA, the drug normally used to block ADC, is converted to DFMO (J. Satriano, unpublished observation). In the present study, ADC activity was reduced in diabetes although the magnitude of this effect was small relative to the increase in ODC activity and ADC would have to impact ODC with high gain in order for reduced endogenous ADC activity to have played a major role in growth of these diabetic kidneys.
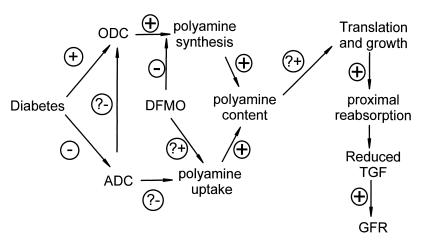
A working model is presented in Figure 6 to summarize the main findings: Glomerular hyperfiltration in early diabetes correlates with increased kidney size. Growth of the diabetic kidney requires increased activity of ODC and correlates with reduced activity of ADC, although the physiological importance of the latter is unproven. Also linked to growth of the diabetic kidney is a primary increase in proximal reabsorption which is sufficient to reduce the signal for TGF, thereby causing SNGFR to increase. These findings favor growth of the proximal tubule as a cause, rather than a consequence, of diabetic hyperfiltration.
Figure 6.
A working model to account for the effects of DFMO in the present study. The effects denoted with question marks have been demonstrated in cell culture (see text for references), but remain to be confirmed in diabetic animals.
Acknowledgments
This work was performed with funds from the US Department of Health and Human Services, National Institute of Diabetes and Digestive and Kidney Diseases (DK56248) and from the Department of Veterans Affairs Research Service. V. Vallon was supported by grants provided by the Deutsche Forschungsgemeinschaft (Va 118/3-2) and the Interdisciplinary Clinical Research Center (IKFZ) Tübingen (BMBF 01KS9602).
References
- 1.O’Bryan GT, Hostetter TH. The renal hemodynamic basis of diabetic nephropathy. Semin Nephrol. 1997;17:93–100. [PubMed] [Google Scholar]
- 2.Parving, H.H., Osterby, R., and Ritz, E. 2000. Diabetic nephropathy. In The kidney. 6th edition. B. Brenner, editor. WB Saunders Co. Philadelphia, Pennsylvania, USA. 1731–1773.
- 3.Daniels FH, Arendshorst WJ. Tubuloglomerular feedback kinetics in spontaneously hypertensive and Wistar-Kyoto rats. Am J Physiol. 1990;259:F529–F534. doi: 10.1152/ajprenal.1990.259.3.F529. [DOI] [PubMed] [Google Scholar]
- 4.Mogensen CE, Andersen MJF. Increased kidney size and glomerular filtration rate in early juvenile diabetes. Diabetes. 1973;22:706–712. doi: 10.2337/diab.22.9.706. [DOI] [PubMed] [Google Scholar]
- 5.Ross J, Goldman JK. Effect of streptozotocin-induced diabetes on kidney weight and compensatory hypertrophy in the rat. Endocrinology. 1971;88:1079–1083. doi: 10.1210/endo-88-4-1079. [DOI] [PubMed] [Google Scholar]
- 6.Seyer-Hansen K. Renal hypertrophy in streptozotocin-diabetic rats. Clin Sci Mol Med. 1976;51:551–555. doi: 10.1042/cs0510551. [DOI] [PubMed] [Google Scholar]
- 7.Tucker BJ, Collins RC, Ziegler MG, Blantz RC. Disassociation between glomerular hyperfiltration and extracellular volume in diabetic rats. Kidney Int. 1991;39:1176–1183. doi: 10.1038/ki.1991.149. [DOI] [PubMed] [Google Scholar]
- 8.Pedersen SB, Flyvbjerg A, Richelsen B. Inhibition of renal ornithine decarboxylase activity prevents kidney hypertrophy in experimental diabetes. Am J Physiol. 1993;264:C453–C456. doi: 10.1152/ajpcell.1993.264.2.C453. [DOI] [PubMed] [Google Scholar]
- 9.Satriano J, et al. Agmatine suppresses proliferation by frame shift induction of antizyme and attenuation of cellular polyamine levels. J Biol Chem. 1998;273:15313–15316. doi: 10.1074/jbc.273.25.15313. [DOI] [PubMed] [Google Scholar]
- 10.Thomson SC, Vallon V, Blantz RC. Resetting protects efficiency of tubuloglomerular feedback. Kidney Int Suppl. 1998;67:S65–S70. doi: 10.1046/j.1523-1755.1998.06713.x. [DOI] [PubMed] [Google Scholar]
- 11.Thomson SC, et al. Temporal adjustment of the juxtaglomerular apparatus during sustained inhibition of proximal reabsorption. J Clin Invest. 1999;104:1149–1158. doi: 10.1172/JCI5156. [DOI] [PMC free article] [PubMed] [Google Scholar]
- 12.Lowry OH, Rosebrough NJ, Farr AL, Randall RJ. Protein measurement with the folin phenol reagent. J Biol Chem. 1951;193:265–275. [PubMed] [Google Scholar]
- 13.Blantz, R.C., and Tucker, B.J. 1978. Measurements of glomerular dynamics. In Methods in pharmacology. M. Martinez-Maldonado, editor. Plenum Press. New York, New York, USA. 141–163.
- 14.Vallon V, Blantz RC, Thomson S. Homeostatic efficiency of tubuloglomerular feedback is reduced in established diabetes mellitus in rats. Am J Physiol. 1995;38:F876–F883. doi: 10.1152/ajprenal.1995.269.6.F876. [DOI] [PubMed] [Google Scholar]
- 15.Pollock CA, Lawrence JR, Field MJ. Tubular sodium handling and tubuloglomerular feedback in experimental diabetes mellitus. Am J Physiol. 1991;260:F946–F952. doi: 10.1152/ajprenal.1991.260.6.F946. [DOI] [PubMed] [Google Scholar]
- 16.Vallon V, Richter K, Blantz RC, Thomson S, Osswald H. Glomerular hyperfiltration in experimental diabetes mellitus: potential role of tubular reabsorption. J Am Soc Nephrol. 1999;10:2569–2576. doi: 10.1681/ASN.V10122569. [DOI] [PubMed] [Google Scholar]
- 17.Bak M, Thomsen K, Christiansen T, Flyvbjerg A. Renal enlargement precedes renal hyperfiltration in early experimental diabetes in rats. J Am Soc Nephrol. 2000;11:1287–1292. doi: 10.1681/ASN.V1171287. [DOI] [PubMed] [Google Scholar]
- 18.Neumann KH, Rector FC., Jr Mechanism of NaCl and water reabsorption in the proximal convoluted tubule of rat kidney: role of chloride concentration gradients. J Clin Invest. 1976;58:1110–1111. doi: 10.1172/JCI108563. [DOI] [PMC free article] [PubMed] [Google Scholar]
- 19.Pegg AE, McCann PP. Polyamine metabolism and function. Am J Physiol. 1982;243:C212–C221. doi: 10.1152/ajpcell.1982.243.5.C212. [DOI] [PubMed] [Google Scholar]
- 20.Tabor CW, Tabor H. Polyamines. Annu Rev Biochem. 1984;53:749–790. doi: 10.1146/annurev.bi.53.070184.003533. [DOI] [PubMed] [Google Scholar]
- 21.Schechter, P.J., Barlow, J.L.R., and Sjoerdsma, A. 1987. Clinical aspects of inhibition of ornithine decarboxylase with emphasis on therapeutic trials of Eflornithine (DFMO) in cancer and protozoan diseases. In Inhibition of polyamine metabolism. P.P. McCann, A.E. Pegg, and A. Sjoerdsma, editors. Academic Press. Orlando, Florida, USA. 345–367.
- 22.Seiler N. Pharmacological properties of the natural polyamines and their depletion by biosynthesis inhibitors as a therapeutic approach. Prog Drug Res. 1991;37:107–159. doi: 10.1007/978-3-0348-7139-6_3. [DOI] [PubMed] [Google Scholar]
- 23.Bogle RG, et al. Endothelial polyamine uptake: selective stimulation by L-arginine deprivation or polyamine depletion. Am J Physiol. 1994;266:C776–C783. doi: 10.1152/ajpcell.1994.266.3.C776. [DOI] [PubMed] [Google Scholar]
- 24.Satriano J, et al. Regulation of intracellular polyamine biosynthesis and transport by NO and TNF-α and IFN-γ. Am J Physiol. 1999;276:C892–C899. doi: 10.1152/ajpcell.1999.276.4.C892. [DOI] [PubMed] [Google Scholar]
- 25.Lortie M, et al. Agmatine, a bioactive metabolite of arginine: production, degradation, and functional effects in the kidney of the rat. J Clin Invest. 1996;97:413–420. doi: 10.1172/JCI118430. [DOI] [PMC free article] [PubMed] [Google Scholar]
