Statistical neuroanatomy of the human inferior frontal gyrus and probabilistic atlas in a standard stereotaxic space (original) (raw)
Abstract
We manually defined the inferior frontal gyrus (IFG) on high‐resolution MRIs in native space in 30 healthy subjects (15 female, median age 31 years; 15 male, median age 30 years), resulting in 30 individual atlases. Using standard software (SPM99), these were spatially transformed to a widely used stereotaxic space (MNI/ICBM 152) to create probabilistic maps. In native space, the total IFG volume was on average 5%, and the gray matter (GM) portion 12% larger in women (not significant). Expressed as a percentage of ipsilateral frontal lobe volume (i.e., correcting for brain size), the IFG was an average of 20%, and the GM portion of the IFG 27%, larger in women (P < 0.005). Correcting for total lobar volume yielded the same result. No asymmetry was found in IFG volumes. There were significant positional differences between the right and left IFGs, with the right IFG being further lateral in both native and stereotaxic space. Variability was similar on the left and right, but more pronounced anteriorly and superiorly. We show differences in IFG volume, composition, and position between sexes and between hemispheres. Applications include probabilistic determination of location in group studies, automatic labeling of new scans, and detection of anatomical abnormalities in patients. Hum Brain Mapp, 2007. © 2006 Wiley‐Liss, Inc.
Keywords: anatomy, cross‐sectional; brain mapping; frontal lobe, anatomy and histology; image processing, computer‐assisted; neuroanatomy; atlases
INTRODUCTION
In functional neuroimaging, localization of parameter changes can be achieved in single subjects by reference to their individual anatomy, i.e., by coregistration of their functional images with their anatomical MRI scan [Kiebel et al.,1997; van den Elsen et al.,1993], in the case of functional MRI (fMRI) within the accuracy limits imposed by distortions. For voxel‐based group studies, different subjects need to be brought into register, typically with a reference template in a stereotaxic space. These templates, or processed average brains, are representative of the population but tend to be very smooth, making it difficult to ascribe an anatomical localization. Individual brains within a group may be used for visualization [Holmes et al.,1998] or registration [Lohmann et al.,1999; Roland and Zilles,1996] but will not be representative. Probabilistic atlases, in a stereotaxic space or constructed in individual MRI spaces, offer one solution to these problems [e.g., Amunts et al.,2000; Chiavaras et al.,2001; Hammers et al.,2003a; Kennedy et al.,1998; Mazziotta et al.,2001; Svarer et al.,2005; Thompson et al.,2001; Tomaiuolo et al.,1999].
Interest in the human inferior frontal gyrus (IFG) arises from its main functions. These include expressive language, verbal working memory, and semantic generation, particularly posteriorly on the left (Broca's area) [Amunts et al.,1999,2004b; Cannestra et al.,2000], whereas the anterior parts are involved in information processing, e.g., selecting and comparing information [Cabeza et al.,2000; Petrides et al.,1995].
The human IFG [Federative Committee of Anatomical Terminology,1998] is surrounded by the inferior frontal sulcus and consists of three macroscopic anatomical structures (Fig. 1). Starting posteriorly, these are the pars opercularis, triangularis, and orbitalis [Duvernoy,1999], roughly corresponding to Brodmann's areas 44, 45, and 47, respectively [Brodmann,1909]. The pars opercularis is delimited anteriorly by the vertical (ascending) ramus of the Sylvian fissure and posteriorly by the inferior part of precentral sulcus; the pars triangularis is delimited posteriorly and anteroinferiorly by the vertical and horizontal rami of the Sylvian fissure; and the pars orbitalis is bordered superiorly by the horizontal ramus of the Sylvian fissure and inferiorly by the lateral orbital sulcus. Depending on the criteria used, a further sulcus, the sulcus diagonalis, has been described in the pars opercularis in about a quarter to two‐thirds of cases [Ono et al.,1990; Tomaiuolo et al.,1999]. A prominent side branch of the inferior frontal sulcus cutting into the pars triangularis may be present, and has been named the sulcus triangularis [Duvernoy,1999].
Figure 1.
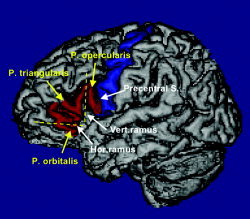
Example of a 3‐D rendering of one of the 30 maps of the IFG, introducing the nomenclature and landmarks used. Relevant sulci are indicated with white arrows and the subdivisions of the IFG in yellow. The IFG is rendered in red and the precentral gyrus in blue.
The inferior frontal sulcus and the precentral sulcus provide comparatively well‐defined macroscopic boundaries of the IFG that can be distinguished on T1‐weighted MRI. It remains uncertain whether the sulci in this area correspond to cytoarchitectonically different fields and, therefore, by inference, to functionally distinct parts of cortex. Initial cytoarchitectonic maps [Brodmann,1909; Sarkisov et al.,1949; von Economo and Koskinas,1925], easily accessible in reproduction [Amunts et al.,1999; Tomaiuolo et al.,1999], show a one‐to‐one correspondence between cytoarchitectonic fields and the subdivisions of the IFG. Using operator‐independent histological criteria and statistically defined cutoffs, there was a significant variability in the size of area 44 across individuals [Amunts et al.,1999]. The variation of the cytoarchitectonic fields in relation to the outer boundaries, namely, inferior frontal sulcus and precentral sulcus, however, seemed smaller and occurred mainly in the depth of the sulcus, perhaps justifying the use of these sulci as an approximation of cytoarchitectonic fields. Cytoarchitectonic fields are unobservable in vivo with standard clinical scans [Eickhoff et al.,2005]. Their presumed functional importance is hinted at in a case report of an individual with exceptional language abilities and significantly different cytoarchitecture [Amunts et al.,2004a].
The present study details a protocol for delineation of the IFG and investigates its reproducibility and reliability. It was used for studying the morphology and morphometry of the whole IFG in 30 healthy young subjects and assesses the descriptive statistics for volumes and spatial extent both across the group and between men and women. All descriptive statistics were examined before and after spatial normalization, yielding data for both native and stereotaxic space. Spatial normalization greatly decreases the overall variability due to different brain sizes and shapes while preserving variability of individual structures [Hammers et al.,2003a], i.e., while the shapes and sizes of the individual brains become more similar they are by no means identical. This enables the construction of a meaningful probabilistic atlas in stereotaxic space. Intersubject variability can then be quantified by displaying the various “probability shells,” and the probabilistically defined IFG used to label other brain imaging datasets in native space [Hammers et al.,2002,2003a].
The aims of this study were: to assess the morphology and descriptive volumetric statistics of the IFG; and to create a probabilistic map of the IFG in stereotaxic space.
SUBJECTS AND METHODS
Subjects
We studied 30 healthy volunteers from the database at the National Society for Epilepsy MRI Unit. Subjects had no neurological, medical, or psychiatric conditions and had normal MRI scans as determined by two experienced neuroradiologists. The cohort consisted of 15 women (median age, 31 years; range 20–54) and 15 men (median age, 30 years; range, 20–53). Standard questionnaires applied as part of routine prescanning screening revealed two women and three men to be not strongly right‐handed [Chapman and Chapman,1987]. Ethical approval was obtained from the Joint Medical Ethics Committee of the Institute of Neurology and the National Hospital for Neurology and Neurosurgery, University College London, and all subjects gave written informed consent.
MRI Acquisition and Image Preprocessing
All MRI scans were obtained on a 1.5 T GE (Milwaukee, WI) Signa Echospeed scanner at the National Society for Epilepsy. A coronal T1‐weighted 3‐D volume was acquired using an inversion recovery prepared fast spoiled gradient recall sequence (GE), TE/TR/NEX 4.2 ms (fat and water in phase)/15.5 ms/1, time of inversion (TI) 450 ms, flip angle 20°, yielding 124 slices of 1.5 mm thickness with a field of view of 18 × 24 cm for a 192 × 256 matrix, covering the whole brain with voxel sizes of 0.9375 × 0.9375 × 1.5 mm. Nonuniformity correction was performed using Sled's method (N3) [Sled et al.,1998]. The images were then reoriented with the horizontal line defined by the anterior and posterior commissures (AC‐PC orientation) and the sagittal planes parallel to the midline [Mitchell et al.,2003]. Using windowed sinc interpolation to preserve the native resolution, images were resliced to create isotropic voxels of 0.9375 × 0.9375 × 0.9375 mm3. We used a fully automatic algorithm (Exbrain) [Lemieux et al.,1999,2003] to segment MRI datasets into probabilistic images of gray matter, white matter, and cerebrospinal fluid (CSF). This information was not used during the manual delineation, but used post hoc to extract the gray matter component of the manually defined regions.
Manual Anatomical Subdivision of the Datasets
We used Sun Blade 100 UNIX workstations (Sun Microsystems, Mountain View, CA) and Analyze AVW 5.0 [Robb,2001] for the creation of volumes of interest. The borders of the IFG were defined using a manually controlled cursor in the region‐of‐interest‐module of the Analyze software. We chose the viewing window intensity settings for each MRI scan to be comparable among datasets, i.e., giving a similar visual impression, and noted them. They were subsequently applied every time a given MRI was analyzed and were typically set to about 0–180 (level 90, width 180) for these datasets with typical mean tissue intensities of gray matter ∼90 and white matter ∼105 [Lemieux et al.,2003]. Orthogonal views, updated in real time, were used to assist in the delineation, as were three‐dimensional renderings of the surface of the segmented brains with the outlined structures overlaid in color. All IFGs were outlined in native space, i.e., before spatial transformation into stereotaxic space. After the IFG had been delineated once on all 30 MRIs on both the left and the right by either one of the two main investigators (A.H. and C.H.C.), the structures were reviewed by both investigators to ensure that there had been no evolution in the interpretation of the protocol or protocol violation. Difficult cases were discussed and the final definition was reached by consensus.
All delineations were made blinded to the demographic information pertaining to the datasets.
Morphological characteristics of the IFG, namely, presence and prominence of horizontal and vertical ramus of the lateral fissure, number of gyri in each of the three subdivisions, presence of a diagonal sulcus, and overall appearance, were assessed on the 3‐D renderings.
Anatomical Criteria for Definition of the IFG
This study is part of our ongoing efforts to obtain morphological data and construct probabilistic tools [Hammers et al.,2002,2003a; Niemann et al.,2000]. We have drawn on this previous work and standard atlases and textbooks of neuroanatomy, mainly the following: Duvernoy [1999]; Jackson and Duncan [1996]; Kahle [1986]; Mai et al. [1997]; and Nieuwenhuys et al. [1988].
We used one or two sagittal marker slices, positioned approximately halfway between the lateral end of the insula and the lateral border of the brain, to determine the course of the inferior frontal sulcus first (Appendix Fig. 1A; the marker slice is shown on a sagittal slice as drawn and as it subsequently appears on a coronal slice). If a marker slice is positioned too far laterally, frequently occurring anterior branches [Ono et al.,1990] may be followed, and tissue anterior to the pars triangularis and pars orbitalis (i.e., outside the IFG) may then be included. The following features aid in defining the inferior frontal sulcus: 1) often rectangular connection with the precentral sulcus; 2) at the anterior end of the insula, the vertical and horizontal ramus of the lateral fissure can usually be identified [Duvernoy,1999], and the inferior frontal sulcus is then usually situated one gyral width more peripherally (see Appendix Fig. 1C for a 3‐D view).
In each subject the IFG was traced on ∼50 coronal slices. The anterior border was formed by the lateral orbital sulcus, as well as the inferior frontal sulcus as defined above (see Fig. 1 and Appendix Fig. 1B). Note that other investigators have used more anterior extensions of the inferior frontal sulcus. The superior border was the inferior frontal sulcus, and posteriorly measurements stopped at the precentral sulcus. This was identified using the central sulcus as described previously [Hammers et al.,2003a]. We aimed to include both gray and white matter; therefore, a boundary for the white matter had to be defined in a reliable way. Starting anteriorly, we drew a line from the deepest point of the inferior frontal sulcus to the deepest point of the frontomarginal sulcus/lateral orbital sulcus (Appendix Fig. 1B). When the horizontal ramus of the lateral fissure extended more medial than this artificial line, its medial end was included (as it belongs to the inferior frontal gyrus) (Appendix Fig. 1C). Further posteriorly, when the insula was visible we drew a line from the deepest point of the inferior frontal sulcus to the deepest point of the superior part of the circular sulcus of the insula and from the deepest point of the lateral orbital sulcus to the deepest point of the inferior part of the circular sulcus of the insula, except on the very last posterior slices, where the inferior border could consist entirely of previously defined precentral gyrus. The lateral orbital sulcus was derived as the boundary between the orbitofrontal gyri and the inferior frontal gyrus. It lies anteriorly and inferiorly to the widening horizontal ramus of the lateral fissure and, therefore, tissue superior to and inferior to the fissure leading to the insula will be included (Appendix Fig. 1D). The lateral boundary consisted of CSF and, posteriorly, of precentral gyrus. The superior border is the inferior frontal sulcus as defined on the sagittal marker slice(s). The inferior border consisted anteriorly of the lateral orbital sulcus that separates IFG and orbitofrontal cortex (Appendix Fig. 1C) and lies inferiorly of the horizontal ramus of the lateral fissure, and posteriorly the inferior boundary was defined as the precentral sulcus (Appendix Fig. 1C).
Test–Retest (“Intrarater”) Reliability
Five of the 30 datasets were chosen at random for remeasuring of both right and left IFGs (n = 10) approximately 2 years following the initial measurement. IFG and orbitofrontal cortex areas were reassigned the frontal lobe label, and both right and left IFGs were then traced again by A.H. and reviewed by C.H.C.
Morphological Characteristics
Morphological characteristics of the IFG were determined on 3‐D‐rendered brains with the colored label displayed on the brain surface. Using the nomenclature displayed in Figure 1, the number and size of gyri per subdivision, presence or absence of a diagonal sulcus, and overall shape of the IFG were noted.
Normalization of the Individual Atlases into Stereotaxic Space
The anatomical definition of the IFGs yielded 30 separate atlases in native space, where right and left IFG were identified by a unique voxel value. The T1‐weighted MRI volume datasets corresponding to each atlas were spatially normalized to a widely used T1‐weighted MRI template in stereotaxic space, the Montreal Neurological Institute/International Consortium for Brain Mapping (MNI/ICBM) 152 standard, as contained in the Statistical Parametric Mapping (SPM99) package (Wellcome Department of Imaging Neuroscience, Institute of Neurology, UCL, London, UK, available at http://www.fil.ion.ucl.ac.uk/spm). This MRI template preserves cerebral asymmetries [Evans et al.,1994]. Spatial normalization was performed using the routines contained within SPM99, implemented in Matlab v. 5 (MathWorks, Sherborn, MA) [Ashburner and Friston,1997,1999]. First, an affine linear transformation with 12 parameters (translation, rotation, scaling and shear in each dimension) was performed, followed by further (nonlinear) steps utilizing basis functions to accommodate interindividual differences on a smaller scale. The widely used default settings [Ashburner and Friston,1999; Meyer et al.,1999] of 7 × 8 × 7 basis functions (representing x, y, and z dimensions in a 3‐D coordinate system where x increases from left to right, y from posterior to anterior, and z from inferior to superior) and 12 iterations were used to make the results applicable to other studies, as in our previous study [Hammers et al.,2003a]. The warping steps were thus determined from the MRI images and then applied to the atlases that are in register. The spatially normalized images were resampled with isotropic voxel sizes of 1 × 1 × 1 mm3 in a matrix of x/y/z dimensions of 182/218/182 voxels. We used a nearest‐neighbor interpolation to preserve unequivocal allocation of a given voxel to right or left IFG or background.
Creation of the Frequency Maps in Stereotaxic Space
Frequency maps were created from the normalized atlases by adding them in stereotaxic space. Each increment in voxel intensity will correspond to an increase of the probability of encountering IFG at this location of 1/30 = 3.34%, and percentiles were color coded.
Volumes for probabilistic maps were calculated at the 5%, 50%, and 95% thresholds to obtain information on variability.
Comparison of Probability Maps for Women and Men
In order to assess the impact of the large volume difference between men and women on the accuracy of probabilistic maps in stereotaxic space, we thresholded mens' and womens' separate GM probability maps at 50% and computed areas of overlap and nonoverlap.
Statistical Analysis
Volumes
Whole structure volumes, as well as the contribution of those voxels having a 50% or greater probability of being gray matter, were extracted in native space using Analyze AVW 5.0 [Robb,2001]. To allow comparison with previously published data examining volume data in stereotaxic space, we extracted volumetric data in stereotaxic space in the same way. Data were tested for normal distribution using Kolmogorov–Smirnov tests.
The influence of sex and handedness on IFG volumes as well as any differences between the right and left sides were assessed using multiple analyses of variance (MANOVAs) with right and left IFG volumes (or gray matter contributions) as dependent variables and sex and handedness as fixed factors, investigating main effects only. The relationship between IFG volumes and age was analyzed with Pearson's correlation coefficient. Differences between men and women in native space will be influenced by their overall difference in brain size. We corrected for this by additionally expressing IFG volumes as a percentage of total ipsilateral frontal lobe volume as a form of local size correction, and additionally as a percentage of total ipsilateral lobar volumes, i.e., all frontal, parietal, occipital, and temporal areas as defined previously [Hammers et al.,2003a] added together as a form of overall size correction. Statistics were calculated using Analyze AVW 5.0 and a standard statistical package (SPSS, Chicago, IL). A P value <.05 was considered significant.
Spatial extents
Spatial extents, defined as the extreme coordinates along each of the three standard axes, were sampled in native and stereotaxic space. To enable comparisons, they were transformed to relative distances from the anterior commissure. The anterior commissure was interactively defined on an individual basis on native images; on the normalized images it was left at the MNI/ICBM default value, x = 91 voxels, y = 127 voxels, and z = 73 voxels for a 182 × 218 × 182 matrix with voxel sizes of 1 × 1 × 1 mm.
Test–retest data
Absolute volume differences between original and remeasured IFG volumes were calculated. In addition, original and remeasured IFG volumes were compared using intraclass correlation coefficients [Shrout and Fleiss,1979]. We also computed measures of spatial overlap. For comparability with other studies, two measures were used: similarity index (SI), defined as the volume of the intersection between the first and second measurements, divided by the average volume of the first and second measurement, and overlap ratio (OR), defined as the volume of the intersection of the first and second measurement over the volume of the union of the two. Both overlap measures range from zero for no overlap to unity for a complete correspondence of all voxels.
RESULTS
The final delineation algorithm was successfully applied in all subjects without alteration. All volumes were normally distributed. IFG volume data in native space (mean, SD, range, coefficient of variation (CV)) for all subjects and divided by sex are shown in Table I. For comparison with other studies, the corresponding values in stereotaxic space are shown as well. The morphological characteristics are given in Table II. An illustration of the coding used in Table II can be gained from Figure 1, which shows atlas #6.
Table I.
Volumes of the different structures in native space and after normalization to the MNI/ICBM 152 stereotaxic template
| Group and side | Original data | Spatially normalized data | ||||||
|---|---|---|---|---|---|---|---|---|
| Mean (mm3) | Range (mm3) | SD | CV | Mean (mm3) | Range (mm3) | SD | CV | |
| All (n = 30) | ||||||||
| L | 18719 | 11186–27250 | 3348 | 0.18 | 26319 | 17029–37477 | 4332 | 0.16 |
| R | 18280 | 10908–28524 | 3717 | 0.20 | 26937 | 16569–42617 | 5596 | 0.21 |
| L+R | 18499 | 10908–28524 | 3514 | 0.19 | 26628 | 16569–42617 | 4971 | 0.19 |
| L (GM only) | 12245 | 6700–19553 | 2609 | 0.21 | 16816 | 9941–24443 | 3175 | 0.19 |
| R (GM only) | 11789 | 6778–17490 | 2265 | 0.19 | 17008 | 10050–25688 | 3613 | 0.21 |
| L+R (GM only) | 12017 | 6700–19553 | 2434 | 0.20 | 16912 | 9941–25688 | 3374 | 0.20 |
| Women (n=15) | ||||||||
| L | 19335 | 15372–27250 | 3284 | 0.17 | 28396** | 23213–37477 | 3623 | 0.13 |
| R | 18588 | 12721–28524 | 4217 | 0.23 | 28981* | 19386–42617 | 6200 | 0.21 |
| L+R | 18962 | 12721–28524 | 3733 | 0.20 | 28688* | 19386–42617 | 4998 | 0.17 |
| L (GM only) | 13049 | 9150–19553 | 2930 | 0.22 | 18512** | 14510–24443 | 2871 | 0.16 |
| R (GM only) | 12309 | 7808–17490 | 2526 | 0.21 | 18662* | 12780–25688 | 3885 | 0.21 |
| L+R (GM only) | 12679 | 7808–19553 | 2714 | 0.21 | 18587* | 12780–25688 | 3357 | 0.18 |
| Men (n=15) | ||||||||
| L | 18103 | 11186–24910 | 3408 | 0.19 | 24242** | 17029–30180 | 4062 | 0.17 |
| R | 17971 | 10908–23492 | 3261 | 0.18 | 24894* | 16569–31132 | 4180 | 0.17 |
| L+R | 18037 | 10908–24910 | 3278 | 0.18 | 24568* | 16569–31132 | 4064 | 0.17 |
| L (GM only) | 11441 | 6700–14913 | 2034 | 0.18 | 15120** | 9941–19633 | 2545 | 0.17 |
| R (GM only) | 11269 | 6778–14621 | 1916 | 0.17 | 15353* | 10050–19508 | 2467 | 0.16 |
| L+R (GM only) | 11355 | 6700–14913 | 1943 | 0.17 | 15236* | 9941–19633 | 2466 | 0.16 |
Table II.
Morphological characteristics of the IFG
| IFG | Left | Right | ||||||||||
|---|---|---|---|---|---|---|---|---|---|---|---|---|
| Atlas number | Horizontal ramus | Vertical ramus | Pars opercularis | Pars triangularis | Pars orbitalis | Diag. sulcus | Horizontal ramus | Vertical ramus | Pars opercularis | Pars triangularis | Pars orbitalis | Diag. Sulcus |
| 01 | 1 | 3 | 1 | H 2 | S 2 | — | 3 | 3 | 1 | N 2 | N 1–2 | — |
| 02 | 1 | 2 | 1 | N 2 | N 2 | post R | 1 | 3 | 2 | S 2 | S 2 | — |
| 03 | 3 | 1 | 2 | N 3 | L 1 | — | 1 | 2 | 2 | N 3 | N 1 | vert R |
| 04 | 2 | 1 | 1 | N 4 | L 1 | post R | 3 | 3 | 2 | H 1 | S 1 | — |
| 05 | 2 | 3 | 2 | L 3 | L 1 | post R | 1 | 3 | 1 | N 2 | S 1 | common |
| 06 | 2 | 3 | 1–2 | N 3 | S 1 | — | 1 | 3 | 1–2 | N 3 | S 2 | — |
| 07 | 3 | 2 | 2 | L 2 | N 1 | — | 1 | 3 | 1 | H 4 | L 1 | — |
| 08 | 1 | 2 | 1 | H 3 | S 1 | — | 2 | 2 | 1 | N 4 | S 1 | — |
| 09 | 1 | 3 | 2 | H 4 | S 1 | — | 2 | 2 | 3 | L 1 | S 2 | post R |
| 10 | 1 | 3 | 2 | H 4 | S 1 | — | 1 | 2 | 1 | H 4 | S 2 | post R |
| 11 | 2 | 2 | 1 | N 2 | N 1–2 | vert R | 1 | 2 | 1 | N 2–3 | L 1 | — |
| 12 | 1 | 3 | 2 | H 3 | L 2 | vert R | 2 | 3 | 2 | H 2 | S 2 | post R |
| 13 | 3 | 2 | 1–2 | N 3 | L 1 | — | 1 | 1 | 2 | H 3 | L 1 | — |
| 14 | 1 | 2 | 1 | L 3 | L 1 | vert R | 1 | 2 | 1 | L 2 | L 1 | vert R |
| 15 | 2 | 2 | 1 | N 3–4 | L 2 | — | 1 | 3 | 2 | H 4 | L 2 | common |
| 16 | 3 | 2 | 2 | H 2 | N 1 | — | 1 | 1 | 1 | N 2 | L 1 | — |
| 17 | 2 | 2 | 1 | H 3 | N 1 | — | 2 | 1 | 1 | N 2 | N 2 | — |
| 18 | 2 | 1 | 1 | L 3 | L 1 | — | 2 | 1 | 1 | N 2–3 | N 2 | — |
| 19 | 2 | 2 | 2 | L 2 | L 1 | — | 1 | 3 | 2 | N 2 | S 2 | — |
| 20 | 3+ | 3+ | 2 | L 2 | S 2 | — | 3 | 3 | 1–2 | L 3–4 | S 1 | — |
| 21 | 2 | 1 | 1 | N 2–3 | N 1–2 | post R | 2 | 2 | 1–2 | N 2 plump | L 1 | — |
| 22 | 2 | 2 | 1 | L 3–4 | L 1 | — | 2 | 1 | 1 | N 3 | L 1 vert | — |
| 23 | 2 | 1 | 1 | H 3–4 | N 1–2 | — | 2 | 1 | 1 | H 2 | N 2 vert | — |
| 24 | 1 | 1 | 1 | N 3 | L 1 | post R | 2 | 1 | 1 | N 3 | L 1 | — |
| 25 | 2 | 1 | 1 | N 3 | S 1 | — | 2 | 1 | 2 | N 3 | L 2 | — |
| 26 | 2 | 1 | 2–3 | N 3 | N 1 | post R | 1 | 2 | 2–3 | N 1anterior | L 1–2 | post R |
| 27 | 1 | 2 | 1–2 | L 2 | L 1 | — | 1 | 1 | 1 | N 3 plump | N 1–2 | post R |
| 28 | 2 | 2 | 2 | N 2 | L 1–2 | post R | 2 | 2 | 2–3 | N 2 small | L 2 | — |
| 29 | 2 | 1 | 3 | H 2–3 | N 1–2 | — | 2 | 2 | 3 | H 3 | S 3 | common |
| 30 | 2 | 2 | 1 | H 3 | L 2 | — | 2 | 3 | 2–3 | N 2 | S 1 | post R |
| Summary | 1.9 | 1.9 | 1.5 | 2.8 | 1.3 | 10/30 | 1.6 | 2.1 | 1.6 | 2.5 | 1.5 | 11/30 |
Volumetric Data in Native Space
There was no significant left‐to‐right difference in IFG volume in native space for either men or women, either for the total volume or for the gray matter (GM) contribution (see Table I).
For combined right and left values, the IFG was an average of 5% larger in women (not significant; left, 7%; right, 3%), and the GM portion of the IFG 12% larger in women (not significant; left, 14%; right, 9%).
Correcting for differences in brain sizes between men and women by expressing IFG volumes as percentages of frontal lobe or hemispheric volume accentuated the differences. Expressed as a percentage of its ipsilateral frontal lobe volume, the IFG was an average of 20% larger in women (P < 0.005; left, 22%, P < 0.002; right, 19%, P < 0.02), and the GM portion of the IFG 27% larger in women (P < 0.002; left, 30%, P < 0.002; right, 25%, P < 0.003). Correcting for total lobar (ipsilateral hemispheric) volume yielded the same result (e.g., IFG on average 20% bigger in women; P < 0.006, GM portion on average 27% bigger; P < 0.003).
As expected, there was no difference between the volumes of the right, left, or combined IFG or its GM contribution between the 25 right‐handed and the five nonfully right‐handed subjects.
There was no significant correlation with age in our homogenous sample.
Test–Retest (“Intrarater”) Reliability
The average volume of the 10 IFGs used in the test–retest evaluation were 18,125 ± 3,617 mm3 for the first and 18,568 ± 3,490 mm3 for the second measurement. Errors were not correlated with IFG size. The average difference (bias) was 442 mm3 (2% of the mean volume), and the SD of the average difference was 1,891 mm3 (10.3% of the mean). The corresponding GM partition volumes were 11,840 ± 2,345 mm3 for the first and 12,243 ± 2,159 mm3 for the second measurement, with an average difference (bias) of 403 mm3 (3% of the mean) and a SD of 1,179 mm3 (9.8% of the mean).
There was one outlier in each direction (smaller or larger on remeasuring); in each case a portion of a gyrus in the superior part of the pars triangularis was included or excluded, corresponding to a subjective decision to join an interrupted inferior frontal sulcus in a slightly different location. Excluding these outliers, SD/mean test–retest differences fell to 4.3% for total volumes and 4.3% for GM volumes.
Intrarater reliability for volume measures, as assessed by ICC, was 0.86 for both total and GM volumes. Overlaps, expressed as SIs, were 0.90 for total IFGs and 0.91 for the GM portion; the corresponding ORs were 0.82 for total IFGs and 0.83 for the GM portion.
Volumetric Data in Stereotaxic Space
The analysis of volumetric data in stereotaxic space yielded very similar findings to that in native space after correction for brain sizes, confirming that spatial normalization using SPM effectively corrects for brain size with minor alterations of variability on a regional basis [Ashburner et al.,1997; Hammers et al.,2003a]. In addition, the SD scaled up with the mean in stereotaxic space (i.e., the CV remained very similar), indicating that the change in absolute sizes due to the larger‐than‐average size of the ICBM/MNI152 templates did not influence our results.
There was no significant left‐to‐right difference in IFG volume in stereotaxic space in either men or women, either for the total volume or for the GM contribution. The IFG in stereotaxic space was on average 17% larger in women than in men (P < 0.04; left, 17%, P < 0.009; right, 16%, P < 0.05) and the GM contribution an average 22% larger (P < 0.01; left, 22%, P < 0.003; right, 22%, P < 0.02). Again, there was no significant difference between the volumes of the right, left, or combined IFG or its GM contribution between the 25 strictly right‐handed and the five nonstrictly right‐handed subjects.
Extent Data
In native space, the medial border of the right IFG was situated on average 1.34 mm more lateral than the medial border of the left IFG, and the lateral border of the right IFG was situated 1.34 mm further lateral, too; this difference was significant in both cases (P < 0.002). There were no significant extent differences in either the anteroposterior or superoinferior directions.
In stereotaxic space, the right IFG started on average 2.20 mm more lateral than the left IFG and ended on average 1.97 mm further lateral; these differences were significant (P < 0.0003). Again, there were no significant extent differences in anteroposterior or superoinferior direction. See Figures 2, 3, 4 for a visual display in the ordinal axes.
Figure 2.
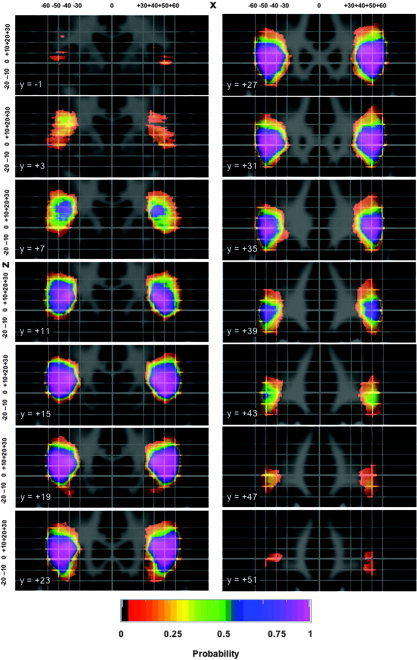
Probability shells in standard stereotaxic space for the IFG in coronal orientation, overlaid onto the ICBM/MNI average brain constructed from 152 healthy volunteers resampled into a 1 × 1 × 1 mm matrix. The grid spacing is 10 mm, with bolder lines indicating the origin as defined in the ICBM/MNI template (∼2.5 mm posterior and 6 mm superior of the middle of the anterior commissure; see also http://www.mrc-cbu.cam.ac.uk/Imaging/Common/antcomm.shtml). Left on the image is left in the brain. The _x_‐axis increases from left to right, y from posterior to anterior, and z from inferior to superior. The probability shells are sampled every 4 mm. The color code indicates probability of a given voxel pertaining to the IFG.
Figure 3.
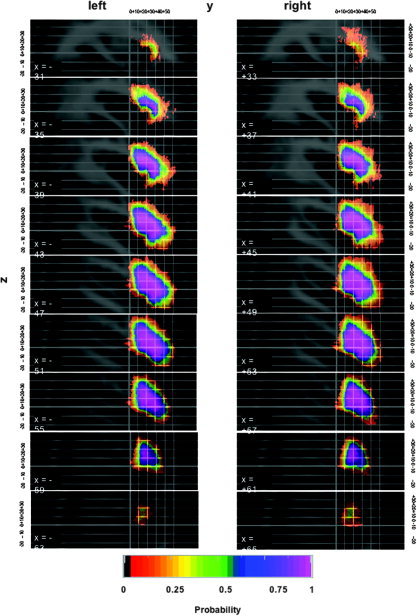
Probability shells in standard stereotaxic space for the IFG in sagittal orientation. For further explanations, see legend for Figure 3.
Figure 4.
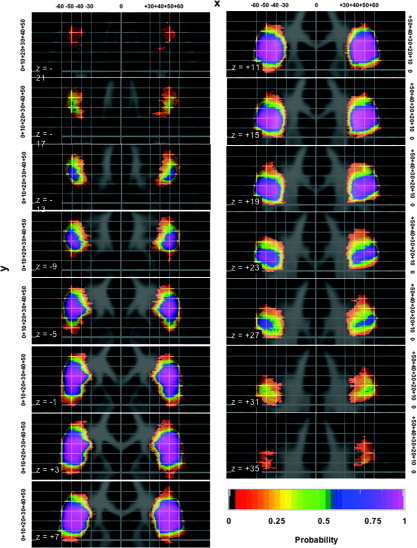
Probability shells in standard stereotaxic space for the IFG in transverse orientation. For further explanations, see legend for Figure 3.
Probabilistic Volumes
The volume occupied by over 5% of all IFGs was 52,859 mm3 on the left and 56,147 mm3 on the right. Overlap of IFGs in standard stereotaxic space was similar on the left and right; the volume occupied by over 95% of IFGs was 7,870 mm3 on the left and 8,492 mm3 on the right; this corresponds to 15% of the volume occupied by at least 5% in both cases. Taken together, these data indicate that variability is similar on the left and right sides.
The volume occupied by at least 50% of IFGs was similar to the mean values (in parentheses), 24,898 (26,319) mm3 on the left and 24,537 (26,937) mm3 on the right, as expected for normally distributed data.
When inspecting the probabilistic images visually, the anterior extent was found to be more variable than the posterior extent, and the superior extent more variable than the inferior extent (see Figs. 2, 3, 4).
DISCUSSION
We present a fully manually constructed maximum probability atlas of the human IFG, based on landmarks observable in vivo and designed for the younger adult age group, which is frequently studied in functional neuroimaging studies. The reliability of the protocol was demonstrated.
This allowed us to show subtle differences in IFG volume and composition between men and women and in the extent of the right and left sides. Applications for this knowledge about IFG volume and position in stereotaxic space include, for example, probabilistic determination of location in group activation studies [Hammers et al.,2003a; Tzourio‐Mazoyer et al.,2002], automatic labeling of new scans [e.g., Collins et al.,1999; Fischl et al.,2004; Hammers et al.,2002; Svarer et al.,2005], and detection of anatomical abnormalities in patients. Through the definition of boundaries, we also provide probabilistic maps of the inferior frontal sulcus and the inferior part of the precentral sulcus in stereotaxic space.
Algorithm and Anatomical Subdivision
The major drawback of manual labeling methods is the demand on human resources. At the resolution used in this study, labeling and checking the IFG alone in a single MRI dataset took about 1 operator day.
The current version of the probabilistic atlas combines gray and associated white matter. Tissue classification of T1‐weighted MRI images can easily be obtained with automated software [e.g., Ashburner and Friston,1997; Lemieux et al.,1999,2003], and this information can be used to create probabilistic atlases of the gray matter or white matter of the IFG. We created probabilistic maps for gray and white matter combined because first, we were interested in white matter changes and find it useful to associate those to cortical areas. Second, using gray matter partitions derived from high‐resolution MRI images leads to relatively low probabilities of encountering a structure in a given location in stereotaxic space due to lack of overlap of the thin cortical ribbons even when the differences in individual folding patterns are quite small (see, e.g., Amunts et al. [2004b]; Tomaiuolo et al. [1999]; and Figs. 5 and 6). Finally, and most importantly, for labeling individual datasets using probabilistic maps, warping a larger volume onto individual datasets and masking with the tissue segmentation derived from the individual brain should improve accuracy [Collins et al.,1999].
Figure 5.
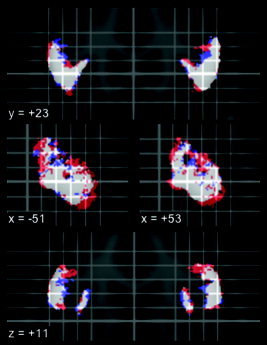
Probability shells in standard stereotaxic space for the GM contribution to the IFG, separately thresholded at 50% probability for men and women. Red: womens' 50% probability map larger; blue: mens' 50% probability map larger; white: common areas. Top: coronal; middle: sagittal; bottom: transverse. Position in mm relative to AC as defined in MNI/ICBM152 space; left on the image is left in the brain.
Figure 6.
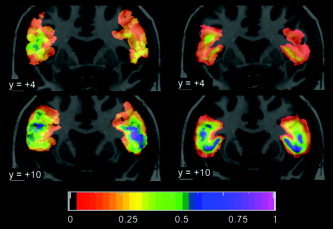
Comparison of probability maps in coronal orientation. Position in mm relative to AC as defined in MNI/ICBM152 space. Left on the image is left in the brain. Left side, cytoarchitectonic probability maps of Brodmann's area 44 based on 10 postmortem brains [Amunts et al.,1999] from the Forschungszentrum Jülich that have been spatially normalized to a single subject brain (an approximation of MNI/ICBM152 space) [Holmes et al.,1998], downloaded from http://www.bic.mni.mcgill.ca/cytoarchitectonics. For comparison, the color scale has been changed to match Figures 3, 4, 5. Right side, probability maps for GM contribution only based on all 30 brains in the current study. For comparison, the probability maps are here superimposed on the single subject brain.
Any method that is not completely automated is subject to observer bias. To limit subjectivity as far as possible, we first used rigid body reorientation prior to delineation to avoid bias through different orientations of raw data. Second, we created a detailed, written protocol to which we consistently adhered (for the importance of published protocols, see Bergin et al. [1994]). Third, the optimum viewing intensity was applied every time a given MRI was analyzed to avoid bias through changing intensity settings. Fourth, when the anatomy of a given IFG required a degree of interpretation of the protocol or was not unequivocally captured by the protocol, a consensus was reached after discussion between the two main investigators (C.H.C., A.H.). Fifth, segmented images, tridimensional display, and in particular volume rendering were used throughout to ensure optimum reproducibility. Finally, we reviewed all IFGs after completion of all 30 datasets to ensure that there had been no evolution in the interpretation of the protocol.
In addition, formal intrarater reliability studies have shown good reproducibility and very good reliability even after 2 years. We conclude that with the tools for manual segmentation currently available, if a well‐defined structure is outlined strictly following a written protocol and with two observers agreeing, error due to measurement can be kept small in comparison with the anatomical variation.
Normalization of Individual Atlases into Stereotaxic Space and Limitations of Use
Any probabilistic map in standard space depends directly on the choice of the stereotaxic reference brain template and the software and settings used for the spatial transformations; while the data presented here will allow probabilistic assessment of the localization of statistical results with respect to the IFG, obtained using the MNI/ICBM 152 stereotaxic space and the default normalization settings, the results in this particular stereotaxic space cannot be immediately generalized to other stereotaxic spaces. The MNI/ICBM 152 template was chosen for being representative of normal anatomy through the use of 152 MRI datasets in its construction and its preservation of asymmetry [Evans et al.,1994]. The MNI templates are known to be substantially larger than average brains (∼46%) [Ashburner et al.,1997; Hammers et al.,2003a] or the Talairach hemisphere (http://www.mrc-cbu.cam.ac.uk/Imaging/mnispace.html), and this is reflected in the larger sizes of the volumes in stereotaxic space (Table I).
For the spatial transformations, we chose SPM99, employing the widely used default settings and optimizing the process by manually defining the anterior commissure as the starting point for estimation. The current version of the maximum probability atlas can be used with SPM99 and SPM2 (after right–left reversal to account for the change in default setting from SPM99 to SPM2) using either the MNI/ICBM original templates or customized templates that are in register, e.g., ligand PET templates [Hammers et al.,2003b]. Its use with other software using the MNI/ICBM original templates but different normalization algorithms is possible; while researchers should be aware of potential systematic biases due to different warping strategies and should ideally assess their impact, bias is likely to be limited when the normalization process yields visually comparable results. As we took care to define regions in native space, any future combination of templates and software can be used to create further versions.
Women had larger IFGs, particularly in the GM compartment; this difference was accentuated after effectively correcting for brain size through normalization to stereotaxic space. To assess the impact of this difference, we separately thresholded womens' and mens' probability maps at 50% and computed areas of overlap and differences (Fig. 5). Womens' larger IFGs affect the probability maps at the fringes. This difference in size might be relevant for the interpretation of functional imaging studies assessing differences in activation between groups of different sex mixes (e.g., male volunteers groups compared with mixed male/female patient groups).
Our data are strictly anatomical in nature and do not allow speculation on the functional meaning of the differences found between sexes and between hemispheres. For example, we do not have measures of language function to correlate with volumetric or extent data.
Comparison with Previous Work
Voxel‐based studies
Voxel‐based methods can be used as useful screening tools for overall asymmetries or sex differences. Our result of larger IFGs in women, especially for the GM contribution, are in good agreement with Good et al.'s study [2001] in 465 healthy subjects (200 women), which found significantly larger gray matter volumes in women in both IFGs. Those authors described larger gray matter volumes across all subjects in the depth of the left inferior frontal sulcus. This result is not tabulated, so the exact location is not known, but our results suggest the intriguing possibility that this difference might be positional, i.e., caused by the more lateral position of the right IFG.
In another voxel‐based study, Watkins et al. [2001] did not find an asymmetry of the IFG in 142 subjects (61 female).
In both these studies, custom‐made symmetrical templates were used, which would make quantification of positional differences compared with this study difficult.
Volumes of the entire IFG
Crespo‐Facorro et al. [2000] found volumes of the gray matter contribution of the IFG, determined by two raters in 10 brains, of 7,810 ± 1,800 and 8,480 ± 2,070 mm3 on the right and 8,760 ± 1,820 and 8,700 ± 1,780 mm3 on the left. This is about 30% less than in our study, even though one would have expected their values to be bigger, as they followed branches of the inferior frontal sulcus more anteriorly. One explanation could be the difference in the calculation of the GM contribution; while we use a fully automated method (Exbrain) [Lemieux et al.,1999,2003] and thresholded at 50% probability, Crespo‐Facorro et al. used a different and more interactive method based on surface extraction. The proportion of women and the proportion of healthy volunteers vs. psychiatric patients in this study is not reported, and this could be another confounding factor.
Collins et al. [1999] used automatic methods to anatomically divide 152 brains into 91 regions each. Detailed volumetric data were not reported. Their approach allows the use of large numbers of subjects, with reasonable accuracy, but we concur with them that manual segmentation is the gold standard, and our approach should be considered complementary—or could even be used as an improved starting point for automated methods.
The UCLA group have recently extended their mapping work to volumetric frontal lobe subdivisions in 46 children (25 girls; mean age 11 years, range 6–17 years) [Blanton et al.,2004]. As in our study, there was no asymmetry of the IFG; however, after correction for intracranial volume, boys had a larger GM volume in the left IFG. Over the time course studied, changes in compartmental volumes exceeded a factor of two, and the different ages of subjects in their study compared to this study most likely accounts for this difference.
Subdivisions of the IFG
Kennedy et al. [1998] manually subdivided the inferior frontal gyrus into pars opercularis and pars triangularis on 20 MRI datasets (10 women). The pars opercularis in women was 12% bigger and the pars triangularis 11% smaller, but the volumes were not adjusted for brain size or transformed to a stereotaxic space. The overall higher variance, different protocols, use of subdivisions, and manual extraction methods for the GM mantle may all explain why this study did not show the subtle difference in GM volumes in native space seen in our study.
Tomaiuolo et al. [1999] investigated the GM contribution to the pars opercularis separately in 50 subjects (17 women) and created a probabilistic map in the space defined by a single subject aligned to the MNI/ICBM 305 space [Holmes et al.,1998], using MNI software [Collins et al.,1994]. The gray matter contribution to the pars opercularis in native space was not different in women and men. In standardized space, the gray matter contribution to the pars opercularis was 12% bigger in women on the left side and 7% bigger in women on the right side. None of these differences were significant, but it is noteworthy that they too increased after correction for brain size through normalization. Not surprisingly, the CVs for this IFG subregion were higher than the ones found in our study for the entire IFG. The probability map did not contain voxels with a higher probability than 74% of containing the GM contribution to the pars opercularis, most likely due to the use of the GM contribution only. There was, however, a very good correspondence of their probability map (in coronal orientation) with the posterior boundary (representing the pars opercularis of the IFG) of our coronal maximum probability map for both shape and extent, including subtle side‐to‐side differences (see their fig. 10, p. 3045, compared with our Fig. 2).
Amunts et al. [2004b] examined areas 44 and 45 in 10 postmortem brains (five female), using an objective definition of cytoarchitectonic boundaries. Sex difference data were not shown but were described as not significant. Area 44 was consistently larger on the left (3,840 ± 2,278 mm3) than on the right (2,528 ± 1,598 mm3); no such difference was present in area 45 (left, 3,242 ± 1,149 mm3; right, 3,174 ± 1,638 mm3). While the authors commented on the great variability of the cytoarchitectonic boundaries with respect to sulcal landmarks, there was limited variability on the free surfaces of the gyri [see Fig. 2 in Amunts et al.,2004b]. Comparing the posterior boundary of our probability maps derived from gross cortical landmarks with the posterior boundary of Brodmann area 44 provided by the Jülich Institute for Medicine (via http://www.bic.mni.mcgill.ca/cytoarchitectonics), there is a striking correspondence of the positional information (Fig. 6). Note the more posterior position of the IFG on the left in both maps at position y = +4 (upper row) and the slightly different shape and probability distribution more anteriorly at position y = +10 (lower row). There is a low probability (1–2 brains) “spillout” beyond the inferior frontal sulcus superiorly in the cytoarchitectonic maps, while the MRI‐based maps end by definition at the inferior frontal sulcus. Similarly to our maps, there is a right–left difference in lateral extent in the cytoarchitectonic probability maps, but this should not be overinterpreted as both maps were created in a version of MNI/ICBM space and this similarity could in part be explained by using a similar stereotaxic space. Overall, this comparison is encouraging for the use of probability maps derived from gross cortical landmarks, as presented here, as an approximation of cytoarchitectonic boundaries.
Probabilistic maps based on cytoarchitectonic information, reliably transformed to standard stereotaxic spaces, will be a more elegant solution to the problem of localization in group studies, but the effort in terms of infrastructure and human resources has so far restricted these efforts to a few selected regions in 10 brains, underpowered to detect differences. While our approach is also labor‐intensive, it has allowed segmentation of enough brains for well‐powered statistical analysis.
Morphology
Our morphological descriptions (Table II) may be helpful for future studies of the IFG, describing a range of expected shapes. We found a diagonal sulcus in 10/30 hemispheres on the left and 11/30 hemispheres on the right. This is a lower incidence than in the original studies but is in accordance with more recent publications [Amunts et al.,1999]. In comparison with postmortem studies, we may have underestimated the frequency of occurrence of the diagonal sulcus when it only represents a small indentation, due to the limited spatial resolution of the 3‐D renderings (Fig. 1).
CONCLUSION
A probabilistic approach provides novel information about anatomical variability. In addition, it facilitates the interpretation of functional imaging data and data from novel MRI contrasts. Future work will include the extension to other brain regions and the integration of the results obtained in our PET and MRI research.
Acknowledgements
We thank our colleagues in the Cyclotron Building for help and discussions, our colleagues at the National Society for Epilepsy for acquisition and preparation of the MRI datasets, Drs. Brian Kendall and John Stevens for neuroradiological evaluation of the MRIs, and all our volunteers for their participation.
Algorithm for IFG Definition
The formal algorithm, used in conjunction with the images in the Appendix Figure, was: Structures 56 and 57: Inferior frontal gyrus (left, right).
- Cave: Use one or two sagittal marker slices, positioned roughly halfway between the lateral end of the insula and the lateral border of the brain, to determine the course of the inferior frontal sulcus first (Appendix Fig. 1A). If a marker slice is positioned too far laterally, frequently occurring anterior branches [Ono et al.,1990] may be followed, and tissue anterior to the pars triangularis and pars orbitalis may then be included. The following features aid in defining the inferior frontal sulcus: (1) often rectangular connection with the precentral sulcus; (2) at the anterior end of the insula, the vertical and horizontal ramus of the lateral fissure can usually be identified [Duvernoy,1999], and the inferior frontal sulcus is then situated one gyral width more peripherally.
- Orientation of slices: coronal; Viewing size: Mainly triple (double); may need quadruple/x6 posteriorly.
- Anterior border: Inferior frontal sulcus (not branches, see caveat above).
- Posterior border: Precentral gyrus as previously defined.
- Medial border: anterior to posterior: Draw a line from the deepest point of the inferior frontal sulcus to the deepest point of the frontomarginal sulcus/lateral orbital sulcus (Appendix Fig. 1B). If the horizontal ramus of the lateral fissure extends more medial than this artificial line, its medial end is included (as it belongs to the inferior frontal gyrus) (Appendix Fig. 1C). Further posteriorly, when the insula is visible, draw a line from the deepest point of the inferior frontal sulcus to the deepest point of the superior part of the circular sulcus of the insula and from the deepest point of the lateral orbital sulcus to the deepest point of the inferior part of the circular sulcus of the insula (except the very last posterior slices where the inferior border may consist entirely of precentral gyrus). Note that the lateral orbital sulcus may lie inferiorly to the widening horizontal ramus of the lateral fissure and that therefore tissue superior to and inferior to the fissure leading to the insula will be included (Appendix Fig. 1D).
- Lateral border: anterior to posterior: CSF → precentral gyrus as previously defined (Structures 50 and 51).
- Superior border: inferior frontal sulcus as defined on the sagittal marker slice.
- Inferior border: Orbitofrontal cortex as previously defined (Structures 54 and 55); posteriorly, precentral gyrus as previously defined (Structures 50 and 51). In the most posterior slices, it occasionally becomes obvious that the inferiormost pockets of region 28/29 (original frontal lobe) must be redefined as precentral gyrus (50 or 51) rather than inferior frontal gyrus.
- Number of slices: Approximately 50.
Figure 1.
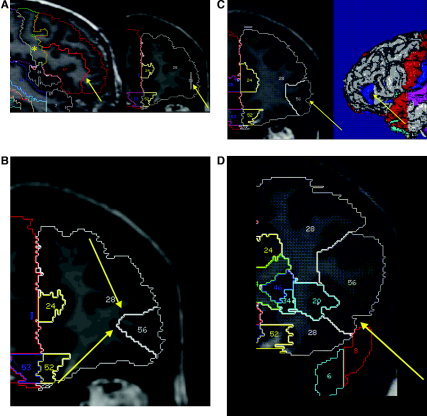
Delineation of the IFG on reoriented images in native space. Regions other than IFG are shown (nomenclature as in Hammers et al. [2003a, 2003b]; left IFG: 56; right IFG: 57; regions surrounding the IFG are: 51: precentral gyrus; 20/21: left/right insula; 28: frontal lobe prior to further subdivision). A: Sagittal marker slice; left side: marker as it appears on sagittal image (arrow) and connection of inferior frontal sulcus with precentral sulcus (*); right side: marker as it appears on the coronal image in aid of delineation (arrow). B: Anterior part of IFG. Line from the deepest point of the inferior frontal sulcus (upper arrow) to the deepest point of the frontomarginal sulcus/lateral orbital sulcus (lower arrow). At this point, the horizontal ramus of the lateral fissure is not visible. C: Inclusion of the horizontal ramus of the lateral fissure (left arrow) when this extends more medial than the connection between the deepest point of the inferior frontal sulcus to the deepest point of the frontomarginal sulcus/lateral orbital sulcus. On the right, the corresponding position on a 3‐D‐rendered scan is shown; the blue portion corresponds to the section of IFG defined starting anteriorly. D: The lateral orbital sulcus lies inferiorly to the widening horizontal ramus of the lateral fissure; therefore, tissue superior to and inferior to the fissure leading to the insula (arrow) is included. For further explanation, see “Algorithm for IFG Definition” in Materials and Methods.
REFERENCES
- Amunts K, Schleicher A, Burgel U, Mohlberg H, Uylings HB, Zilles K ( 1999): Broca's region revisited: cytoarchitecture and intersubject variability. J Comp Neurol 412: 319–341. [DOI] [PubMed] [Google Scholar]
- Amunts K, Malikovic A, Mohlberg H, Schormann T, Zilles K ( 2000): Brodmann's areas 17 and 18 brought into stereotaxic space — where and how variable? Neuroimage 11: 66–84. [DOI] [PubMed] [Google Scholar]
- Amunts K, Schleicher A, Zilles K, Weiss PH, Mohlberg H, Pieperhoff P, Eickhoff S, Gurd JM, Marshall JC, Shah NJ ( 2004a): Outstanding language competence and cytoarchitecture in Broca's speech region. Brain Lang 89: 346–353. [DOI] [PubMed] [Google Scholar]
- Amunts K, Weiss PH, Mohlberg H, Pieperhoff P, Eickhoff S, Gurd JM, Marshall JC, Shah NJ, Fink GR, Zilles K ( 2004b): Analysis of neural mechanisms underlying verbal fluency in cytoarchitectonically defined stereotaxic space—the roles of Brodmann areas 44 and 45. Neuroimage 22: 42–56. [DOI] [PubMed] [Google Scholar]
- Ashburner J, Friston KJ ( 1997): Multimodal image coregistration and partitioning — a unified framework. Neuroimage 6: 209–217. [DOI] [PubMed] [Google Scholar]
- Ashburner J, Friston KJ ( 1999): Nonlinear spatial normalization using basis functions. Hum Brain Mapp 7: 254–266. [DOI] [PMC free article] [PubMed] [Google Scholar]
- Ashburner J, Neelin P, Collins DL, Evans A, Friston K ( 1997): Incorporating prior knowledge into image registration. Neuroimage 6: 344–352. [DOI] [PubMed] [Google Scholar]
- Bergin PS, Raymond AA, Free SL, Sisodiya SM, Stevens JM ( 1994): Magnetic resonance volumetry. Neurology 44: 1770–1771. [DOI] [PubMed] [Google Scholar]
- Blanton RE, Levitt JG, Peterson JR, Fadale D, Sporty ML, Lee M, To D, Mormino EC, Thompson PM, McCracken JT ( 2004): Gender differences in the left inferior frontal gyrus in normal children. Neuroimage 22: 626–636. [DOI] [PubMed] [Google Scholar]
- Brodmann K ( 1909): Vergleichende Lokalisationslehre der Groβhirnrinde in ihren Prinzipien dargestellt aufgrund des Zellenbaues. Leipzig: Barth. [Google Scholar]
- Cabeza R, Nyberg L, Petrides M, Alivisatos B, Evans AC ( 2000): Imaging cognition. II. An empirical review of 275 PET and fMRI studies. J Cogn Neurosci 12: 1–47. [DOI] [PubMed] [Google Scholar]
- Cannestra AF, Bookheimer SY, Pouratian N, O'Farrell A, Sicotte N, Martin NA, Becker D, Rubino G, Toga AW ( 2000): Temporal and topographical characterization of language cortices using intraoperative optical intrinsic signals. Neuroimage 12: 41–54. [DOI] [PubMed] [Google Scholar]
- Chapman LJ, Chapman JP ( 1987): The measurement of handedness. Brain Cogn 6: 175–183. [DOI] [PubMed] [Google Scholar]
- Chiavaras MM, LeGoualher G, Evans A, Petrides M ( 2001): Three‐dimensional probabilistic atlas of the human orbitofrontal sulci in standardized stereotaxic space. Neuroimage 13: 479–496. [DOI] [PubMed] [Google Scholar]
- Collins DL, Neelin P, Peters TM, Evans AC ( 1994): Automatic 3D intersubject registration of MR volumetric data in standardized Talairach space. J Comput Assist Tomogr 18: 192–205. [PubMed] [Google Scholar]
- Collins DL, Zijdenbos AP, Baaré WFC, Evans AC ( 1999): ANIMAL+INSECT: improved cortical structure segmentation. LNCS 1613: 210–223. [Google Scholar]
- Crespo‐Facorro B, Kim J‐J, Andreasen NC, Spinks R, O'Leary D, Bockolt HJ, Harris G, Magnotta VA ( 2000): Cerebral cortex: a topographic segmentation method using magnetic resonance imaging. Psychiatry Res 100: 97–126. [DOI] [PubMed] [Google Scholar]
- Duvernoy HM ( 1999): The human brain. Surface, blood supply, and three‐dimensional sectional anatomy. New York: Springer. [Google Scholar]
- Eickhoff S, Walters NB, Schleicher A, Kril J, Egan GF, Zilles K, Watson JD, Amunts K ( 2005): High‐resolution MRI reflects myeloarchitecture and cytoarchitecture of human cerebral cortex. Hum Brain Mapp 24: 206–215. [DOI] [PMC free article] [PubMed] [Google Scholar]
- Evans AC, Kamber M, Collins DL, MacDonald D ( 1994): An MRI‐based probabilistic atlas of neuroanatomy In: Shorvon SD, Fish DR, Andermann F, Bydder GM, Stefan H, editors. Magnetic resonance scanning and epilepsy. New York: Plenum; p 263–274. [Google Scholar]
- Federative Committee of Anatomical Terminology ( 1998): Terminologia anatomica. International Anatomical Terminology . Stuttgart: Georg Thieme. [Google Scholar]
- Fischl B, van der Kouwe A, Destrieux C, Halgren E, Segonne F, Salat DH, Busa E, Seidman LJ, Goldstein J, Kennedy D, Caviness V, Makris N, Rosen B, Dale AM ( 2004): Automatically parcellating the human cerebral cortex. Cereb Cortex 14: 11–22. [DOI] [PubMed] [Google Scholar]
- Good CD, Johnsrude I, Ashburner J, Henson RNA, Friston KJ, Frackowiack RSJ ( 2001): Cerebral asymmetry and the effects of sex and handedness on brain structure: a voxel‐based morphometric analysis of 465 normal adult human brains. Neuroimage 14: 685–700. [DOI] [PubMed] [Google Scholar]
- Hammers A, Koepp MJ, Free SL, Brett M, Richardson MP, Labbé C, Cunningham VJ, Brooks DJ, Duncan JS ( 2002): Implementation and application of a brain template for multiple volumes of interest. Hum Brain Mapp 15: 165–174. [DOI] [PMC free article] [PubMed] [Google Scholar]
- Hammers A, Allom R, Koepp MJ, Free SL, Myers R, Lemieux L, Mitchell TN, Brooks DJ, Duncan JS ( 2003a): Three‐dimensional maximum probability atlas of the human brain, with particular reference to the temporal lobe. Hum Brain Mapp 19: 224–247. [DOI] [PMC free article] [PubMed] [Google Scholar]
- Hammers A, Koepp MJ, Richardson MP, Hurlemann R, Brooks DJ, Duncan JS ( 2003b): Grey and white matter flumazenil binding in neocortical epilepsy with normal MRI. A PET study of 44 patients. Brain 126: 1300–1318. [DOI] [PubMed] [Google Scholar]
- Holmes CJ, Hoge R, Collins L, Woods R, Toga AW, Evans AC ( 1998): Enhancement of MR images using registration for signal averaging. J Comput Assist Tomogr 18: 192–205. [DOI] [PubMed] [Google Scholar]
- Jackson GD, Duncan JS ( 1996): MRI neuroanatomy: a new angle on the brain. London: Churchill Livingstone. [Google Scholar]
- Kahle W ( 1986): Nervensystem und Sinnesorgane. Kahle W, Leonhardt H, Platzer W, editors. Stuttgart: Georg Thieme. [Google Scholar]
- Kennedy DN, Lange N, Makris N, Bates J, Meyer J, Caviness VSJ ( 1998): Gyri of the human neocortex: an MRI‐based analysis of volume and variance. Cereb Cortex 8: 372–384. [DOI] [PubMed] [Google Scholar]
- Kiebel SJ, Ashburner J, Poline JB, Friston KJ ( 1997): MRI and PET coregistration — a cross validation of statistical parametric mapping and automated image registration. Neuroimage 5: 271–279. [DOI] [PubMed] [Google Scholar]
- Lemieux L, Hagemann G, Krakow K, Woermann FG ( 1999): Fast, accurate, and reproducible automatic segmentation of the brain in T1‐weighted volume MRI data. Magn Reson Med 42: 127–135. [DOI] [PubMed] [Google Scholar]
- Lemieux L, Hammers A, Mackinnon T, Liu RSN ( 2003): Automatic segmentation of the brain and intracranial cerebrospinal fluid in T1‐weighted volume MRI scans of the head, and its application to serial cerebral and intracranial volumetry. Magn Reson Med 49: 872–884. [DOI] [PubMed] [Google Scholar]
- Lohmann G, Yves von Cramon D, Steinmetz H ( 1999): Sulcal variability of twins. Cereb Cortex 9: 754–763. [DOI] [PubMed] [Google Scholar]
- Mai JK, Assheuer J, Paxinos G ( 1997): Atlas of the human brain. Boston: Academic Press. [Google Scholar]
- Mazziotta J, Toga A, Evans A, Fox P, Lancaster J, Zilles K, Woods R, Paus T, Simpson G, ( 2001): A probabilistic atlas and reference system for the human brain: International Consortium for Brain Mapping (ICBM). Philos Trans R Soc Lond B Biol Sci 356: 1293–1322. [DOI] [PMC free article] [PubMed] [Google Scholar]
- Meyer JH, Gunn RN, Myers R, Grasby PM ( 1999): Assessment of spatial normalization of PET ligand images using ligand‐specific templates. Neuroimage 9: 545–553. [DOI] [PubMed] [Google Scholar]
- Mitchell TN, Free SL, Merschhemke M, Lemieux L, Sisodiya SM, Shorvon SD ( 2003): Reliable callosal measurement: population normative data confirm sex‐related differences. AJNR Am J Neuroradiol 24: 410–418. [PMC free article] [PubMed] [Google Scholar]
- Niemann K, Hammers A, Coenen VA, Thron A, Klosterkötter J ( 2000): Evidence for smaller left hippocampus and left temporal horn in both patients with first episode schizophrenia and normal controls. Psychiatry Res Neuroimaging 99: 93–110. [DOI] [PubMed] [Google Scholar]
- Nieuwenhuys R, Voogd J, van Huijzen C ( 1988): The human central nervous system. A synopsis and atlas. Heidelberg: Springer. [Google Scholar]
- Ono M, Kubik S, Abernathey CD ( 1990): Atlas of the cerebral sulci. Stuttgart: Georg Thieme. [Google Scholar]
- Petrides M, Alivisatos B, Evans AC ( 1995): Functional activation of the human ventrolateral frontal cortex during mnemonic retrieval of verbal information. Proc Natl Acad Sci U S A 92: 5803–5807. [DOI] [PMC free article] [PubMed] [Google Scholar]
- Robb RA ( 2001): The biomedical imaging resource at Mayo Clinic. IEEE Trans Med Imaging 20: 854–867. [DOI] [PubMed] [Google Scholar]
- Roland PE, Zilles K ( 1996): The developing European computerized human brain database for all imaging modalities. Neuroimage 4: S39–47. [DOI] [PubMed] [Google Scholar]
- Sarkisov SA, Filimonoff IN, Preobrashenskaya NS ( 1949): Cytoarchitecture of the human cortex cerebri [translated from Russian]. Moscow: Medgiz. [Google Scholar]
- Shrout PE, Fleiss JL ( 1979): Intraclass correlations: uses in assessing rater reliability. Psychol Bull 86: 420–428. [DOI] [PubMed] [Google Scholar]
- Sled JG, Zijdenbos AP, Evans AC ( 1998): A nonparametric method for automatic correction of intensity nonuniformity in MRI data. IEEE Trans Med Imaging 17: 87–97. [DOI] [PubMed] [Google Scholar]
- Svarer C, Madsen K, Hasselbalch SG, Pinborg LH, Haugbol S, Frokjaer VG, Holm S, Paulson OB, Knudsen GM ( 2005): MR‐based automatic delineation of volumes of interest in human brain PET images using probability maps. Neuroimage 24: 969–979. [DOI] [PubMed] [Google Scholar]
- Thompson PM, Mega MS, Woods RP, Zoumalan CI, Lindshield CJ, Blanton RE, Moussai J, Holmes CJ, Cummings JL, Toga AW ( 2001): Cortical change in Alzheimer's disease detected with a disease‐specific population‐based brain atlas. Cereb Cortex 11: 1–16. [DOI] [PubMed] [Google Scholar]
- Tomaiuolo F, MacDonald JD, Caramanos Z, Posner G, Chiavaras M, Evans AC, Petrides M ( 1999): Morphology, morphometry and probability mapping of the pars opercularis of the inferior frontal gyrus: an in vivo MRI analysis. Eur J Neurosci 11: 3033–3046. [DOI] [PubMed] [Google Scholar]
- Tzourio‐Mazoyer N, Landeau B, Papathanassiou D, Crivello F, Etard O, Delcroix N, Mazoyer B, Joliot M ( 2002): Automated anatomical labeling of activations in SPM using a macroscopic anatomical parcellation of the MNI MRI single‐subject brain. Neuroimage 15: 273–289. [DOI] [PubMed] [Google Scholar]
- van den Elsen PA, Pol E‐JD, Viergever MA ( 1993): Medical image matching — a review with classification. IEEE Eng Med Biol 12: 26–39. [Google Scholar]
- von Economo C, Koskinas GN ( 1925): Die Cytoarchitektonik der Hirnrinde des erwachsenen Menschen. Berlin: Springer. [Google Scholar]
- Watkins KE, Paus T, Lerch JP, Zijdenbos A, Collins DL, Neelin P, Taylor J, Worsley KJ, Evans AC ( 2001): Structural asymmetries in the human brain: a voxel‐based statistical analysis of 142 MRI scans. Cereb Cortex 11: 868–877. [DOI] [PubMed] [Google Scholar]