Silencing of Cytosolic or Mitochondrial Isoforms of Malic Enzyme Has No Effect on Glucose-stimulated Insulin Secretion from Rodent Islets (original) (raw)
Abstract
We have previously demonstrated a role for pyruvate cycling in glucose-stimulated insulin secretion (GSIS). Some of the possible pyruvate cycling pathways are completed by conversion of malate to pyruvate by malic enzyme. Using INS-1-derived 832/13 cells, it has recently been shown by other laboratories that NADP-dependent cytosolic malic enzyme (MEc), but not NAD-dependent mitochondrial malic enzyme (MEm), regulates GSIS. In the current study, we show that small interfering RNA-mediated suppression of either MEm or MEc results in decreased GSIS in both 832/13 cells and a new and more glucose- and incretin-responsive INS-1-derived cell line, 832/3. The effect of MEm to suppress GSIS in these cell lines was linked to a substantial decrease in cell growth, whereas MEc suppression resulted in decreased NADPH, shown previously to be correlated with GSIS. However, adenovirus-mediated delivery of small interfering RNAs specific to MEc and MEm to isolated rat islets, while leading to effective suppression of the targets transcripts, had no effect on GSIS. Furthermore, islets isolated from MEc-null MOD1–/– mice exhibit normal glucose- and potassium-stimulated insulin secretion. These results indicate that pyruvate-malate cycling does not control GSIS in primary rodent islets.
A prevailing model for the mechanism of glucose-stimulated insulin secretion (GSIS)3 holds that a glucose metabolism-induced increase in the ATP:ADP ratio results in closure of ATP-sensitive K+ channels, leading to plasma membrane depolarization, calcium influx though voltage-sensitive channels, and subsequent release of insulin-containing granules. This process is known as the ATP-dependent potassium channel-dependent pathway and appears to be especially important as a triggering signal for the first phase of insulin secretion. In the second phase of insulin secretion, other metabolic coupling factors are believed to participate, and ATP and calcium are thought to play a more permissive role (1–3).
With regard to mediators of GSIS other than ATP, recent attention has been drawn to mitochondrial/cytoplasmic pyruvate cycling pathways as potential generators of stimulus-secretion coupling factors. Anaplerotic pyruvate cycling in β-cells is facilitated by their relatively high level of pyruvate carboxylase (PC) expression, such that flux though this enzyme is estimated to be roughly equal to flux though pyruvate dehydrogenase (4–7). NMR-based flux analysis of variously glucose-responsive β-cell lines demonstrated a strong positive correlation between insulin secretion and pyruvate cycling activity but no correlation with pyruvate dehydrogenase-catalyzed glucose oxidation (5,8,9). Also, whereas acute treatment with a PC inhibitor results in decreases in both GSIS and pyruvate cycling (5,10,11), β-cells are protected against RNA interference-mediated reduction of PC levels because of a compensatory increment in the specific activity of the remaining PC enzyme that serves to maintain pyruvate cycling flux and GSIS (12).
Pancreatic β-cells express enzymes necessary for cycling of oxaloacetate (OAA) generated via PC back to pyruvate via at least three different pathways: the pyruvate-malate, pyruvatecitrate, and pyruvate-isocitrate cycling pathways (2). Recent work has focused on understanding which of these three pathways make important contributions to control of insulin secretion by glucose. The pyruvate-citrate cycling pathway has been linked to control of insulin secretion via its by-products: malonyl CoA and long chain acyl CoA (13–15). However, prevention of the glucose-induced rise in malonyl CoA by overexpression of malonyl CoA decarboxylase has no effect on GSIS (16–18). Furthermore, siRNA-mediated reduction of citrate lyase (19,20) or fatty acid synthase (19,21) in β-cell lines or rodent islets does not affect GSIS, providing evidence against the involvement of the pyruvate-citrate pathway in regulation of GSIS.
Two recent studies from our laboratory support the involvement of the pyruvate-isocitrate cycling pathway in the generation of metabolic signals for insulin secretion. In the first, activity of the mitochondrial citrate/isocitrate carrier was reduced using molecular and pharmacological methods, resulting in robust impairment of GSIS in both pancreatic cell lines and in rat islets (22). In the second study, siRNA-mediated suppression of cytosolic, NADP-dependent isocitrate dehydrogenase (ICDc) expression also resulted in impaired GSIS in both β-cell lines and rat islets, in concert with diminished pyruvate cycling flux and the NADPH:NADP ratio (23).
The third possible pyruvate cycling pathway is the pyruvate-malate cycle, which can involve either cytosolic, NADP-dependent malic enzyme (MEc) or a mitochondrial, NAD-dependent form (MEm). A recent study showed that siRNA-mediated suppression of MEc in the INS-1-derived 832/13 cell line resulted in ∼90% suppression of MEc mRNA levels, accompanied by a ∼40% reduction of insulin secretion in response to stimulatory glucose or the amino acids leucine and glutamine (24). Similar observations were made in the same cell line in a second, independent study (25). In contrast, a modest reduction in MEm levels did not affect GSIS but did decrease amino acid-stimulated insulin secretion at basal glucose concentrations (24). An unfortunate limitation of both of the foregoing studies is that the findings were not confirmed in primary islets, and the biological relevance of the pyruvate-malate cycle in regulation of GSIS therefore remains unclear.
In the current study, we report on the effects of suppression of MEm and MEc expression on GSIS in INS-1-derived cell lines, as well as in primary rat islets. Confirming and extending the prior reports (24,25), we found that reduction of MEc expression in two independent INS-1-derived cell lines, 832/13 and 832/3, resulted in suppression of GSIS. However, strong suppression of either MEc or MEm mRNA levels via adenovirus-mediated siRNA delivery had no effect on GSIS in primary rat islets. Moreover, islets from MOD1–/– mice, which lack expression of MEc, exhibit normal GSIS. Our studies therefore argue against the involvement of the pyruvate/malate pathway in regulation of GSIS in normal rodent islets, providing additional support for a primary role of the pyruvate-isocitrate cycle in control of this important biological response.
EXPERIMENTAL PROCEDURES
_Cell Lines and Primary Islets_—Two clonal cell lines (832/3 and 832/13) derived from INS-1 insulinoma β-cells by a transfection-selection strategy were used in these studies and were cultured as previously described (26). Primary islets were harvested from male Sprague-Dawley rats weighing ∼250 g as previously described (27) under a protocol approved by the Duke University Institutional Animal Care and Use Committee. Groups of 100 islets were cultured in 2 ml of RPMI medium supplemented with 10% fetal calf serum, 8 mm glucose, and 20 units/ml penicillin, 20 μg/ml streptomycin, 0.05 μg/ml amphotericin B (Invitrogen) with the medium changed daily. Primary islets were also harvested from lean C57B6 wild type mice and from weight-matched MOD1–/– mice as previously described (27).
_mRNA Analysis_—RNA was isolated from cells and islets using the RNeasy Mini Kit and the RNeasy Micro Kit, respectively (Qiagen) and was reverse transcribed with the iScript cDNA synthesis kit (Bio-Rad). Real time quantitative PCR was performed using iTaq SYBR Green Supermix with ROX (Bio-Rad) with primers against MEm and MEc and using cyclophilin B or glucose-6-phosphate dehydrogenase as internal controls. The primer sequences were: rat MEm, GAG AAA TGC CTG CCT GTG TGC ATC (S) and TCC ATC AGA TCG TCA TAG AGC TGG G (AS); rat MEc, TCC GAC CAG CAA AGC TGA GT (S) and CAC GGC CCT TGG TCA CTT (AS); mouse MEc, TGA ATC CAC AGC AGT GCC TTC C (S) and TCA TCA TAC TCC TCC CCA CGG ACA C (AS); rat cyclophilin B, CGG ACA GCC GGG ACA A (S) and TTC GAT CTT GCC ACA GTC TAC AA (AS); mouse and rat glucose-6-phosphate dehydrogenase, ACC ATC TGG TGG CTG TTC C (S) and CAT TCA TGT GGC TGT TGA AGG (AS).
_siRNA Duplex-mediated Gene Silencing_—The cells were transfected with siRNA duplexes (IDT, Coralville, IA) for 24 h using Dharmafect Transfection Reagent 1 (Dharmacon, Lafayette, CO) at a final concentration of 50 nm, followed by an additional 48 h in culture prior to analyses. The MEm siRNA target sequences were TGA CGA CAT TCA AGG GAC TGC TGC A (siMEm-1) and GAG AGA GAA TCC TGG GAC TTG GAG A (siMEm-2) corresponding to bp 831 and 488 of the rat cDNA sequence, respectively. The MEc siRNA target sequence was GAG GCC TCT TTA TCA GTA TCC ACG A, corresponding to bp 362 of the rat sequence, and sequences targeted at bp 162 and 961 were used to verify specificity. A scrambled duplex GAG ACC CTA TCC GTG ATT with no biological effect relative to untreated β-cells was used as a control (siControl) (23).
_Adenovirus-mediated Gene Silencing_—Adenoviruses containing siRNA sequences specific for MEm (Ad-siMEm-1 and Ad-siMEm-2), MEc (Ad-siMEc), or scrambled sequence (Ad-siControl) were constructed using vectors EH006 and pJM17, as recently described (28). The shRNA sequences corresponded to the MEm and MEc RNA duplex sequences used in the transfection method. Adenoviruses were purified using a BD Biosciences Adeno-X purification kit (Clontech, Palo Alto, CA), and transduction of cell lines and rat islets was performed as previously described (12,23).
_Insulin Secretion Assay_—After 72 h of treatment with duplexes or viruses, GSIS was measured from INS-1-derived cells as described previously (12) and from rat and mouse islets as described (23).
_Thymidine Incorporation_—The cells were incubated for 4 h in medium containing 1 μCi/ml [methyl-3H]thymidine (Amersham Biosciences). The cells were washed three times with phosphate-buffered saline, incubated twice on ice in 10% trichloroacetic acid, and subsequently resuspended in 0.3 m NaOH for 30 min, before lysate samples were counted using liquid scintillation. The results were normalized to protein content measured from remaining lysate samples.
_Glucose Oxidation_—[U-14C]Glucose oxidation was measured in 832/13 and 832/3 cells as previously described (12,23).
_NADPH Analysis_—832/13 cells were cultured in 6-well plates and used for GSIS assays, following which cell pellets were collected, frozen, and used for NADPH analysis as previously described (12).
_Glucose Incorporation into Lipids_—[U-14C]Glucose incorporation into lipids was measured in 832/13 cells as previously described (23).
_Organic Acids_—Organic acids were measured by a gas chromatography/mass spectrometry-based method in siMEc- and siControl-transfected 832/13 and 832/3 cells in 15-cm plates following culture in 3 or 12 mm glucose (12).
_13C NMR-based Pyruvate Cycling Measurements_—832/13 cells were cultured in 15-cm dishes, transfected with siRNA as described above, and incubated in buffer containing 2.5 or 12 mm [U-13C]glucose for 4 h. The lysates were collected in 3.5% perchloric acid, and NMR isotopomer analysis was performed as previously described (5).
_Statistics_—The data are expressed as the means ± S.E. of at least three independent experiments performed in triplicate. Statistical significance was determined using a two-tailed Student's t test, assuming equal variances. p < 0.05 was considered significant.
RESULTS
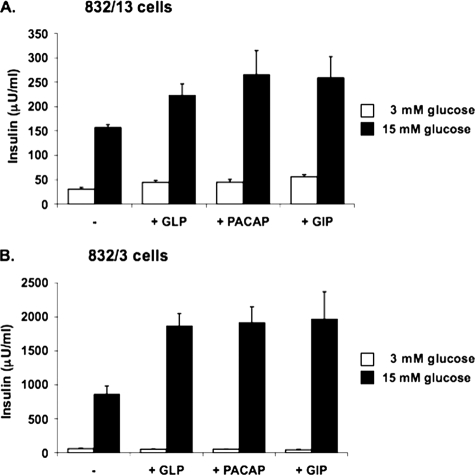
_The 832/3 Cell Line Exhibits Glucose and Incretin Responses Comparable with Primary Pancreatic Islets_—The INS-1-derived 832/13 insulinoma cell line is a widely used model for studying β-cell physiology and function (5,8,9,12,19,20,22–26,29). 832/13 cells have levels of glucose transporter GLUT-2 and glucokinase expression similar to those of normal islets and maintain robust GSIS over the physiological range of glucose concentrations for extended periods of time in tissue culture (26). We have recently characterized a sister clone to the 832/13 cell line, the 832/3 cell line. Like 832/13, 832/3 cells exhibit robust GSIS (Fig. 1). However, whereas 832/13 cells exhibit only an additional 50–70% potentiation of insulin secretion at stimulatory glucose in response to the incretin hormones GLP-1, PACAP, or GIP (Fig. 1_A_), the effect of these potentiators is approximately tripled in 832/3 cells (225–250% increases at stimulatory glucose;Fig. 1_B_). The difference in GLP-1 responsiveness in the 832/3 and 832/13 cell lines is not due to differences in levels of expression of the GLP-1 receptor, based on RT-PCR measurements (data not shown). These results establish the 832/3 cell line as an independent INS-1-derived cell line with strong glucose responsiveness that can be used to corroborate important findings made in the widely used 832/13 line. Moreover, 832/3 cells may be a particularly attractive new line for studies focused on the understanding of incretin regulators of insulin secretion.
FIGURE 1.
Characterization of INS-1-derived 832/13 and 832/3 cell lines. Glucose-stimulated insulin secretion was measured in 832/13 (A) and 832/3 (B) cells at 3 and 15 mm glucose in the presence or absence of 50 nm GLP-1, 50 nm PACAP, or 50 nm GIP. The data represent the means ± S.E. of three independent measurements and are representative of three other independent experiments.
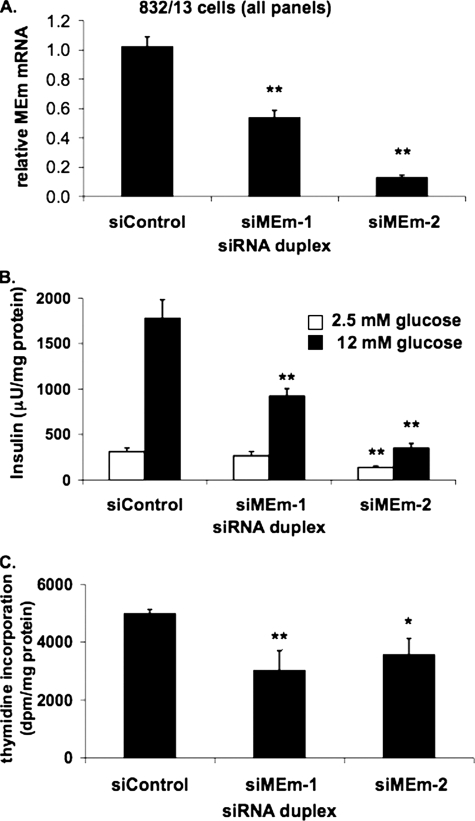
_Suppression of MEm Expression Inhibits GSIS and Cellular Proliferation in 832/13 Cells_—To investigate the possible involvement of a pyruvate-malate cycle in the regulation of GSIS, we began by suppressing the intramitochondrial, NAD-linked form of the enzyme, MEm. Two distinct siRNA molecules were transfected into 832/13 cells (siMEm-1 and siMEm-2), and following 72 h of culture, insulin secretion was measured and normalized to total protein content. siMEm-1 and siMEm-2 decreased mRNA levels by 46 ± 5 and 87 ± 1%, respectively (Fig. 2_A_). siControl-transfected cells increased insulin secretion by 5.7 ± 1.0-fold at stimulatory (12 mm) compared with basal (2.5 mm) glucose. In contrast, MEm siRNA-1- and MEm siRNA-2-treated cells exhibited only 3.5 ± 0.7- and 2.6 ± 0.5-fold increases, in both cases because of a significant decrease in insulin secretion at stimulatory glucose (p < 0.001 for cells treated with either siRNA duplex relative to controls) (Fig. 2_B_). Similar results were obtained in the 832/3 cell line (data not shown). These observations are in disagreement with a previous study wherein a 49% reduction in MEm mRNA levels in 832/13 cells had no effect on GSIS (24).
FIGURE 2.
Suppression of MEm expression in 832/13 cells impairs GSIS and cell proliferation. A, 832/13 cells were transfected with an siRNA with no known target (siControl) or two independent siRNAs targeting MEm, and the levels of MEm RNA were measured via RT-PCR. B, following 72 h of culture, GSIS was measured in 832/13 cells transfected with MEm or siControl siRNA duplexes and normalized to total protein content. C, [methyl-3H]thymidine incorporation was measured in 832/13 cells transfected with MEm or siControl siRNA duplexes, and the data were normalized to total protein content. For all three panels, the results represent the means ± S.E. of three independent experiments. *, p < 0.05; **, p < 0.005.
We observed that MEm suppression significantly decreased protein content compared with control cells and that siMEm-treated cells were less confluent at the time of GSIS assays. To investigate whether MEm silencing affects β-cell growth, we measured [methyl-3H]thymidine incorporation into genomic DNA. [methyl-3H]Thymidine incorporation into siMEm-1 and siMEm-2-transfected 832/13 cells was decreased by 26 ± 5 and 28 ± 3%, respectively, relative to siControl-transfected cells, suggesting that MEm is essential for maintaining cell growth in this cell line (Fig. 2_C_). These findings suggest that the decrease in insulin secretion in 832/13 cells in response to suppression of MEm expression is secondary to an effect on proliferation and cell density, consistent with our previous observation that maximal GSIS in INS-1-derived cell lines requires confluent cell cultures (26).
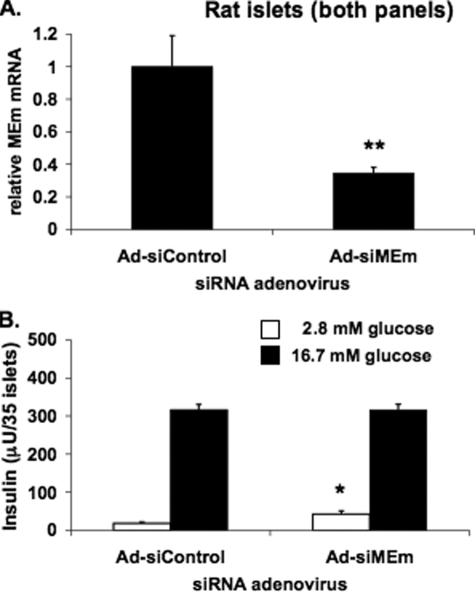
_Suppression of MEm Expression Does Not Inhibit GSIS in Primary Rat Islets_—Recombinant adenoviruses were constructed containing the MEm siRNA-1 and siRNA-2 shRNA sequences (Ad-siMEm-1 and Ad-siMEm-2). Treatment of 832/13 cells with these viruses caused 58 and 84% decreases in MEm mRNA levels, respectively, and suppressed GSIS in a manner similar to that reported for the transfected duplexes shown in Fig. 2 (data not shown). Next, isolated rat islets were transduced with Ad-siControl or a virus containing the more effective of the two MEm siRNAs, Ad-siMEm-2. Ad-siMEm-2 caused a 65 ± 3% suppression in MEm mRNA levels in rat islets, similar to the extent of suppression in 832/13 and 832/3 cells (Fig. 3_A_). However, unlike the findings in INS-1-derived cell lines, Ad-siMEm-2 treatment did not impair GSIS in primary rat islets compared with cells treated with Ad-siControl (Fig. 3_B_). A likely explanation for the impairment of GSIS in response to MEm suppression in the INS-1-derived cell lines and not in rat islets is that the normal rate of replication of cultured rat islet cells is very low and therefore was unlikely to be affected by MEm suppression to an extent that would impact insulin secretion.
FIGURE 3.
Adenovirus-mediated suppression of MEm expression in rat islets does not impair GSIS. A, MEm siRNA siMEm-2 was cloned into a recombinant adenovirus and used to transduce isolated rat islets. MEm mRNA was measured by RT-PCR. B, GSIS was measured in isolated rat islets treated with Ad-siControl or Ad-siMEm adenoviruses and normalized to islet number. For both panels, the results represent the means ± S.E. of three independent experiments. *, p < 0.05; **, p < 0.005.
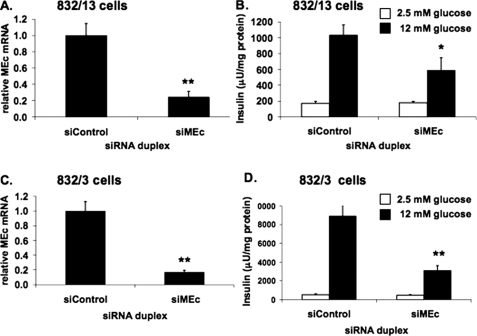
_Suppression of MEc Inhibits GSIS in 832/13 and 832/3 Cells_—We next studied the effects of suppression of the cytosolic, NADP-dependent isoform of malic enzyme, MEc. Transfection of 832/13 cells with a MEc-specific siRNA duplex caused a 76 ± 7% decrease of MEc mRNA in these cells (Fig. 4_A_). siControl-treated 832/13 cells exhibited a 6.1 ± 1.2-fold increase in insulin secretion when stimulated with 12 mm glucose, whereas siMEc treatment caused a 43 ± 15% decrease in insulin secretion at this glucose concentration, decreasing the fold response to 3.3 ± 1.0 (Fig. 4_B_). Similar effects were seen with two other siRNA duplexes targeting MEc (data not shown). A comparable response was seen when siMEc was transfected into the alternate INS-1-derived cell line, 832/3. In these cells, siMEc transfection reduced MEc mRNA by 83 ± 1% (Fig. 4_C_) and caused a decrease in GSIS from a robust 17.4 ± 3.8-fold response in siControl-treated cells to a 6.8 ± 1.5-fold response in siMEc-treated cells, because of a 65 ± 7% decrease in insulin secretion at 12 mm glucose (Fig. 4_D_). Taken together, these observations confirm and extend upon previously reported studies in 832/13 cells (24,25).
FIGURE 4.
Suppression of MEc expression impairs GSIS in 832/13 and 832/3 cells. An siRNA targeting MEc (siMEc) or siControl was transfected into 832/13 cells and 832/3 cells, respectively. Following 72 h of culture, MEc mRNA was measured via RT-PCR (832/13 (A) and 832/3 cells (C)), and GSIS was measured and normalized to total cellular protein (832/13 (B) and 832/3 cells (D)). The results represent the means ± S.E. of three independent experiments. *, p < 0.05; **, p < 0.005.
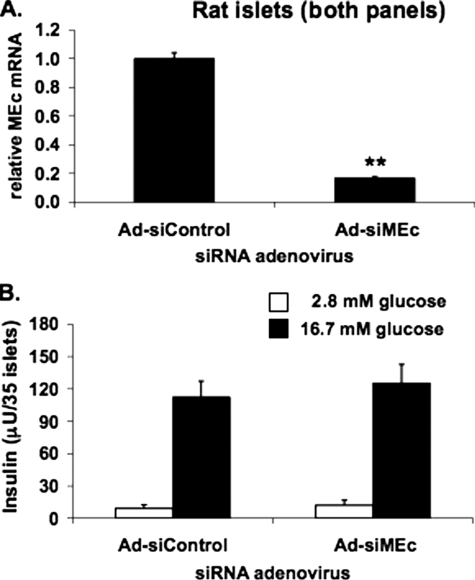
_Suppression of MEc Does Not Inhibit GSIS in Primary Rat Islets_—Prior studies of the effects of MEc silencing (24,25) did not include experiments in primary islets. To be able to silence MEc in primary islet cells, we constructed an adenovirus containing the siMEc sequence (Ad-siMEc). Treatment of rat islets with Ad-siMEc caused an 82 ± 3% reduction in MEc mRNA levels relative to Ad-siControl-treated cells (Fig. 5_A_). Importantly, this potent suppression of MEc expression had no effect on insulin secretion at either basal or stimulatory glucose levels (Fig. 5_B_). Thus, although suppression of MEc impairs GSIS in 832/13 and 832/3 cells, it has no effect in primary rat islets.
FIGURE 5.
Suppression of MEc expression does not impair GSIS in rat islets. An adenovirus containing siMEc (Ad-siMEc) or a control adenovirus containing an siRNA with no known target (Ad-siControl) was used to transduce isolated rat islets. MEc mRNA was measured (A), and insulin secretion at 2.8 and 16.7 mm glucose was normalized to islet number (B). The results represent the means ± S.E. of three independent experiments. *,p < 0.05; **, p < 0.005.
_Suppression of MEc in 832/13 Cells Does Not Impair Cell Growth_—Because siMEm had powerful inhibitory effects on cell growth, we tested the effects of suppression of MEc expression on [methyl-3H]thymidine incorporation into DNA in 832/13 and 832/3 cells. We found that siMEc transfection had no significant effect on thymidine incorporation in either cell line (data not shown). This suggests that, unlike MEm, MEc is not essential for supporting cell growth and that studies investigating the effects of suppression of MEc on GSIS are not confounded by effects on proliferation or cell density.
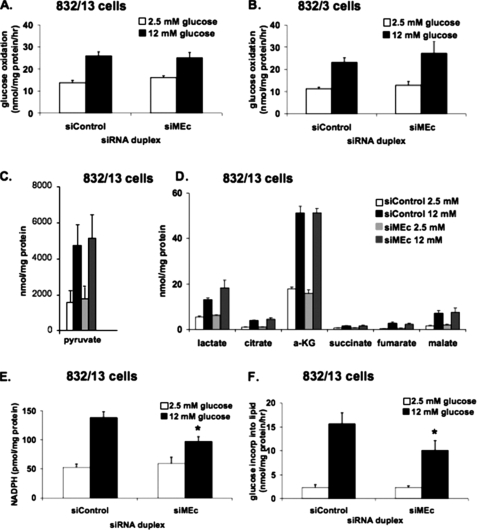
_Suppression of MEc in 832/13 or 832/3 Cells Does Not Affect Glucose Oxidation or Organic Acid Levels_—To test for possible metabolic effects of MEc suppression, [U-14C]glucose oxidation to14CO2 was measured in 832/13 (Fig. 6_A_) and 832/3 cells (Fig. 6_B_). In siControl-treated 832/13 or 832/3 cells, glucose oxidation rates approximately doubled in response to stimulatory glucose concentrations. For both cell lines, treatment with siMEc had no effect on glucose oxidation rates at either glucose concentration. Consistent with these findings, oxygen consumption rates were unchanged by siMEc transfection (data not shown).
FIGURE 6.
Metabolic effects of suppression of MEc expression in 832/13 and 832/3 cells. 832/13 or 832/3 cells were transfected with siMEc or siControl siRNA duplexes. [U-14C]Glucose oxidation to CO2 was measured at 2.5 and 12 mm glucose in 832/13 cells (A) and 832/3 cells (B), and the data were normalized to total cellular protein. C and D, pyruvate (C) and other organic acids (D) were measured at 2.5 and 12 mm glucose by gas chromatography/mass spectrometry in 832/13 cells and normalized to total cellular protein. E, NADPH was measured at 2.5 and 12 mm glucose in 832/13 cells and normalized to total cellular protein. F, [U-14C]glucose incorporation into lipids was measured at 2.5 and 12 mm glucose and normalized to total cellular protein. The results in all of the panels represent the means ± S.E. of three independent experiments. *, p < 0.05.
Organic acid profiling by gas chromatography/mass spectrometry was employed to measure pyruvate (Fig. 6_C_), lactate, and several tricarboxylic acid cycle intermediates in 832/13 (Fig. 6_D_) and 832/3 (data not shown) cells. When treated with siControl duplexes, both 832/13 and 832/3 cells exhibited significant increases in the levels of all organic acids when stimulated with 12 mm glucose. Treatment with siMEc caused no changes in organic acid levels relative to siControl treatment at either glucose concentration. Thus, the effect of siMEc to suppress GSIS in INS-1-derived cell lines is not due to changes in rates of glucose oxidation or changes in tricarboxylic acid cycle intermediates or glycolytic end products.
_Suppression of MEc in 832/13 Cells Decreases NADPH Levels and Glucose Incorporation into Lipids_—The MEc reaction converts malate to pyruvate while producing NADPH as a reaction by-product, and NADPH has previously been shown to correlate with insulin secretion (23,30). We hypothesized that suppression of MEc activity in INS-1-derived cell lines would result in a decrease in NADPH levels that accompanies the impairment in GSIS. As shown inFig. 6_E_, and in agreement with earlier studies (12,23), stimulation of siControl-treated 832/13 cells with 12 mm glucose caused a 2.6 ± 0.3-fold increase in NADPH levels relative to cells treated with 2.5 mm glucose. In siMEc-treated cells, the glucose-induced increase in NADPH was only 1.6 ± 0.3-fold, because of a 30 ± 8% decrease in NADPH at 12 mm glucose. We have also previously demonstrated a correlation between decreased NADPH production and a decrease in glucose incorporation into lipid, an NADPH-dependent process (23). Consistent with the NADPH data, [U-14C]glucose incorporation into lipid was decreased by 35 ± 14% in siMEc-treated 832/13 cells compared with siControl-treated cells at 12 mm glucose (Fig. 6_F_).
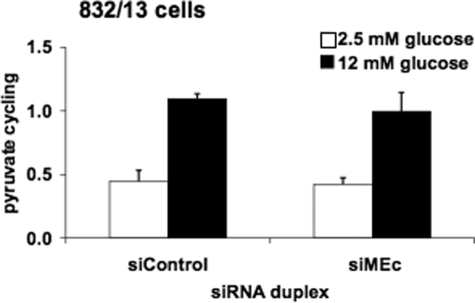
_Suppression of MEc in 832/13 Cells Does Not Impair Pyruvate Cycling_—We next investigated the possible impact of MEc suppression on pyruvate cycling activity. In control cells, pyruvate cycling increased 2.4 ± 0.5-fold in response to stimulatory glucose, and in siMEc-treated cells, pyruvate cycling increased 2.3 ± 0.5-fold (Fig. 7). Thus, the increment in pyruvate cycling as glucose was raised from 2.5 to 12 mm was unchanged in siMEc-versus siControl-treated cells. To determine whether the lack of effect of MEc suppression on pyruvate cycling may be due to compensatory up-regulation of MEm, we measured the levels of MEm mRNA in siMEc and siControl-treated cells but found no change in MEm expression in response to MEc suppression (data not shown).
FIGURE 7.
Suppression of MEc in 832/13 cells has no effect on pyruvate cycling. 832/13 cells were transfected with siMEc or siControl siRNA duplexes. Following 72 h of culture, the cells were incubated in 2.5 or 12 mm [U-13C]glucose for 3 h. Cell extracts were collected, and pyruvate cycling was measured via NMR-based mass isotopomer analysis. The results represent the means ± S.E. of five independent experiments.
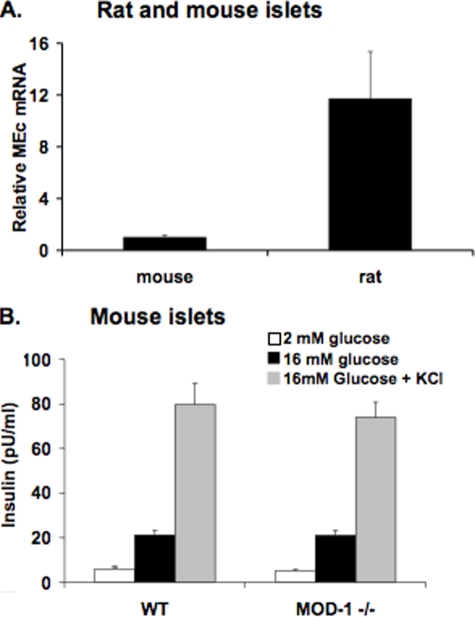
_Mouse Islets Lacking MEc Have Normal GSIS_—It has been suggested that mouse β-cells lack NADP-dependent malic enzyme activity (31), but these results have recently been refuted by another laboratory (32). To investigate this further, we measured MEc mRNA levels by real time PCR in mouse and rat islets. We found MEc mRNA to be readily detectable in mouse islets, although the expression level was significantly lower than in rat islets (Fig. 8_A_).
FIGURE 8.
Expression of MEc in mouse and rat islets and lack of effect of MEc deletion on GSIS in mouse islets. Islets were isolated from Wistar rats and from wild type (WT) and MOD1–/– mice.A, RNA was harvested, and MEc expression was measured in islets from Wistar rats and wild type mice by RT-PCR. The data are expressed relative to MEc expression in mouse islets, using an identical internal standard (cyclophilin) for both the rat and mouse RNA samples, and mouse and rat-specific MEc primers with similar binding affinities. B, insulin secretion was measured in wild type and MOD1–/– mouse islets in response to 2 mm glucose, 16 mm glucose, and 16 mm glucose plus 30 mm KCl. The results in all of the panels represent the means ± S.E. of three independent experiments.
To further investigate the role of MEc in the mouse islet, insulin secretion was measured from islets isolated from the MOD1–/– mouse, known to have an inactivating deletion in the MEc gene (33,34). Islets isolated from wild type mice exhibited a 3.6 ± 0.8-fold increase in insulin secretion as glucose was raised from 2 to 16 mm. The addition of KCl to islets in 16 mm glucose further potentiated GSIS in islets from wild type mice, as expected. Importantly, both the insulin secretion response to glucose and the effect of KCl were identical in islets from MOD1–/– mice as in islets from wild type mice (Fig. 8_B_). Furthermore, physiologic features of MEc–/– mice have been described by multiple groups (35–37). In particular, the mmgg mouse, which lacks both MEc and glycerol phosphate dehydrogenase, has normal blood glucose and serum insulin levels, and islets isolated from these animals demonstrate normal GSIS. Taken together, the current and extant work on MEc-deficient mouse strains are fully in agreement with the results reported herein involving MEc suppression in rat islets as shown in Fig. 5.
DISCUSSION
Flux through pyruvate cycling pathways is strongly correlated with GSIS (5,8,9,38). OAA generated from PC-mediated anaplerosis can participate in at least three different pyruvate cycling pathways. First, in the pyruvate-malate cycle, OAA is reduced to malate by mitochondrial malate dehydrogenase and then converted back to pyruvate, either by a cytosolic or a mitochondrial form of malic enzyme. In the pyruvate-citrate cycle, OAA is converted to citrate in the tricarboxylic acid cycle, exported to the cytosol by citrate/isocitrate carrier, and cleaved by ATP-citrate lyase to acetyl CoA and OAA, with the latter intermediate being converted to malate prior to cycling back to pyruvate via MEm or MEc. Finally, in the pyruvate-isocitrate cycle, OAA-derived citrate leaves the mitochondria as citrate or isocitrate and is oxidized to α-ketoglutarate via ICDc. The α-ketoglutarate formed in the ICDc reaction can then be converted back to pyruvate by one of several possible mitochondrial or cytosolic pathways that are still under investigation, some of which include MEm or MEc.
Recently, two groups have presented evidence for the involvement of the pyruvate-malate cycle in GSIS (24,25). These studies were performed solely in the 832/13 cell line, which was originally isolated in our laboratory from the parental rat INS-1 cell line (39) and displays glucose responsiveness comparable with what is observed in freshly isolated primary islets (26). The robust GSIS response, in combination with an ability to retain a differentiated β-cell phenotype over more than six months in culture, has made the 832/13 cell line a widely used tool for studying various aspects of β-cell function. Moreover, several studies from our laboratory have confirmed findings initially made in 832/13 cells in primary rat islets, demonstrating the utility of these cells as a model for studying β-cell biology (8,12,19,22,23,29,40). However, 832/13 cells have a higher growth rate than normal islets and as such are predicted to have differences in regulation of some metabolic pathways compared with normal rat islets. Furthermore, isolated β-cells in culture lack the three-dimensional structure of primary islets and physical interaction with other islet cell types. Consequently, whenever possible, results obtained in 832/13 cells should be confirmed in primary islets to better understand their physiological relevance (8,12,19,22,23,29,40).
In the current study, we have reinvestigated the role of the mitochondrial NAD-linked and cytosolic NADP-linked isoforms of malic enzymes (MEm and MEc, respectively) in GSIS in two independent INS-1-derived pancreatic β-cell lines. These studies extended the prior studies from other laboratories by including a new cell line developed in our laboratory, 832/3, with even more robust responses to glucose and incretin hormones than the 832/13 cell line. We also performed studies of the effect of malic enzyme suppression in primary rat and mouse islets.
When delivering siRNAs targeting MEm to either 832/13 or 832/3 cells, we observed a clear decrease in GSIS that was associated with an equally clear decline in cell replication, in contrast to the findings of Pongratz et al. (24), who found no effect of modest suppression of MEm expression on GSIS. We believe that our finding of suppressed GSIS in the INS-1-derived cell lines in the current study was secondary to a level of suppression of MEm sufficient to cause impairment of cell growth, as evidenced by a decrease in [methyl-3H]thymidine incorporation in siMEm-treated cells. However, in the absence of effects on cell growth, we do not believe that MEm plays a significant in control of insulin secretion, because suppression of MEm in primary rat islets had no effect on GSIS.
We were able to confirm the findings of previous studies (24,25) by showing that siRNA-mediated suppression of the cytosolic NADP-linked form of malic enzyme, MEc, caused a significant impairment of GSIS in 832/13 cells. Extending upon the prior observations, we also observed a similar inhibitory effect of MEc suppression in an independent INS-1-derived cell line, 832/3. The inhibitory effect of MEc suppression on GSIS in 832/13 and 832/3 cells seems to be independent of cell growth because [methyl-3H]thymidine incorporation was not affected by this manipulation. Also, glucose oxidation and organic acid profiles were unchanged in 832/13 or 832/3 cells treated with siMEc.
NADPH is a by-product of the MEc-catalyzed reaction, and this cofactor has previously been suggested to be a coupling factor in GSIS (22,23,30). Consistent with this idea, we were able to show a decrease in NADPH levels, as well as inhibition of an NADPH-dependent metabolic pathway (glucose incorporation into lipids) in response to MEc suppression. However, pyruvate cycling was unchanged by siMEc treatment. Pyruvate cycling flux as measured by 13C NMR relies on mass isotopomer analysis of glutamate. Changes in the relative abundance of glutamate mass isotopomer species is dependent upon the exchange of13C in glucose-derived metabolites with natural abundance12C, which occurs during metabolism of pyruvate through each of the several possible pyruvate cycling pathways. All three of the pyruvate cycles can in theory use either MEc or MEm as their final step, depending on the extent to which cytosolic di- and tricarboxylic acids re-enter the mitochondria for reconversion to pyruvate via MEm. In fact, islet β-cells, and specifically the β-cell lines 832/13 and 832/3 used in this study, have good expression of both the α-ketoglutarate carrier (also known as the 2-oxoglutarate carrier) and the mitochondrial dicarboxylate carrier (also known as the malate carrier) that could facilitate reimport of cytosolic intermediates, thus bypassing the need for metabolism through MEc. By this mechanism, pyruvate cycling could continue unabated, whereas suppression of MEc would specifically result in reduced production of an important cytosolic coupling factor, NADPH, leading to impaired insulin secretion in the β-cell lines.
In the current series of experiments, siRNA-mediated suppression of MEc or MEm failed to have any discernable effect on GSIS in rat islets, despite highly efficient suppression of these genes in the primary cell preparations. We suggest that these findings indicate that pyruvate cycling pathways that utilize MEc are less active in primary islets, such that strong suppression of the enzyme might fail to cause a drop in NADPH levels. Instead, we propose that the major source of cytosolic NAPDH production in primary islets is ICDc. Consistent with this idea, suppression of ICDc expression in rat islets results in a clear impairment of GSIS (23), which was clearly not the case for suppression of MEc in the current studies. It remains possible that MEc could play a contributing role in GSIS in normal islets under conditions other than those studied in this report, such as during the addition of free fatty acids as potentiators of insulin secretion.
It has been suggested that MEc is expressed in mouse β-cell lines but not in primary mouse islets (31), although this idea has recently been challenged (32). Real time PCR studies with mouse islet cDNA reported herein demonstrate that MEc is clearly expressed in mouse islets, although at significantly lower levels than in rat islets. Importantly, and consistent with the findings described above, we demonstrate that islets from MEc-null MOD1–/– mouse are indistinguishable from wild type islets in terms of GSIS, which is also consistent with normal glucose homeostasis in the mmgg mouse, which lacks both MEc and glycerol phosphate dehydrogenase (36,37).
Taken together, the weight of evidence in this and prior studies argues against a physiological role for MEm and MEc in regulation of GSIS, because suppression or knock-out of these enzymes in the physiologically most relevant settings of primary islets in vitro or in mutant mice in vivo has no effect on insulin secretion. A similar body of evidence in primary rat islets and knock-out mice argues against a primary role of the pyruvate-citrate pathway in control of GSIS (19,21). These findings focus fresh attention on the pyruvate-isocitrate cycle as a critical pathway for the generation of signals for that coordinate glucose metabolism with insulin secretion, based on strong impairment of GSIS in response to knockdown of either citrate/isocitrate carrier or ICDc in primary rat islets (22,23). Further studies on the exact enzymatic steps required for completion of the pyruvate-isocitrate cycling pathway and the second messengers that link this cycle to regulation of insulin secretion are in progress.
Acknowledgments
We thank Helena Winfield, Yue Feng, and Chris Thompson for technical assistance.
*
This work was supported, in whole or in part, by National Institutes of Health Grants DK42583 (to C. B. N.) and DK 58398 (to C. B. N. and A. D. S.). The costs of publication of this article were defrayed in part by the payment of page charges. This article must therefore be hereby marked “_advertisement_”in accordance with 18 U.S.C. Section 1734 solely to indicate this fact.
Footnotes
3
The abbreviations used are: GSIS, glucose-stimulated insulin secretion; siRNA, small interfering RNA; Ad-si, recombinant adenovirus expressing siRNA; ICDc, cytosolic NADP-dependent isocitrate dehydrogenase; MEc, cytosolic NADP-dependent malic enzyme; MEm, mitochondrial NAD-dependent malic enzyme; OAA, oxaloacetate; PC, pyruvate carboxylase; RT, reverse transcription.
References
- 1.Gunawardana, S. C., Liu, Y. J., Macdonald, M. J., Straub, S. G., and Sharp, G. W. (2004) Am. J. Physiol. 287 E828–E833 [DOI] [PubMed] [Google Scholar]
- 2.Muoio, D. M., and Newgard, C. B. (2008) Nat. Rev. Mol. Cell. Biol. 9 193–205 [DOI] [PubMed] [Google Scholar]
- 3.Henquin, J. C., Ravier, M. A., Nenquin, M., Jonas, J. C., and Gilon, P. (2003) Eur. J. Clin. Investig. 33 742–750 [DOI] [PubMed] [Google Scholar]
- 4.Khan, A., Ling, Z. C., and Landau, B. R. (1996) J. Biol. Chem. 271 2539–2542 [DOI] [PubMed] [Google Scholar]
- 5.Lu, D., Mulder, H., Zhao, P., Burgess, S. C., Jensen, M. V., Kamzolova, S., Newgard, C. B., and Sherry, A. D. (2002) Proc. Natl. Acad. Sci. U. S. A. 99 2708–2713 [DOI] [PMC free article] [PubMed] [Google Scholar]
- 6.MacDonald, M. J. (1993) Arch. Biochem. Biophys. 305 205–214 [DOI] [PubMed] [Google Scholar]
- 7.Schuit, F., De Vos, A., Farfari, S., Moens, K., Pipeleers, D., Brun, T., and Prentki, M. (1997) J. Biol. Chem. 272 18572–18579 [DOI] [PubMed] [Google Scholar]
- 8.Boucher, A., Lu, D., Burgess, S. C., Telemaque-Potts, S., Jensen, M. V., Mulder, H., Wang, M. Y., Unger, R. H., Sherry, A. D., and Newgard, C. B. (2004) J. Biol. Chem. 279 27263–27271 [DOI] [PubMed] [Google Scholar]
- 9.Cline, G. W., Lepine, R. L., Papas, K. K., Kibbey, R. G., and Shulman, G. I. (2004) J. Biol. Chem. 279 44370–44375 [DOI] [PubMed] [Google Scholar]
- 10.Farfari, S., Schulz, V., Corkey, B., and Prentki, M. (2000) Diabetes 49 718–726 [DOI] [PubMed] [Google Scholar]
- 11.Fransson, U., Rosengren, A. H., Schuit, F. C., Renstrom, E., and Mulder, H. (2006) Diabetologia 49 1578–1586 [DOI] [PubMed] [Google Scholar]
- 12.Jensen, M. V., Joseph, J. W., Ilkayeva, O., Burgess, S., Lu, D., Ronnebaum, S. M., Odegaard, M., Becker, T. C., Sherry, A. D., and Newgard, C. B. (2006) J. Biol. Chem. 281 22342–22351 [DOI] [PubMed] [Google Scholar]
- 13.Corkey, B. E., Deeney, J. T., Yaney, G. C., Tornheim, K., and Prentki, M. (2000) J. Nutr. 130 (Suppl. 2S) 299S–304S [DOI] [PubMed] [Google Scholar]
- 14.Herrero, L., Rubi, B., Sebastian, D., Serra, D., Asins, G., Maechler, P., Prentki, M., and Hegardt, F. G. (2005) Diabetes 54 462–471 [DOI] [PubMed] [Google Scholar]
- 15.Komatsu, M., Yajima, H., Yamada, S., Kaneko, T., Sato, Y., Yamauchi, K., Hashizume, K., and Aizawa, T. (1999) Diabetes 48 1543–1549 [DOI] [PubMed] [Google Scholar]
- 16.Antinozzi, P. A., Segall, L., Prentki, M., McGarry, J. D., and Newgard, C. B. (1998) J. Biol. Chem. 273 16146–16154 [DOI] [PubMed] [Google Scholar]
- 17.Mulder, H., Lu, D., Finley, J. t., An, J., Cohen, J., Antinozzi, P. A., McGarry, J. D., and Newgard, C. B. (2001) J. Biol. Chem. 276 6479–6484 [DOI] [PubMed] [Google Scholar]
- 18.Roduit, R., Nolan, C., Alarcon, C., Moore, P., Barbeau, A., Delghingaro-Augusto, V., Przybykowski, E., Morin, J., Masse, F., Massie, B., Ruderman, N., Rhodes, C., Poitout, V., and Prentki, M. (2004) Diabetes 53 1007–1019 [DOI] [PubMed] [Google Scholar]
- 19.Joseph, J. W., Odegaard, M. L., Ronnebaum, S. M., Burgess, S. C., Muehlbauer, J., Sherry, A. D., and Newgard, C. B. (2007) J. Biol. Chem. 282 31592–31600 [DOI] [PubMed] [Google Scholar]
- 20.MacDonald, M. J., Smith, A. D., 3rd, Hasan, N. M., Sabat, G., and Fahien, L. A. (2007) J. Biol. Chem. 282 30596–30606 [DOI] [PubMed] [Google Scholar]
- 21.Chakravarthy, M. V., Zhu, Y., Lopez, M., Yin, L., Wozniak, D. F., Coleman, T., Hu, Z., Wolfgang, M., Vidal-Puig, A., Lane, M. D., and Semenkovich, C. F. (2007) J. Clin. Investig. 117 2539–2552 [DOI] [PMC free article] [PubMed] [Google Scholar]
- 22.Joseph, J. W., Jensen, M. V., Ilkayeva, O., Palmieri, F., Alarcon, C., Rhodes, C. J., and Newgard, C. B. (2006) J. Biol. Chem. 281 35624–35632 [DOI] [PubMed] [Google Scholar]
- 23.Ronnebaum, S. M., Ilkayeva, O., Burgess, S. C., Joseph, J. W., Lu, D., Stevens, R. D., Becker, T. C., Sherry, A. D., Newgard, C. B., and Jensen, M. V. (2006) J. Biol. Chem. 281 30593–30602 [DOI] [PubMed] [Google Scholar]
- 24.Pongratz, R. L., Kibbey, R. G., Shulman, G. I., and Cline, G. W. (2007) J. Biol. Chem. 282 200–207 [DOI] [PubMed] [Google Scholar]
- 25.Guay, C., Madiraju, S. R., Aumais, A., Joly, E., and Prentki, M. (2007) J. Biol. Chem. 282 35657–35665 [DOI] [PubMed] [Google Scholar]
- 26.Hohmeier, H. E., Mulder, H., Chen, G., Henkel-Rieger, R., Prentki, M., and Newgard, C. B. (2000) Diabetes 49 424–430 [DOI] [PubMed] [Google Scholar]
- 27.Milburn, J. L., Jr., Hirose, H., Lee, Y. H., Nagasawa, Y., Ogawa, A., Ohneda, M., BeltrandelRio, H., Newgard, C. B., Johnson, J. H., and Unger, R. H. (1995) J. Biol. Chem. 270 1295–1299 [DOI] [PubMed] [Google Scholar]
- 28.Bain, J. R., Schisler, J. C., Takeuchi, K., Newgard, C. B., and Becker, T. C. (2004) Diabetes 53 2190–2194 [DOI] [PubMed] [Google Scholar]
- 29.Ronnebaum, S. M., Joseph, J. W., Ilkayeva, O., Burgess, S. C., Lu, D., Becker, T. C., Sherry, A. D., and Newgard, C. B. (2008) J. Biol. Chem. 283 14248–14256 [DOI] [PMC free article] [PubMed] [Google Scholar]
- 30.Ivarsson, R., Quintens, R., Dejonghe, S., Tsukamoto, K., in't Veld, P., Renstrom, E., and Schuit, F. C. (2005) Diabetes 54 2132–2142 [DOI] [PubMed] [Google Scholar]
- 31.MacDonald, M. J. (2002) Am. J. Physiol. 283 E302–E310 [DOI] [PubMed] [Google Scholar]
- 32.Li, C., Nissim, I., Chen, P., Buettger, C., Najafi, H., Daikhin, Y., Nissim, I., Collins, H. W., Yudkoff, M., Stanley, C. A., and Matschinsky, F. M. (2008) J. Biol. Chem. 283 17238–17249 [DOI] [PMC free article] [PubMed] [Google Scholar]
- 33.Brown, M. L., Wise, L. S., and Rubin, C. S. (1988) J. Biol. Chem. 263 4494–4499 [PubMed] [Google Scholar]
- 34.Cobb, R. R., Burkhart, J. G., Dubins, J. S., Barnett, L. B., and Lewis, S. E. (1990) Mutat. Res. 234 1–7 [DOI] [PubMed] [Google Scholar]
- 35.Lee, C. Y., Chasalow, F., Lee, S. M., Lewis, S., and Johnson, F. M. (1980) Mol. Cell Biochem. 30 143–149 [DOI] [PubMed] [Google Scholar]
- 36.Lee, C. Y., Lee, S. M., Lewis, S., and Johnson, F. M. (1980) Biochemistry 19 5098–5103 [DOI] [PubMed] [Google Scholar]
- 37.MacDonald, M. J., and Marshall, L. K. (2001) Mol. Cell Biochem. 220 117–125 [DOI] [PubMed] [Google Scholar]
- 38.Jensen, M. V., Joseph, J. W., Ronnebaum, S. M., Burgess, S. C., Sherry, A. D., and Newgard, C. B. (2008) Am. J. Physiol., in press
- 39.Asfari, M., Janjic, D., Meda, P., Li, G., Halban, P. A., and Wollheim, C. B. (1992) Endocrinology 130 167–178 [DOI] [PubMed] [Google Scholar]
- 40.Hohmeier, H. E., and Newgard, C. B. (2004) Mol. Cell. Endocrinol. 228 121–128 [DOI] [PubMed] [Google Scholar]
