Exploring Molecular Pathways of Triple-Negative Breast Cancer (original) (raw)
Abstract
Triple-negative breast cancer (TNBC) is an aggressive breast cancer subtype with a high rate of proliferation and metastasis, as well as poor prognosis for advanced-stage disease. Although TNBC was previously classified together with basal-like and BRCA1/2-related breast cancers, genomic profiling now shows that there is incomplete overlap, with important distinctions associated with each subtype. The biology of TNBC is still poorly understood; therefore, to define the relative contributions of major cellular pathways in TNBC, we have studied its molecular signature based on analysis of gene expression. Comparisons were then made with normal breast tissue. Our results suggest the existence of molecular networks in TNBC, characterized by explicit alterations in the cell cycle, DNA repair, nucleotide synthesis, metabolic pathways, NF-κB signaling, inflammatory response, and angiogenesis. Moreover, we also characterized TNBC as a cancer of mixed phenotypes, suggesting that TNBC extends beyond the basal-like molecular signature and may constitute an independent subtype of breast cancer. The data provide a new insight into the biology of TNBC.
Keywords: triple-negative breast cancer (TNBC), molecular pathways, DNA repair, cell cycle, NF-κB, tumor metabolism
Introduction
Breast cancer is a complex and heterogeneous disease with respect to histology, cellular origin, mutations, metastatic potential, disease progression, therapeutic response, and clinical outcome. More than 1 million women worldwide are diagnosed with breast cancer each year, with over 400,000 deaths.1,2 An estimated 170,000 of these diagnosed cases may be defined as triple-negative breast cancer (TNBC). TNBC is an aggressive breast cancer subtype that may be characterized by lack of expression of both estrogen receptor (ER) and progesterone receptor (PR), as well as absence of human epidermal growth factor 2 (HER2) upregulation.1-3
To better understand the heterogeneity of breast cancer and provide new classifications of breast cancer patients, genomic studies based on global gene expression analyses have established 6 breast cancer intrinsic subtypes, which are luminal A, luminal B, HER2-enriched, claudin-low, basal-like, and a normal breast-like group. Originally, the molecular profile of TNBC has been linked to the basal group of breast cancers, the phenotype of which is characterized by a gene expression profile similar to the basal-myoepithelial layer of normal breast cells.4-7 This profile exhibits overexpression of cytokeratins CK5/6 and CK14/17, caveolin 1 and 2, cyclin-D1, and P-cadherin, as well as mutations in p53.5,8,9 However, gene expression profiling suggests that TNBC and basal-like breast tumors are heterogeneous, and overlap is incomplete. Additional subtypes of breast cancer have been identified in TNBC, including claudin-low, HER2-enriched but without HER2 gene amplification, luminal A, luminal B, molecular apocrine, and immunomodulatory, mesenchymal stem-like subtypes.10,11 TNBC has also been associated with BRCA1/2-related breast cancers.6,7,12 However, although germline BRCA1 mutations can be predictive for TNBC, only 10% of TNBCs are associated with BRCA1 mutations, and other molecular signatures have not been well elucidated.6,7
TNBC is associated with high rates of proliferation and has a poorer prognosis than other breast cancer subtypes, as demonstrated by diminished progression-free survival and overall survival rates.1,13,14 There is also a sharp decrease in survival relative to other breast cancers within the first 3 to 5 years after diagnosis. However, distant relapse after 5 to 10 years becomes less common than in other breast cancers, and TNBC can be a potentially curable disease despite its overall aggressive nature.1,6,13,15,16 Although early TNBC can be sensitive to standard chemotherapy, traditional hormone therapies and targeted agents such as trastuzumab are not effective in this phenotype of cancer.8,17 A greater understanding of the molecular mechanisms of TNBC may facilitate the identification of therapeutic targets, as well as predictive or prognostic biomarkers, and enable an understanding of the mechanisms of response or failure to current cancer treatments.
Gene expression profiling using microarrays is a straightforward, robust method for the study of the molecular features of cancer at a systems level. The objective of this study was to characterize the molecular and pathway signatures of TNBC based on global gene expression analyses and comprehensive bioinformatics.
Results
Finding key pathways of TNBC
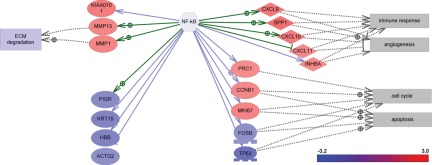
We focused our analysis on the regulation of major breast cancer cellular pathways. Such pathways are assumed to be deregulated (e.g., abnormally activated or suppressed) in a disease state and can provide key insights into the mechanisms and molecular features of a disease. First, we used Pathway Studio 7 (Ariadne Genomics, Rockville, MD), which implements a subnetwork enrichment analysis (SNEA) tool and uses a gene expression regulatory network built from facts extracted from the literature (for details, see Materials and Methods). This network was used to generate a comprehensive collection of gene sets, each representing immediate downstream targets of the individual genes in the network. It is assumed that if the downstream expression targets of the central seed protein are enriched with differentially expressed genes (i.e., the subnetwork is found to be statistically significant in the enrichment analysis), then the seed protein is one of the key regulators of the observed differential response. As the subnetworks were constructed from all known proteins in the entire expression network, including ligands, receptors, signaling proteins, and transcription factors, the seed proteins of statistically significant subnetworks presumably constitute the components of a regulatory network involved in the modulation of the observed differential response. The key regulators of differential response were identified by searching for all expression subnetworks in the ResNet 7 database enriched with highly differentially changed genes (at least 4-fold change, with P < 0.001 in all cancer vs normal differential expression profiles) using Fisher’s exact test (P value cutoff of 0.0001). The identified significant regulators are shown in Table 1. More specifically, significant regulators include angiotensinogen (AGT) and components of the NF-κB pathway, including NF-κB, TIRAP, CCL5, CCL4, and IKBKB. Identified NF-κB targets and regulators with more than 4-fold differential expression in TNBC are illustrated in Figure 1. These data suggest that the NF-κB pathway, which controls immune response, angiogenesis, the cell cycle, extracellular matrix degradation, and apoptosis, may represent a key regulator of TNBC.
Table 1.
Key Regulators of Triple-Negative Breast Cancer (TNBC) Identified by Enrichment Analysis of 4-fold Differentially Expressed Genes in TNBC Samples in Comparison with Normal Breast Tissue
| Subnetwork Pathway | Size | Gene Set Seed | P value |
|---|---|---|---|
| AGT | 363 | AGT | 8.87 × 10⁻⁷ |
| NF-κB | 659 | NF-κB | 1.37 × 10⁻⁶ |
| PDGF | 274 | PDGF | 2.35 × 10⁻⁶ |
| TP53 | 465 | TP53 | 2.48 × 10⁻⁶ |
| CLSPN | 1 | CLSPN | 4.75 × 10⁻⁵ |
| Arachidonate 15-lipoxygenase | 11 | Arachidonate 15-lipoxygenase | 6.71 × 10⁻⁵ |
| CCL5 | 33 | CCL5 | 8.35 × 10⁻⁵ |
| TIRAP | 12 | TIRAP | 8.68 × 10⁻⁵ |
| CCL4 | 13 | CCL4 | 1.099 × 10⁻⁴ |
| FGF2 | 350 | FGF2 | 1.312 × 10⁻⁴ |
| IL1 family | 284 | IL1 family | 1.365 × 10⁻⁴ |
| MELK | 2 | MELK | 1.419 × 10⁻⁴ |
| MASTL | 2 | MASTL | 1.419 × 10⁻⁴ |
| ESR1 | 288 | ESR1 | 1.517 × 10⁻⁴ |
| IKBKB | 39 | IKBKB | 1.595 × 10⁻⁴ |
| IL22 | 39 | IL22 | 1.595 × 10⁻⁴ |
Figure 1.
Gene expression changes in the NF-κB pathway in triple-negative breast cancer. ECM = extracellular matrix.
Analysis of differential gene expression of DNA repair, cell cycle, and apoptotic pathways
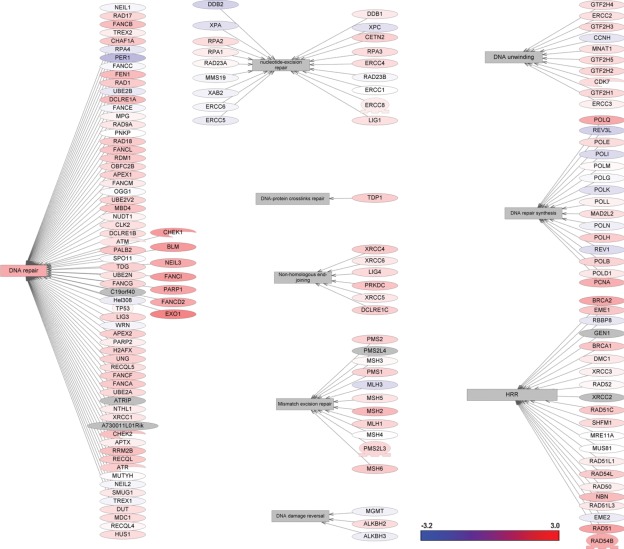
DNA damage repair is a complex and multifaceted process that is critical to cancer cell survival and response to DNA-damaging chemotherapy.4,18 To define the relative contribution of DNA repair to the TNBC phenotype, we investigated the differential changes in all known DNA repair pathways. The analysis of proteins involved in the regulation of DNA repair pathways was carried out using the ResNet 7 database.19 The significant changes in differential gene expression that we found among DNA repair molecular networks are presented in Figure 2 (see also Suppl. Table S1). Several genes involved in DNA repair are upregulated, including CHEK1, BLM, NEIL3, PARP1, FANCI, FANCD2, and EXO1. Interestingly, and in contrast, most of the genes involved in the excision repair pathway are transcriptionally repressed, including DDB2, RPA1, XAB2, and RAB23A. Furthermore, most of the genes involved in DNA mismatch repair are upregulated, including MLH1, MSH3, PMS1, and PMS2, and the critical genes involved in homologous recombination (BRCA2, RAD54B, RAD51, and RAD51L1) and DNA repair synthesis systems (POLQ and PCNA) are also upregulated.
Figure 2.
Gene expression changes in DNA repair pathways in triple-negative breast cancer.
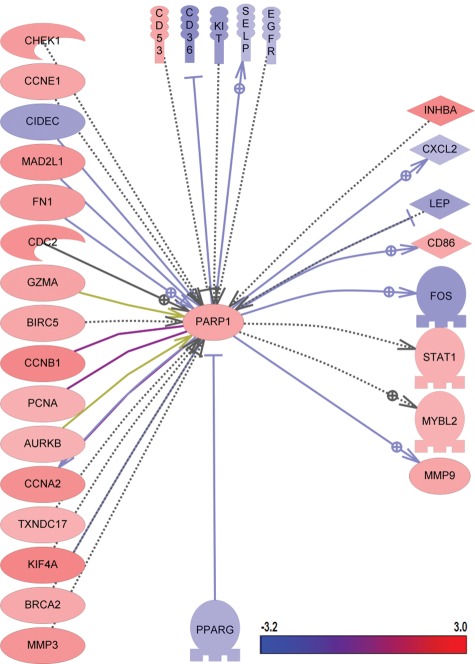
Cells with deficiencies in BRCA1, BRCA2, or other critical regulators of homologous recombination-mediated DNA repair are highly sensitive to poly ADP ribose polymerase (PARP) inhibitors.20-22 Although it has been shown that several members of the PARP family can be associated with breast cancer, it remains unclear how the combined actions of the PARP network and pathways could contribute to TNBC biology and response to chemotherapy.17,23 The PARP1 pathway in TNBC was therefore analyzed by selecting all upstream and downstream regulators in the ResNet 7 database with at least 2-fold differential changes (P < 0.001). The pathway is depicted in Figure 3 and shows that most genes in this pathway are upregulated in TNBC. All changes that were found are documented in Supplementary Table S2.
Figure 3.
Gene expression changes in PARP1 pathways in triple-negative breast cancer.
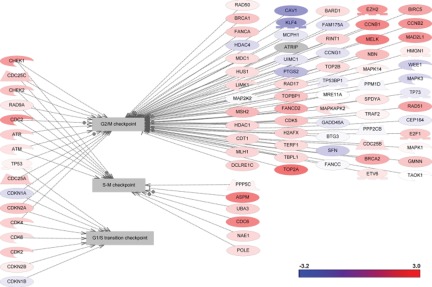
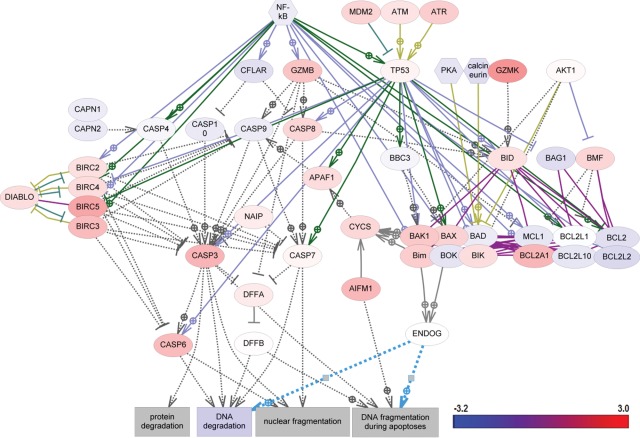
Differential changes in cell cycle pathways are presented in Figure 4. The major regulators of TNBC were found to map mitotic spindle checkpoint, spindle assembling, sister chromatid cohesion, DNA replication, and centrosome separation pathways (Table 2 and Suppl. Table S3). The majority of apoptotic pathways were not significantly affected in TNBC. Differential changes were observed only in the expression of individual genes of the BCL2 family (Fig. 5 and Suppl. Table S4).
Figure 4.
Gene expression changes in cell cycle pathways in triple-negative breast cancer.
Table 2.
Cellular Processes Significantly Affected in Triple-Negative Breast Cancer by Subnetwork Enrichment Analysis
| Cellular Process | Fold Change (Median) | P Value |
|---|---|---|
| Spindle assembly | 1.09543 | 2.97 × 10⁻⁸ |
| Chromosome segregation | 1.24326 | 5.59 × 10⁻⁸ |
| Kinetochore assembly | 1.24326 | 5.87 × 10⁻⁷ |
| Mitotic entry | 1.22061 | 1.28 × 10⁻⁶ |
| DNA replication checkpoint | 1.42698 | 3.45 × 10⁻⁶ |
| Mitotic spindle assembly | 1.54118 | 6.22 × 10⁻⁶ |
| Cell cycle checkpoint | 1.22404 | 9.29 × 10⁻⁶ |
| DNA replication initiation | 1.36079 | 1.00 × 10⁻⁵ |
| Mitotic checkpoint | 1.31549 | 1.26 × 10⁻⁵ |
| Centriole duplication | 1.27286 | 1.35 × 10⁻⁵ |
| Cytokinesis | 1.08512 | 1.59 × 10⁻⁵ |
| Diapedeses | 1.02289 | 1.74 × 10⁻⁵ |
| Wound healing | −1.05818 | 4.89 × 10⁻⁵ |
| Exit from mitosis | 1.27715 | 6.02 × 10⁻⁵ |
| Drug resistance | 1.03805 | 7.22 × 10⁻⁵ |
| Leukocyte migration | 1.0225 | 9.92 × 10⁻⁵ |
| Angiogenesis | −1.04112 | 9.95 × 10⁻⁵ |
| Extracellular matrix | −1.03602 | 0.000119 |
| G2/M checkpoint | 1.21602 | 0.000129 |
| Mitotic cell cycle | 1.30762 | 0.000145 |
| Sister chromatid cohesion | 1.41186 | 0.000157 |
| G2 phase | 1.16087 | 0.000166 |
| Lymphocyte activation | 1.1126 | 0.000224 |
| Genetic instability | 1.31549 | 0.000242 |
| Mitotic spindle checkpoint | 1.5886 | 0.000314 |
| Immune cell chemotaxis | 1.04873 | 0.000378 |
| S phase | 1.04246 | 0.000387 |
| Centrosome separation | 1.40222 | 0.000415 |
| Rosetting | 1.15516 | 0.000563 |
| Meiosis II | 1.4697 | 0.000583 |
| Lymphangiogenesis | −1.28571 | 0.000745 |
| M/G1 transition | 1.56147 | 0.000765 |
| Cell invasion | −1.01397 | 0.000835 |
| Macrophage chemotaxis | 1.01991 | 0.000898 |
Figure 5.
Gene expression changes in apoptotic pathways in triple-negative breast cancer.
Analysis of differential gene expression in metabolic pathways
Because the cell cycle is functionally linked to cellular metabolism and energy production, all metabolic pathways in the ResNet 7 database were analyzed using the gene set enrichment analysis (GSEA) algorithm and a Mann-Whitney test with a P value cutoff of 0.01. Significant changes in metabolic pathways of TNBC were found (Table 3). Purine, folate, and pyrimidine metabolism were the most significantly changed, consistent with the active proliferation of TNBC cells.
Table 3.
Metabolic Pathways Significantly Changed in Triple-Negative Breast Cancer by Gene Set Enrichment Analysis
| Pathway | Size | Gene Set Seed | P value |
|---|---|---|---|
| Purine metabolism | 151 | 1.04794 | 2.76 × 10⁻⁵ |
| Folate biosynthesis | 70 | 1.32692 | 0.000742 |
| Pyrimidine metabolism | 106 | 1.11415 | 0.001049 |
| Biosynthesis of cholesterol | 83 | 1.13374 | 0.002436 |
| Amino sugars synthesis | 57 | 1.33648 | 0.002488 |
| Respiratory chain and oxidative phosphorylation | 34 | 1.16559 | 0.003506 |
| Tryptophan metabolism | 110 | 1.03413 | 0.004232 |
| Nicotinate and nicotinamide metabolism | 46 | 1.03603 | 0.011342 |
| Lysine metabolism | 74 | −1.00047 | 0.012182 |
| Tricarboxylic acid cycle | 55 | 1.07236 | 0.014528 |
| Bile acids metabolism | 70 | −1.03581 | 0.020433 |
| Urea cycle and arginine metabolism | 86 | −1.03614 | 0.022182 |
| Phenylalanine and tyrosine metabolism | 103 | −1.00657 | 0.025452 |
| Ser/Gly/Thr/Cys metabolism | 133 | 1.01691 | 0.026181 |
| Histidine metabolism | 48 | −1.08427 | 0.040691 |
Analysis of differentially regulated cellular processes
The SNEA described for the identification of key regulators in this study was also applied to detect the cellular processes significantly affected by differential expression changes in TNBC. In this approach, subnetworks were built around each cell process in the ResNet 7 database, to contain all proteins known to be involved in the regulation of the process. SNEA (Mann-Whitney test) was applied using a P value cutoff of 0.05. Most of the significantly affected processes are related to cellular proliferation (spindle assembly, chromosome segregation, kinetochore assembly) and inflammation (leukocyte migration, lymphocyte activation, macrophage chemotaxis), as well as angiogenesis (Table 2).
Analysis of differential gene expression of oncogenes and tumor suppressors
As cell oncogenes and tumor suppressors play a significant role in the regulation of cell proliferation, gene transcription, and inflammation, we next investigated 273 oncogenes and 92 tumor suppressors in a TNBC molecular network using Ariadne Ontology in the ResNet 7 database. The changes in expression among analyzed oncogenes and tumor suppressors with at least a 2-fold change (P < 0.001) are documented in Table 4. The complete list of oncogenes and tumor suppressors that were analyzed in this study is presented in Supplementary Tables S5 and S6. Most of the oncogenes are downregulated in TNBC compared with normal breast tissue. The only exceptions are epithelial cell–transforming sequence 2 oncogene (ECT2), which is upregulated 3.5-fold, and MYBL1, which is upregulated 2.8-fold. Surprisingly, the changes in tumor suppressor pathways do not conform to any detectable trends. This may be attributed to an accumulation of mutations, rather than gene expression, during TNBC biogenesis.
Table 4.
Tumor Oncogenes and Tumor Suppressors with at Least 2-fold Differential Gene Expression Change
| Tumor Suppressor | Description | Log2 Change |
|---|---|---|
| JUN | jun oncogene | −1.2 |
| KLF6 | Kruppel-like factor 6 | −1 |
| CDON | Cdon homolog (mouse) | −1.2 |
| FOS | v-fos FBJ murine osteosarcoma viral oncogene homolog | −1.9 |
| THRA | Thyroid hormone receptor, alpha (erythroblastic leukemia viral [v-erb-a] oncogene homolog, avian) | −1 |
| FOSB | FBJ murine osteosarcoma viral oncogene homolog B | −2 |
| MYBL2 | v-myb myeloblastosis viral oncogene homolog (avian)–like 2 | 1 |
| ETS2 | v-ets erythroblastosis virus E26 oncogene homolog 2 (avian) | −1.5 |
| ERG | v-ets erythroblastosis virus E26 oncogene homolog (avian) | −1.1 |
| ECT2 | Epithelial cell transforming sequence 2 oncogene | 1.8 |
| THRB | Thyroid hormone receptor, beta (erythroblastic leukemia viral [v-erb-a] oncogene homolog 2, avian) | −1.3 |
| KIT | v-kit Hardy-Zuckerman 4 feline sarcoma viral oncogene homolog | −1.8 |
| CXCL2 | Chemokine (C-X-C motif) ligand 2 | −1.1 |
| EGFR | Epidermal growth factor receptor (erythroblastic leukemia viral [v-erb-b] oncogene homolog, avian) | −1.1 |
| GL13 | GLI family zinc finger 3 | −1.3 |
| MYBL1 | v-myb myeloblastosis viral oncogene homolog (avian)–like 1 | 1.5 |
| BRCA2 | Breast cancer 2, early onset | 1.2 |
| DLGAP5 | Discs, large (Drosophila) homolog-associated protein 5 | 2.5 |
| TGFBR2 | Transforming growth factor, beta receptor II (70/80 kDa) | −1.3 |
| EAF2 | ELL-associated factor 2 | 1.3 |
| TRIM59 | Tripartite motif-containing 59 | 1.4 |
| FAT4 | FAT tumor suppressor homolog 4 (Drosophila) | −1.4 |
| FAT2 | FAT tumor suppressor homolog 2 (Drosophila) | −1.3 |
| PDGFRL | Platelet-derived growth factor receptor-like | −1.5 |
Analysis of biomarkers of different subtypes of breast cancer
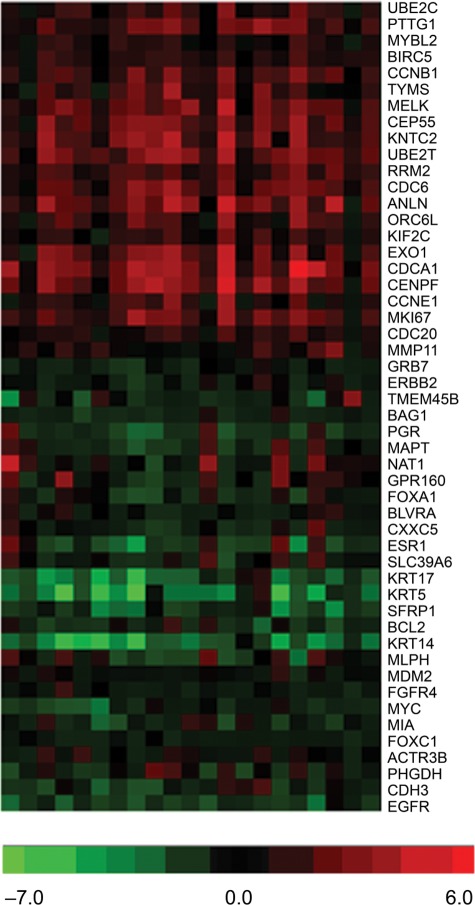
To build a more detailed molecular profile of TNBC, the molecular signatures of individual tumors and normal breast tissue samples were compared with a panel of biomarkers previously linked to different subtypes of breast cancer (luminal A, luminal B, HER2-enriched, basal-like, and normal breast-like) and described by Parker et al.24 The expression of some basal breast cancer markers was indeed found to be associated with TNBC in this study (Fig. 6, upper part of the panel). However, 5 genes—KRT17, KRT5, SFRP1, BCL2, and _KRT14_—were downregulated in all TNBC samples, and these changes are more likely to be characteristic of the luminal B subtype (Fig. 6). Several genes, such as MIA, FOXC1, ACTR3B, PHGDH, CDH3, and EGFR, also show changes that are inconsistent with the basal phenotype described previously.24 The established profile of basal-like breast cancers suggests that these markers should be upregulated; however, they were either downregulated or unchanged in all analyzed TNBC samples. These data suggest that TNBC does not completely overlap with basal-like breast cancer as it has been suggested previously and can be considered a heterogeneous subtype of breast cancer.
Figure 6.
Heat map depicting patterns of triple-negative breast cancer samples in gene expression selected by the relationship with intrinsic subtypes of breast cancer, such as luminal A, luminal B, HER2-enriched, basal-like, and a normal breast-like group4–7,24 (for details of the analysis, see Materials and Methods).
Discussion
Breast cancer represents a heterogeneous collection of cancer subtypes that arise as a consequence of altered gene expression and mutations acquired during carcinogenesis. This heterogeneity is apparent in cancers with different ER, PR, or gene expression profiles that reflect the origin of the tumor, such as basal or luminal.9,25 This leads to the notion that breast cancer is a nonspecific description of the disease and emphasizes the critical need for better characterization and classification of breast cancer subtypes, including TNBC. Molecular signatures of breast cancer subtypes can underline the mechanistic basis of this complex disease and, more important, can facilitate a development of novel targeted therapy for patients with breast cancer.
Subnetwork enrichment analysis (SNEA)
Here we describe major cellular pathways that are significantly altered in TNBC using SNEA, which is a variation of the GSEA algorithm. Unlike conventional GSEA, which uses a predefined collection of hand-curated gene sets, SNEA uses the global literature-extracted gene-gene expression regulation network to generate a comprehensive collection of gene sets. The gene sets are constructed for each individual protein (“seed”) in the global expression network and consist of all its downstream expression targets. The central idea of the SNEA approach is that if the downstream expression targets of a “seed” protein are enriched with differentially expressed genes, then the “seed” protein is one of the key regulators of the differential expression profile. The global expression network used for SNEA in our study comprised more than 160,000 relations.
The main advantage of SNEA is in the unbiased knowledge-driven nature of the algorithm. Subnetworks in SNEA are calculated from “facts” of regulation of gene expression extracted across the entire public domain. Another critically important power of SNEA resides in its ability to find genes and proteins for which changes in cancer are not on the level of mRNA but rather on a level of biological activity (i.e., “hidden” regulators). This is particularly important for proteins in which activity is regulated at posttranscriptional levels (e.g., by posttranslational protein modification and protein stability). The vast majority of cancer signaling pathways are activated or inactivated by virtue of phosphorylation of individual protein kinases, an event that is unlikely to be reflected on the level of mRNA measured in gene expression profiling. Similarly, activity of many transcription factors downstream of major signaling cascades is regulated by phosphorylation, and these changes would be overlooked in traditional gene expression profiling. SNEA can detect such regulators by looking at the changes in downstream gene signal transduction, not just gene expression itself. Another important advantage of SNEA is its ability to “summarize” the individual gene expression changes and “project” them to the system-level cellular signaling map. Thus, it allows interpretation of expression changes on the level of comprehensive cancer pathways.
TNBC pathways
SNEA analysis and comparison of TNBC with normal breast tissues revealed an unambiguous molecular signature of TNBC. The AGT, NF-κB, platelet-derived growth factor receptor (PDGFR), and p53 pathways were found to be the most significant regulators of TNBC. Surprisingly, the most significant regulator was found to be the AGT molecular network. The relationship between AGT and breast cancer has not been previously well characterized, although AGT has been reported to significantly increase angiogenic proteins in receptor-negative cells.26 Some changes in NF-κB, PDGFR, and p53 in breast cancer have been reported previously.27-29 Consistent with the aggressively proliferative phenotype of TNBC cells, the most significantly affected cellular processes were those involved in cell cycle regulation, although several inflammation-related processes were also significantly changed, suggesting an inflammatory component in the pathogenesis of TNBC. Interestingly, we identified several significantly changed biochemical pathways of purine/pyrimidine biosynthesis, oxidative phosphorylation, energy production, and nicotinamide metabolism.
The analysis of differential expression changes among the genes of DNA repair revealed that several DNA repair pathways, such as homologous recombination, mismatch repair, and DNA repair synthesis genes, were transcriptionally upregulated in TNBC. In contrast, most of the genes involved in excision repair pathways were transcriptionally repressed. These data suggest that DNA repair pathways can contribute to the biology of TNBC and could be considered for further investigation as potential targets for therapeutic intervention.
Analysis of breast cancer subtype biomarkers from TNBC patients revealed that TNBC shows mixed phenotypic characteristics, encompassing elements of other subtypes along with basal. These observations are consistent with previous reports that TNBC can represent a mixture of the basal and luminal subtypes and suggest that TNBC may constitute an independent group of breast cancer.9-11,25
In conclusion, taking all data together, this study shows that TNBC is characterized by a molecular signature and complex alterations in different tumor molecular pathways. The comparison of TNBC with normal breast tissue has shown substantial changes in the NF-κB signaling pathway, which controls inflammatory response, angiogenesis, and apoptosis. We also found significant changes in biochemical pathways of cell metabolism, nucleotide synthesis, the cell cycle, and regulation of DNA repair. Interestingly, we did not find meaningful changes in tumor suppressor genes in TNBC, although most of the oncogenes were downregulated. The data also illustrate that TNBC represents a heterogeneous group of breast cancers, and the established original classification of TNBC as a basal-like cancer needs to be revised, with a need for a further investigation and the creation of additional, improved, and highly specific biomarkers for this type of cancer. Taken together, these findings suggest that the characterization of breast cancer based on experimentally derived pathway signatures of primary human cancers provides a comprehensive approach for a greater understanding of the molecular framework linked to defined biology and better therapeutic strategies for the treatment of breast cancer.
Materials and Methods
RNA isolation
Sets of fresh-frozen TNBC and adjacent pathologically normal breast tissue samples from 20 patients were obtained from Cureline Biobank (Cureline, Inc., San Francisco, CA). The clinicopathological data are provided in Supplementary Table S7. The microarray methods were carried out according to published microarray studies.30 RNA was extracted from 10 to 30 mg of fresh frozen tissue using QIAGEN RNeasy kits (QIAGEN, Valencia, CA), and then RNA samples were treated with RNase-free DNase I (Ambion, Austin, TX).
RNA amplification: Synthesis of cDNA and labeling
RNA samples were amplified by conversion to cDNA using the NuGEN WT-Ovation FFPE RNA Amplification System (NuGEN Technologies, San Carlos, CA). Briefly, 50 ng of RNA was reverse transcribed to antisense cDNA, amplified using kit reagents, and purified using a QIAGEN PCR Purification Kit (QIAGEN). DNA concentration was determined using a Nanodrop ND-1000 spectrophotometer from 1 µL of purified product.31,32 Sense transcript cDNA (ST-cDNA) was generated from 2 to 4 µg of purified antisense cDNA using the kit reagents according to the manufacturer’s instructions. ST-cDNA was purified using a QIAGEN PCR Purification Kit. Up to 5 µg of purified ST-DNA was fragmented and biotin labeled using a NuGEN Encore Biotin Module Kit.
Hybridization, washing, and analysis
Biotin-labeled cDNA from each sample was directly hybridized to GeneChip Human Gene 1.0 ST Arrays (Affymetrix, Santa Clara, CA). Samples were incubated at 45°C in an Affymetrix Hybridization Oven 640 at 60 rpm for 16 hours and washed with an Affymetrix GeneChip Fluidics Station 450 according to the manufacturer’s specifications. Scanning was performed using the Affymetrix GeneChip 7G scanner using manufacturer-recommended default settings.
Data analysis
An Affymetrix Expression Console was used to generate QC parameters, process probe intensity files and CEL-format data files, and normalize and summarize a gene expression measurement for each probe set on the array through a robust multiarray averaging algorithm.33 For each individual sample, differential expression profiles of cancer versus normal breast tissue were calculated. In addition, the differential profile of all cancer samples versus all normal breast samples was calculated using an unpaired t test.
All gene expression analyses were performed in Pathway Studio 7 using the ResNet 7 database (Ariadne Genomics).31,33-37 Enrichment analysis in Pathway Studio 7 was performed by GSEA and SNEA algorithms.33,38 Functional enrichment was performed using Fisher’s exact test.
SNEA enrichment in Pathway Studio was calculated using the Mann-Whitney test, a nonparametric method for comparing the medians of nonnormal distributions X and Y. Both samples (having sizes N and M) are combined into one array in ascending order with each element then replaced by its rank in the array, from 1 to N + M. The ranks of the first sample elements were summarized and a Mann-Whitney U value calculated using
U=NM+N(N+1)2−∑xiRank(xi).
If the U value is close to the mean of U (i.e., 0.5·N_·_M) then the medians of X and Y are similar. The significance level of the U statistic can be derived from the distribution quantiles. When applied to gene expression data, two distributions are typically derived from the gene set or subnetwork and from entire gene expression profiles measured on chip. The following steps describe the computational steps performed by the SNEA algorithm.
SNEA was used to build subnetworks from the relationships in a database, based on criteria specified by the user. Initially, a central “seed” is created from all relevant entities in the database, and associated entities are retrieved based on their relationship with the seed (binding partners, expression targets, and protein modification targets).
Calculation of the background distribution algorithm was used to calculate a background distribution of all expression values for the selected sample in the experiment, typically from a differential measurement such as that resulting from the “Find Differentially Expressed Genes” tool.
Calculation of the subnetwork distribution algorithm was used to create a subnetwork distribution of the expression values in a similar manner for all subnetworks constructed in the previous step. More important, during distribution calculation, the expression value for each entity connected to a “seed” is accounted for as many times as the connectivity of that entity in ResNet. The purpose of this is to correct the bias introduced by different connectivity of entities in ResNet.
Statistical comparison of subnetwork distribution with background distribution
This algorithm was used to compare the statistical significance (P value) for the difference between the subnetwork and background distributions, using a one-sided Mann-Whitney U test.
Presentation and prioritization of results was carried out with Pathway Studio, which presents the “seed” entity for each subnetwork along with the subnetworks themselves in the user interface, ranked from lowest (best) to highest (worst) P value. Note: the percentage overlap is also presented to provide an adequate measurement of significance and confidence in various statistical tests of overlap.
Acknowledgments
We thank our collaborators at AltheaDx, Cureline, and Ariadne for their technical assistance and helpful discussions. Editorial assistance was provided by ArticulateScience Ltd. and was supported by Sanofi.
Footnotes
The author(s) declared the following potential conflicts of interest with respect to the research, authorship, and/or publication of this article: Valeria Ossovskaya is an employee of BiPar Sciences, Inc. (subsidiary of Sanofi). Yipeng Wang, Adam Budoff, Gordon Vansant, and Joseph Monforte are employees of AltheaDx, Inc. Qiang Xu is a former employee of AltheaDx, Inc. Alexander Lituev and Olga Potapova are employees of Cureline, Inc. Nikolai Daraselia is an employee of Ariadne, Inc.
This work was supported by BiPar Sciences Inc and Sanofi.
References
- 1.Cleere DW. Triple-negative breast cancer: a clinical update. Community Oncol. 2010;7:203–11 [Google Scholar]
- 2.Coughlin SS, Ekwueme DU. Breast cancer as a global health concern. Cancer Epidemiol. 2009;33:315–8 [DOI] [PubMed] [Google Scholar]
- 3.Ismail-Khan R, Bui MM. A review of triple-negative breast cancer. Cancer Control. 2010;17:173–6 [DOI] [PubMed] [Google Scholar]
- 4.Carey LA. Directed therapy of subtypes of triple-negative breast cancer. Oncologist. 2010;15(Suppl 5):49–56 [DOI] [PubMed] [Google Scholar]
- 5.Perou CM. Molecular stratification of triple-negative breast cancers. Oncologist. 2010;15(Suppl 5):39–48 [DOI] [PubMed] [Google Scholar]
- 6.Foulkes WD, Stefansson IM, Chappuis PO, et al. Germline BRCA1 mutations and a basal epithelial phenotype in breast cancer. J Natl Cancer Inst. 2003;95:1482–5 [DOI] [PubMed] [Google Scholar]
- 7.Lakhani SR, Reis-Filho JS, Fulford L, et al. Prediction of BRCA1 status in patients with breast cancer using estrogen receptor and basal phenotype. Clin Cancer Res. 2005;11:5175–80 [DOI] [PubMed] [Google Scholar]
- 8.Oakman C, Viale G, Di Leo A. Management of triple negative breast cancer. Breast. 2010;19:312–21 [DOI] [PubMed] [Google Scholar]
- 9.Bertucci F, Finetti P, Cervera N, et al. How basal are triple-negative breast cancers? Int J Cancer. 2008;123:236–40 [DOI] [PubMed] [Google Scholar]
- 10.Lehmann BD, Bauer JA, Chen X, et al. Identification of human triple-negative breast cancer subtypes and preclinical models for selection of targeted therapies. J Clin Invest. 2011;121:2750–67 [DOI] [PMC free article] [PubMed] [Google Scholar]
- 11.Ma CX, Luo J, Ellis MJ. Molecular profiling of triple negative breast cancer. Breast Dis. 2010;32:73-84 [DOI] [PubMed] [Google Scholar]
- 12.Chacon RD, Costanzo MV. Triple-negative breast cancer. Breast Cancer Res. 2010;12(Suppl 2):S3. [DOI] [PMC free article] [PubMed] [Google Scholar]
- 13.Dent R, Trudeau M, Prtichard KI, et al. Triple-negative breast cancer: clinical features and patterns of recurrence. Clin Cancer Res. 2007;13:4429–34 [DOI] [PubMed] [Google Scholar]
- 14.Rakha EA, El Sayed ME, Green AR, et al. Prognostic markers in triple-negative breast cancer. Cancer. 2007;109:25–32 [DOI] [PubMed] [Google Scholar]
- 15.Cheang MC, Voduc D, Bajdik C, et al. Basal-like breast cancer defined by five biomarkers has superior prognostic value than triple-negative phenotype. Clin Cancer Res. 2008;14:1368–76 [DOI] [PubMed] [Google Scholar]
- 16.Dent R, Hanna W, Trudeau M, et al. Pattern of metastatic spread in triple-negative breast cancer. Breast Cancer Res Treat. 2009;115:423–28 [DOI] [PubMed] [Google Scholar]
- 17.Pal SK, Childs BH, Pegram M. Triple negative breast cancer: unmet medical needs. Breast Cancer Res Treat. 2011;125:627–36 [DOI] [PMC free article] [PubMed] [Google Scholar]
- 18.Madhusudan S, Middleton MR. The emerging role of DNA repair proteins as predictive, prognostic and therapeutic targets in cancer. Cancer Treat Rev. 2005;31:603–17 [DOI] [PubMed] [Google Scholar]
- 19.Wood RD, Mitchell M, Lindhal T. Human DNA repair genes. Mutat Res. 2005;577:275–83 [DOI] [PubMed] [Google Scholar]
- 20.Turner N, Tutt A, Ashworth A. Targeting the DNA repair defect of BRCA tumours. Curr Opin Pharmacol. 2005;5:388–93 [DOI] [PubMed] [Google Scholar]
- 21.Boehler C, Gauthier LR, Mortusewicz O, et al. Poly(ADP-ribose) polymerase 3 (PARP3), a newcomer in cellular response to DNA damage and mitotic progression. Proc Natl Acad Sci U S A. 2011;108:2783–88 [DOI] [PMC free article] [PubMed] [Google Scholar]
- 22.Cook BD, Dynek JN, Chang W, Shostak G, Smith S. Role for the related poly(ADP-Ribose) polymerases tankyrase 1 and 2 at human telomeres. Mol Cell Biol. 2002;22:332–42 [DOI] [PMC free article] [PubMed] [Google Scholar]
- 23.Ossovskaya V, Koo IC, Kaldjian EP, Alvares C, Sherman BM. Upregulation of poly (ADP-ribose) polymerase-1 (PARP1) in triple-negative breast cancer and other primary human tumor types. Genes Cancer. 2010;1:812–21 [DOI] [PMC free article] [PubMed] [Google Scholar]
- 24.Parker JS, Mullins M, Cheang MC, et al. Supervised risk predictor of breast cancer based on intrinsic subtypes. J Clin Oncol. 2009;27:1160–67 [DOI] [PMC free article] [PubMed] [Google Scholar]
- 25.Bertucci F, Finetti P, Cervera N, et al. How different are luminal A and basal breast cancers? Int J Cancer. 2009;124:1338–48 [DOI] [PubMed] [Google Scholar]
- 26.Herr D, Rodewald M, Fraser HM, et al. Potential role of renin-angiotensin-system for tumor angiogenesis in receptor-negative breast cancer. Gynecol Oncol. 2008;109:418–25 [DOI] [PubMed] [Google Scholar]
- 27.Bendinelli P, Matteucci E, Maroni P, Desiderio MA. NF-κB activation, dependent on acetylation/deacetylation, contributes to HIF-1 activity and migration of bone metastatic breast carcinoma cells. Mol Cancer Res. 2009;7:1328–41 [DOI] [PubMed] [Google Scholar]
- 28.Kim HS, Yom CK, Kim HJ, et al. Overexpression of p53 is correlated with poor outcome in premenopausal women with breast cancer treated with tamoxifen after chemotherapy. Breast Cancer Res Treat. 2010;121:777–88 [DOI] [PubMed] [Google Scholar]
- 29.Roussidis AE, Theocharis AD, Tzanakakis GN, Karamanos NK. The importance of c-Kit and PDGF receptors as potential targets for molecular therapy in breast cancer. Curr Med Chem. 2007;14:735–43 [DOI] [PubMed] [Google Scholar]
- 30.Liang Y, Diehn M, Watson N, et al. Gene expression profiling reveals molecularly and clinically distinct subtypes of glioblastoma multiforme. Proc Natl Acad Sci U S A. 2005;102:5814–19 [DOI] [PMC free article] [PubMed] [Google Scholar]
- 31.Daraselia N, Yuryev A, Egorov S, Mazo I, Ispolatov I. Automatic extraction of gene ontology annotation and its correlation with clusters in protein network. BMC Bioinformatics. 2007;8:243. [DOI] [PMC free article] [PubMed] [Google Scholar]
- 32.Gomez RM, Moscato P. Identification of a 5-protein biomarker molecular signature for predicting Alzheimer’s disease. PLoS ONE. 2008;3:e3111. [DOI] [PMC free article] [PubMed] [Google Scholar]
- 33.Sivachenko AY, Yuryev A, Daraselia N, Mazo I. Molecular networks in microarray analysis. J Bioinform Comput Biol. 2007;5:429–56 [DOI] [PubMed] [Google Scholar]
- 34.Sivachenko A. Identifying local gene expression patterns in biomolecular networks. Paper presented at the IEEE Computational Systems Bioinformatics Conference, Stanford, CA, August 8–11, 2005 [Google Scholar]
- 35.Sivachenko A, Kalinin A, Yuryev A. Pathway analysis for design of promiscuous drugs and selective drug mixtures. Curr Drug Discov Technol. 2006;3:269–77 [DOI] [PubMed] [Google Scholar]
- 36.Yuryev A, Mulyukov Z, Kotelnikova E, et al. Automatic pathway building in biological association networks. BMC Bioinformatics. 2006;7:171. [DOI] [PMC free article] [PubMed] [Google Scholar]
- 37.Yuryev A. In silico pathway analysis: the final frontier towards completely rational drug design. Expert Opin Drug Discov. 2008;3:867–76 [DOI] [PubMed] [Google Scholar]
- 38.Subramanian A, Tamayo P, Mootha VK, et al. Gene set enrichment analysis: a knowledge-based approach for interpreting genome-wide expression profiles. Proc Natl Acad Sci U S A. 2005;102:15545–50 [DOI] [PMC free article] [PubMed] [Google Scholar]
