Overexpression of an inactive mutant cathepsin D increases endogenous alpha-synuclein and cathepsin B activity in SH-SY5Y cells* (original) (raw)
. Author manuscript; available in PMC: 2015 Mar 1.
Published in final edited form as: J Neurochem. 2013 Nov 13;128(6):950–961. doi: 10.1111/jnc.12497
Abstract
Parkinson’s disease (PD) is a neurodegenerative movement disorder. The histopathology of PD comprises proteinaceous inclusions known as Lewy bodies, which contains aggregated α-synuclein. Cathepsin D (CD) is a lysosomal protease previously demonstrated to cleave α-synuclein and decrease its toxicity in both cell lines and mouse brains in vivo. Here we show that pharmacological inhibition of CD, or introduction of catalytically inactive mutant CD resulted in decreased CD activity and increased cathepsin B activity, suggesting a possible compensatory response to inhibition of CD activity. However, this increased cathepsin B activity was not sufficient to maintain α-synuclein degradation, as evidenced by the accumulation of endogenous α-synuclein. Interestingly, the levels of LC3, LAMP1 and LAMP2, proteins involved in autophagy-lysosomal activities, as well as total lysosomal mass as assessed by LysoTracker flow cytometry, were unchanged. Neither autophagic flux nor proteasomal activities differ between cells over expressing wildtype versus mutant CD. These observations point to a critical regulatory role for that endogenous CD activity in dopaminergic cells in α-synuclein homeostasis which cannot be compensated for by increased Cathepsin B. These data support the potential need to enhance CD function in order to attenuate α-synuclein accumulation as a therapeutic strategy against development of synucleinopathy.
Keywords: cathepsin D, α-synuclein, autophagy, lysosome
INTRODUCTION
Parkinson’s disease (PD) is a chronic neurodegenerative movement disorder in which the gradual destruction of dopaminergic neurons in the substantia nigra pars compacta of the midbrain contributes to the pathology of the disease (Martin et al. 2011). The protein α-synuclein is thought to be critical in the pathogenesis of PD. Genetic mutations resulting in α-synuclein over expression have been shown to cause a rare, familial form of PD (Chartier-Harlin et al. 2004; Singleton et al. 2003; Ibanez et al. 2004), and many current therapeutic strategies are aimed at reducing α-synuclein burden (Vekrellis and Stefanis 2012).
The autophagy-lysosome pathway is important for removal of damaged or aggregated proteins and has also been shown to play an integral role in maintaining cellular function, both in basal conditions and during pathological processes (Schneider and Zhang 2010; Lee et al. 2012; Zhang 2013; Dodson et al. 2013). The ALP comprises several complex signaling pathways in which autophagy genes (ATG genes) orchestrate the packaging and targeting of cellular constituents ultimately delivered to the lysosome, where they are processed and/or degraded (Yang and Klionsky 2010). Macroautophagy and chaperone-mediated autophagy are the most extensively characterized forms of autophagy to date. Macroautophagy (hereafter referred to as simply autophagy) involves sequestration of bulk cytoplasmic constituents within the autophagosome for delivery to, and subsequent degradation by the lysosome (Yang and Klionsky 2010).
Lysosomal function declines in the brain with age, conceivably leaving the brain more vulnerable to neurodegeneration, and aging is indeed the largest risk factor for the development of neurodegenerative disease (Schneider and Zhang 2010). Autophagy-lysosome dysfunction has been extensively reported in PD (Anglade et al. 1997; Crews et al. 2010; Alvarez-Erviti et al. 2010; Geisler et al. 2010; Dehay et al. 2010; Winslow et al. 2010). Several groups have shown that α-synuclein degradation can occur via both the macroautophagy and chaperone-mediated autophagy pathways (Webb et al. 2003; Vogiatzi et al. 2008; Mak et al. 2010), and that perturbation of these pathways can lead to increases in α-synuclein levels and concomitant cellular pathology (Vogiatzi et al. 2008; Qiao et al. 2008).
Cathepsin D (CD) is an aspartyl protease is one of the important lysosomal proteins responsible for removing aggregated and damaged proteins. CD plays an essential role in maintaining the function of the autophagy-lysosomal pathway as evidence by the observation that CD knockout mice die within a few weeks of birth from a combination of pathologies including intestinal necrosis and neurodegeneration (Koike et al. 2000). Interestingly, we have previously shown that they exhibit a profound α-synuclein accumulation and aggregation within the brain, which becomes apparent in the days preceding death (Qiao et al. 2008). This finding, along with a subsequent study (Cullen et al. 2009) suggests that CD function includes a role in α-synuclein homeostasis.
To test whether overexpression of wildtype or mutant CD affects α-synuclein metabolism in the context of the autophagy-lysosomal pathway, we have generated lentiviral vectors over expressing CD for use in a dopaminergic cell line. The D295N CD mutation alters one of the active site aspartic acid residues at amino acid position 295, resulting in a stable protein with no enzymatic activity (Tyynela et al. 2000). The ovine homologue of this mutation was previously shown to cause a lysosomal storage disorder which was fatal in the homozygous state (Tyynela et al. 2000).
We have found that over expression of wildtype CD had little effect on endogenous α-synuclein levels, whereas the D295N inactive mtCD resulted in a dramatic increase in endogenous α-synuclein levels. Interestingly, the enzymatically inactive mtCD caused a decrease in endogenous CD activity, but an increase in CB activity. Although autophagic flux was not altered by wild type or mtCD, proteasomal activities appear to be increased by both. In supporting a specific role of CD but not CB in α-synuclein degradation, we observed that pharmacological inhibition of CD with pepstatin A (PepA) was sufficient to cause an increase in endogenous α-synuclein, whereas treatment with E64, which inhibits cathepsin B, did not lead to increased levels of α-synuclein. Perturbation of CD function in vivo may be an early step in α-synuclein accumulation-induced pathogenesis, and finding ways to maintain and/or restore CD function may represent a therapeutic strategy in PD and other synucleinopathies.
METHODS
Cell culture
SH-SY5Y cells were maintained in DMEM (Gibco) supplemented with sodium bicarbonate (3.7 g/L) and 10% FBS (Atlanta Biologicals). Pepstatin A (PepA, Sigma) was dissolved in DMSO and diluted in cell culture medium to a final concentration of 10, 50, or 100 μM. E64 (Sigma) was dissolved in DMEM and diluted in cell culture medium to a final concentration of 1, 5, or 10 μM. Cell viability measurements were performed by measuring Calcein AM (Sigma) fluorescence.
Cathepsin D Activity Assay
CD activity measurements were performed using the Cathepsin D activity assay kit (Sigma) following manufacturer’s instructions. Briefly, cells were collected by gentle scraping in culture media. Cells were pelleted by centrifugation at 1000 x g for 5 minutes at 4°C and washed once with PBS before a second centrifugation. MES lysis buffer [20 mM MES pH 6.8, 20 mM NaCl, 1 mM MgCl2, 2 mM EDTA, 10 mM NaH2PO4; protease inhibitor cocktail which does not inhibit aspartyl proteases (Roche) and phosphatase inhibitor (Sigma) (added before use] was added to the pellet, which was then homogenized in 1.5 ml centrifuge tubes with a small pestle. Samples were incubated for 30 minutes on ice following 10 minutes of centrifugation at 500 x g at 4°C. Supernatant was subjected to BCA protein assay (Biorad) and 30 μg of lysate per sample were used for activity readings with and without PepA (2 mg/ml) in a black 96-well plate with clear top and bottom. PepA values were subtracted from non-PepA values to determine CD activity in fluorescence units (FLU) which were then normalized to control groups to yield fractional CD activity.
Cathepsin B Activity Assay
Cathepsin B activity was measured using the Cathepsin B Activity Assay Kit (Abnova) following manufacturer’s instructions. Briefly, cells were collected by scraping and centrifugation (1500 x g for 5 minutes at 4°C) and then lysed using cathepsin B cell lysis buffer (kit) with added protease (Roche) and phosphatase (Sigma) inhibitors followed by 30 minutes incubation on ice. Samples were then centrifuged at 15000 x g for 5 minutes. Supernatants were collected for use in the activity assay. After determining protein concentration for each sample using BCA assay (BIORAD), 50 μg of cell lysate were combined with cathepsin B reaction buffer (kit) in a 96-well black plate with clear top and bottom. E64 (Sigma) was used as a negative control to inhibit cathepsin B activity. After addition of a fluorogenic cathepsin B substrate (kit), plate was incubated 2 hours at 37°C before values were obtained in fluorescence units (FLU) which were then normalized to controls and represented as fractional cathepsin B activity.
Construction of lentivirus
Control lentivirus was made with the pLVX-IRES-ZsGreen1 vector (Clontech), which produces zsGreen, a fluorescent protein product. All other lentiviruses were constructed by cloning target genes into the pLVX-Puro vector (Clontech), which contains an ampicillin resistance gene for propagation and selection of the lentiviral plasmid in bacteria, a puromycin resistance gene for the selection of stable transductants, and a CMV promoter to drive gene expression. D295N mutant CD cDNA was generated from PCR mutagenesis from wild type human CD cDNA. Both wild type and D295N mutant CD genes were PCR amplified and cloned into the pLVX-Puro vector using the BstBI and XhoI restriction sites. Sequencing analyses were performed on each lentiviral plasmid to validate target gene insertion and the correct sequence of the product generated from the template. pLVX-wtCD, -mtCD, or –zsGreen control plasmid along with helper viral plasmids PLP1, PLP2, and VSVg (Invitrogen) were transfected into HEK293FT cells (Invitrogen) using Polyfect reagent (Qiagen). Cell supernatants containing virus were collected at 48 and 72 hours post-transfection. Virus was concentrated using LentiX Concentrator (Clontech) in order to maximize viral titers. After concentration, viruses were aliquoted to avoid repeated freeze/thaw cycles and stored at −80°C. To determine viral titers, HT1080 cells (ATCC) were infected with serial dilutions of virus from 10−2 to 10−8. Beginning 2 days after transduction, virally infected cells were selected using puromycin (1 μg/ml), fed every 2–3 days, and fixed 10–12 days post-transduction. At that time, viable cells were stained using crystal violet, colonies were counted, and titer was determined by multiplying the number of colonies observed by the viral dilution factor for that well. Our titers were all in the range of 107–109 titering units per ml (TU/ml). The pLVX-IRES-ZsGreen1 vector does not contain a puromycin resistance cassette and so titers were determined by counting the ratio of green cells to total cells four to five days after transduction.
Quantitative real-time PCR analyses
RNA was isolated from cells using TRIzol (Invitrogen) according to the manufacturer’s protocol. 0.5–2 μg of RNA was used to convert to cDNA using iScript™ cDNA Synthesis Kit (Bio-Rad) according to the manufacturer’s protocol. Quantitative real-time PCR was performed with SYBR Green Mastermix (Invitrogen) with the following conditions: 50° 2 minutes, 95°C 10 minutes, 95° 15 seconds, 60°C 1 minute (40 cycles). Real-time quantitative RT-PCR results were normalized against an internal control (GAPDH). Forward (F) and reverse (R) primer sequences for all genes analyzed are as the follows: total CD (F) TTCCCGAGGTGCTCAAGAACTACA, (R) TGTCGAAGACGACTGTGAAGCACT; endogenous CD (F) GCGTCATCCCGGCTATAAG, (R) ATGGACGTGAACTTGTGCAG; CB (F) TGAAGGAGATCATGGCAGAA; (R) ATATCACCGGCTTCATGCTT; α-synuclein (F) TGTAGGCTCCAAAACCAAGG; (R) TGCTCCCTCCACTGTCTTCT; GAPDH (F) GCCAAAAGGGTCATCATCTC, (R) GGCCATCCACAGTCTTCT.
Western blot analysis
SH-SY5Y cell lysates were collected for western blot analysis by scraping cells in RIPA lysis buffer (50 mM Tris, 150 mM NaCl, 2 mM EDTA, 1% Triton X-100, 0.1% SDS, pH to 7.8) containing phosphatase (Sigma) and protease (Roche) cocktail inhibitors. After 30 minutes on ice, samples were centrifuged at 16000 x g for 10 minutes at 4°C. Supernatant was used for BCA assay to determine protein concentrations and varying levels of protein (10 μg–20 μg) per lane were loaded onto 7.5–15% PAGE SDS denaturing gels. Gels were transferred to PVDF membrane (Biorad) to probe for protein levels using one of the following antibodies: rabbit anti-α-synuclein (Santa Cruz), goat anti-cathepsin D (Santa Cruz), rabbit anti-LC3 (Sigma), mouse anti-LAMP-1 (Clone H4A3, Developmental Studies Hybridoma Bank), rat anti-LAMP2 (Clone 1D4B, Developmental Studies Hybridoma Bank), rabbit anti-GAPDH (Cell Signaling). We used the following HRP-conjugated secondary antibodies: goat anti-mouse (Biorad), goat anti-rabbit (Biorad), donkey anti-rat (Jackson ImmunoResearch), and donkey anti-goat (Santa Cruz). To analyze western blot membranes, the AlphaEaseFC imager and software were used.
Flow Cytometry Experiments
To examine potential changes in lysosomal numbers due to CD over expression, we employed the use of flow cytometry to measure fluorescence of Lysotracker Red (Invitrogen), a dye that stains acidic vesicles such as lysosomes. Cells were collected 3 days post-transduction. One negative control well with no virus was treated as the others but no Lysotracker dye was added. This control served to determine the fluorescent dye was functional. One more control well was treated with 100 nM BafA1 prior to collection and exposure to Lysotracker. Cells were exposed to 100 nM Lysotracker for 1hr at 37°C. Immediately afterward, cells were trypsinized, pelleted, and resuspended in PBS. All measurements were performed in a LSR II flow cytometer (BD).
Proteasome activity assays
We analyzed the proteasome activities using 40 μg of whole cell lysates modified from our previous protocols (Qiao et al. 2008). Briefly, the assay buffer consists of 50 mM Tris (pH7.5), 2.5 mM EGTA, 20% glycerol, 1 mM DTT, 0.05% NP-40, and 50 μM substrate. MG132 was used at a final concentration of 200 μM to block proteasome activities as negative controls. Fluorescence was measured at 5 min intervals for 2 h, at an excitation wavelength of 380 nm and an emission wavelength of 460 nM. Assays were done in triplicate.
CD siRNA knockdown
Cathepsin D (CD) and Non-targeting siRNA were obtained from Dharmacon (Thermo Scientific). Transfection of siRNA was performed using the Amaxa Cell Line Nucleofector Kit V (Lonza). Briefly, 1.5x10⁶ SH-SY5Y cells were suspended in 100 μl of Nucleofector Solution V. CD and Non-target siRNA were then added at a final concentration of 750 nM. Suspended cells were then placed in the cuvette, electroporated, and added to 500 μl of DMEM with 10% FBS, and then 100 μl of the cell suspension was added to each well of a 6-well plate. At 24 hours, media was changed to fresh DMEM with 10% FBS. Cells were collected at 72 hours and processed for western blot analyses.
Statistical Analysis
All data are normalized to control values and were analyzed using one and two way analysis of variance (ANOVA) and Tukey’s HSD test. Data with a p-value less than 0.05 was considered statistically significant. Experiments had a minimum of n=3 for each group. Independent experiments were performed at least two times to verify results. Data from independent experiments was pooled after an analysis was performed to test for significance between experimental (differences between individual experiments) and interaction (experimental interaction with treatment) terms. If there was no significant difference for the experiment effect and no significant interaction with treatment, independent experiments were pooled for analysis.
RESULTS
Lentiviral delivery of wildtype and mutant CD in SH-SY5Y cells
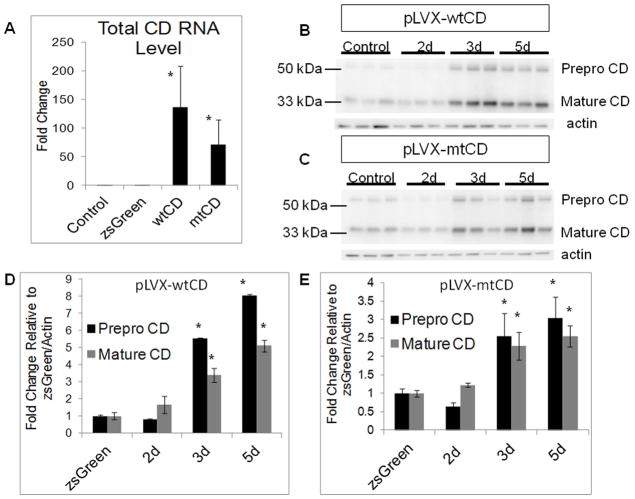
SH-SY5Y cells were transduced with pLVX-zsGreen, and transduction efficiencies were estimated to be ~70% at 3 and 5 days post-transduction based on percentage of cells with green fluorescence signal (Supplemental Fig. 1A). To test for toxicity in response to either the virus or CD over expression, we transduced SH-SY5Y cells with pLVX empty vector, pLVX-wtCD, or pLVX-mtCD D295N, with varying multiplicities of infection (MOI) from 0–50. No decrease in cell viability was observed in response to any virus at any MOI up through 3 days post-transduction (Supplemental Fig. 1B). Transduction with pLVX-wtCD or pLVX-mtCD D295N, but not pLVX-zsGreen, results in significantly elevated CD mRNA (Fig. 1A) and protein levels (Fig. 1B–E) 3–5 days post-transduction. The increased levels of wild type or mutant CD does not negatively affect cell viability up to three days post-transduction (Supplemental Fig. 1B).
Figure 1. Increased CD mRNA and protein in SH-SY5Y cells transduced with lentivirus expressing either wild type or D295N mutant CD.
A. RT-PCR of total CD transcripts in response to zsGreen, wild type CD, and D295N mutant CD lentivirus transduction 3d post-transduction versus control (non-transduced) cells. Shown is fold increase compared to control. Data = mean ± SEM (*p<0.05 control = zsGreen < wtCD = mtCD). B–C. Western blot showing CD levels after lentiviral infection with pLVX-zsGreen (control, B and C, 3 d after infection), pLVX-wtCD (B), or pLVX-mtCD (C) 2d, 3d, and 5d post-transduction. D. Quantification of western blot for pLVX-wtCD from panel B. Data = mean ± SEM (*p<0.001 zsGreen = 2d < 3d < 5d). E. Quantification of western blot for pLVX-mtCD from panel C. Data = mean ± SEM (*p<0.001 zsGreen = 2d < 3d = 5d). Each panel was a summary from experiments performed with cells from 3 independent transductions of each construct.
Effects of wildtype and D295N mutant CD on levels of endogenous α-synuclein
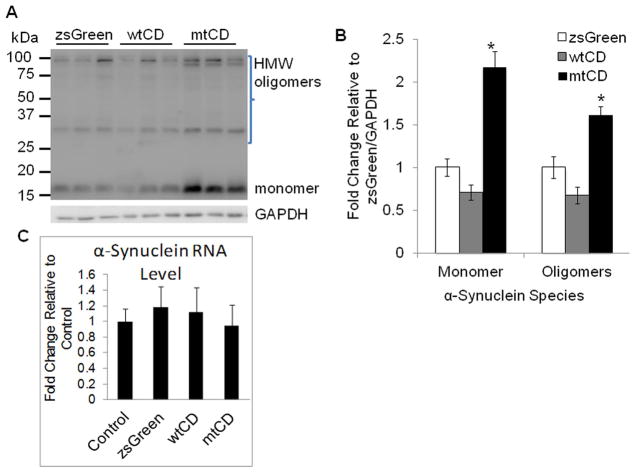
To determine the effects of over expressing wtCD and mtCD D295N on endogenous α-synuclein, we performed western blot analyses 3 days after transduction with pLVX-zsGreen, pLVX-wtCD, or pLVX-mtCD D295N. As shown in Fig. 2A–B, steady state levels of endogenous α-synuclein protein are unchanged in cells expressing pLVX-wtCD. However, in cells over expressing the catalytically inactive mutant CD D295N, endogenous α-synuclein protein levels are significantly increased (Fig. 2A–B). The changes in α-synuclein protein level are not due to an increased mRNA levels, as α-synuclein mRNA levels are unchanged by pLVX-mtCD D295N or pLVX-wtCD, as assessed by quantitative RT-PCR analyses (Fig. 2C).
Figure 2. Levels of endogenous α-synuclein in cells over expressing wild type or D295N mutant CD.
A. Western blot for α-synuclein levels in response to wild type and D295N mutant CD compared to zsGreen control. B. Corresponding quantification of band intensities. Data = mean ± SEM. (*p<0.05 zsGreen < mtCD). C. α-Synuclein mRNA level is unchanged by pLVX-mtCD D295N or pLVX-wtCD (_p_>0.05 for all comparisons). The experiments were performed with cells from 3 independent transductions of each construct. All extracts were collected 3d post-transduction.
Knockdown of Cathepsin D did not change α-synuclein levels
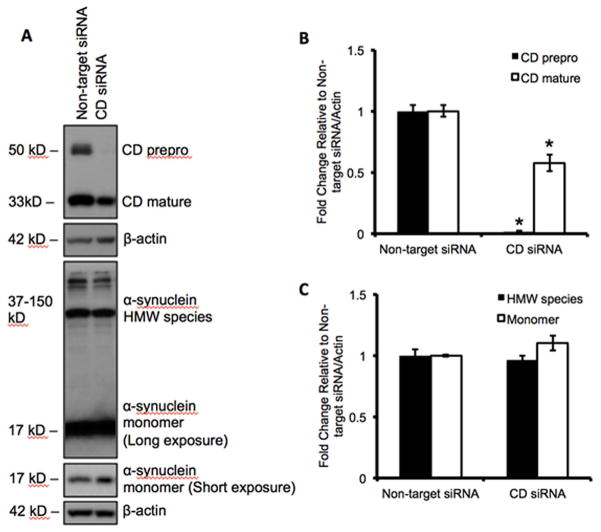
To determine if knockdown of endogenous cathepsin D had a similar effect on α-synuclein levels as mutant CD D295N, we transfected the SH-SY5Y cells with CD siRNA. We found that the prepro form of CD was completely knocked down, whereas the mature form of CD was decreased by ~50% as compared to a non-targeting siRNA control (Figure 3A–B). Interestingly, neither the oligomeric nor the monomeric forms of α-synuclein were significantly changed (Figure 3C).
Figure 3. Knockdown of cathepsin D did not affect alpha-synuclein levels.
A. Western blot for prepro CD, mature CD, and α-synuclein levels following transfection with either 750 nM non-targeting or CD siRNA. B. Corresponding quantification of CD band intensities. Data = mean ± SEM. (*p<0.05 comparing CDsiRNA to non-target siRNA). C. Corresponding quantification of α-synuclein band intensities. Data = mean ± SEM. (*p<0.05 comparing CDsiRNA to non-target siRNA). All extracts were collected 3d post-transfection.
Exogenous mutant CD D295N overexpression results in decreased activity of endogenous CD
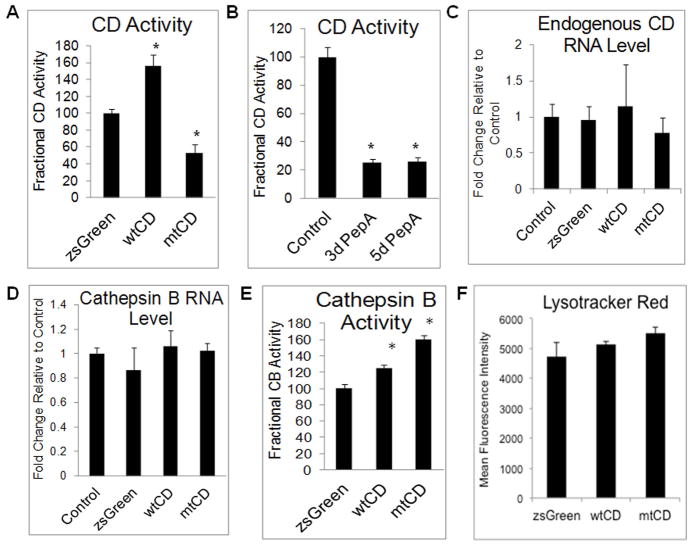
To determine the mechanism of increased α-synuclein by exogenously expressed mutant CD, we examined overall CD activity. Extracts were prepared from SH-SY5Y control cells, or cells transduced with pLVX-zsGreen, pLVX-wtCD, or pLVX-mtCD D295N. As expected, transduction with zsGreen at 2, 3, or 5 d post-transduction did not affect levels of mature CD (Supplemental Fig. 2A–B), or overall CD activity compared to non-transduced cells (Supplemental Fig. 2C). Transduction with wtCD caused a significant increase in total CD activity, p<0.001 pLVX-zsGreen < pLVX-wtCD (Fig. 4A). In contrast, cells that were transduced with pLVX-mtCD D295N showed a marked decrease in total CD activity, p<0.001 pLVX-mtCD < pLVX-zsGreen (Fig. 4A). The activity of mtCD D295N is negligible (Glondu et al. 2001), and so the decrease in CD activity seen in response to over expression of the mutant CD is a result of decreased activity in the endogenous CD protein. Decreases in CD activity after transduction with pLVX-mtCD were not as profound as the level of inhibition seen after pharmacological inhibition of CD with 100 μM of PepA for 3 and 5d, p<0.001 control<3d=5d PepA treatment (~50% in mtCD expressing cells versus ~22% in cells treated with PepA) (Fig. 4B). No cell death was observed in any of the transduction or pharmacological inhibition experiments, as assessed by Calcein AM assay (data not shown). To determine whether the expression of endogenous CD changed in response to transduction with pLVX-zsGreen, pLVX-wtCD, or pLVX-mtCD D295N, we used a primer sequence which is part of the promoter region of the endogenous CD gene, and not present in the lentiviral CD genes to perform real-time quantitative RT-PCR analyses. Neither zsGreen, nor wtCD, or mtCD expressing cells appeared to have altered mRNA expression of endogenous CD (Fig. 4C). Cathepsin B (CB) is another lysosomal protease whose levels are increased in CD-deficient mice (Qiao et al. 2008). We have determined its mRNA expression by real-time quantitative RT-PCR in response to transduction with any of the lentiviral constructs after 3 days. As shown in Fig. 4D, CB mRNA levels are unchanged after lentiviral transduction. Interestingly, we observed a significant increase in CB activity in response to both pLVX-wtCD and pLVX-mtCD D295N (Fig. 4E), with the mutant CD causing the greatest increase in endogenous CB activity, significantly greater than both pLVX-zsGreen and pLVX-wtCD treatment groups, p<0.001 pLVX-zsGreen < pLVX-wtCD < pLVX-mtCD D295N. In order to determine whether an increasing CD protein level and a change in CD and CB activities resulted in any global changes to the lysosomes, we next examined total lysosomal numbers. Flow cytometry experiments indicated that there is no apparent change of total lysosomal number as measured by LysoTracker intensity (Fig. 4F).
Figure 4. CD and CB activities in cells over expressing wild type or D295N mutant CD.
A. CD activity is significantly elevated in response to wtCD and dramatically reduced in response to D295N mutant CD over expression. Data = mean ± SEM (*p<0.001 mtCD < zsGreen < wtCD). B. 100 μM PepA treatment in non-transduced cells causes a marked decrease in endogenous CD activity at 3d and 5d. Data = mean ± SEM. (*_p_<0.001 3d PepA = 5d PepA < control). C. RT-PCR of endogenous CD shows no statistically significant changes in response to any of the lentiviruses. Data = mean ± SEM (_p_>0.05 for all comparisons). D. Cathepsin B mRNA levels are unaffected by transduction with pLVX-zsGreen, pLVX-wtCD, or pLVX-mtCD. Data= mean ± SEM (_p_>0.05 for all comparisons). E. Cathepsin B activity is increased in response to wtCD but even more so in response to mtCD. Data = mean ± SEM (*p<0.001 zsGreen < wtCD < mtCD). F. Flow cytometry analyses of LysoTracker Red staining in zsGreen, wtCD and mtCD transduced cells. Quantification shows no significant difference among these extracts. Each panel was a summary from experiments performed with cells from 3 independent transductions of each construct.
Effects of Exogenous CD Expression on Other Autophagy-Lysosomal Proteins
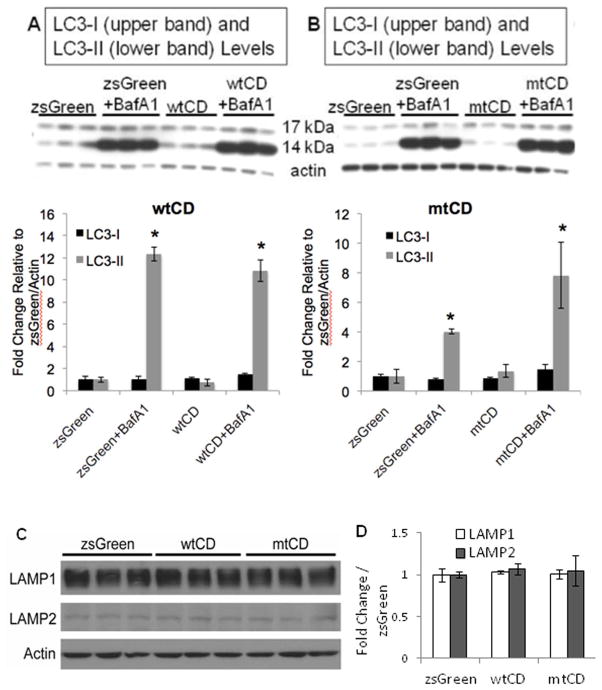
Because CD is an integral component of the lysosomal milieu (Yang and Klionsky 2010), we wanted to assess whether increasing levels of wildtype or mutant CD caused changes to autophagic flux, as well as key proteins in the autophagy-lysosomal pathway. By western blot analyses, we found that neither LC3-I nor LC3-II levels are significantly changed in wtCD or mtCD over expressing cells (Fig. 5A–B). Using bafilomycin A1 (BafA1), an inhibitor of the vacuolar H(+)-ATPase on the lysosomal membrane (Yamamoto et al. 1998), we tested whether autophagic flux differed between wtCD and mtCD expressing cells. BafA1 binds the ATPase, thereby inhibiting fusion of autophagosomes with lysosomes and causing buildup of LC3-II levels (Yamamoto et al. 1998). Treatment with 10 nM BafA1 for 24 hours resulted in the expected increase in LC3-II levels in pLVX-zsGreen-, pLVX-wtCD-, and pLVX-mtCD-transduced cells, p<0.001 zsGreen vs. zsGreen+BafA1, wtCD vs. wtCD+BafA1, and mtCD vs. mtCD+BafA1 groups (Fig. 5A–B). LC3-II accumulation appeared similar in response to BafA1 in cells over expressing either wtCD or mtCD compared to zsGreen control, *p>0.05 for all +BafA1 comparisons (Fig. 5A–B).
Figure 5. Autophagic flux analyses in cells over expressing wild type or D295N mutant CD.
A–B. LC3 western blot after treatment of zsGreen (control, A and B), wtCD (A), and mtCD (B) with and without 10 nM BafA1 for 24 hr. Quantification of LC3-I and LC3-II in response to wtCD (A, lower panel) and mtCD (B, lower panel) shows LC3-II is significantly increased in response to addition of BafA1. Data = mean ± SEM. (*p<0.001 zsGreen = wtCD < zsGreen+Baf = wtCD+Baf and *p<0.001 zsGreen = mtCD < zsGreen+BafA1 = mtCD+BafA1). C. Western blot analyses of LAMP-1 and LAMP-2 in lysates from zsGreen, wtCD and mtCD transduced cells. D. Quantification of (C) shows no significant difference among these extracts. Each panel was a summary from experiments performed with cells from 3 independent transductions of each construct.
To further examine how wtCD and mtCD may impact the lysosome, we examined both LAMP1 and LAMP2 expression. Increases in LAMP1, a lysosomal membrane protein, can be indicative of lysosomal biogenesis (Eskelinen 2006) and possible increases in lysosomal-mediated protein clearance. LAMP2 is involved in chaperone-mediated autophagy, which has also been described to play a role in the degradation of α-synuclein (Cuervo et al. 2004; Mak et al. 2010). In our system, we did not observe significant changes in LAMP1 protein levels in response to CD over expression (Fig. 5C–D). Similarly, we did not detect any difference in LAMP2 protein levels, when we over expressed the wtCD or the mtCD (*p>0.05 wtCD or mtCD versus control 5C–D). Together, these data indicate that there are no obvious compensatory adaptations in the levels of LAMP1 or LAMP2 in response to exogenous wt or mtCD overexpression.
Pepstatin A-Induced Inhibition of Endogenous CD Activity, but not E64-Induced Inhibition of Endogenous CB Activity, also leads to accumulation of α-Synuclein
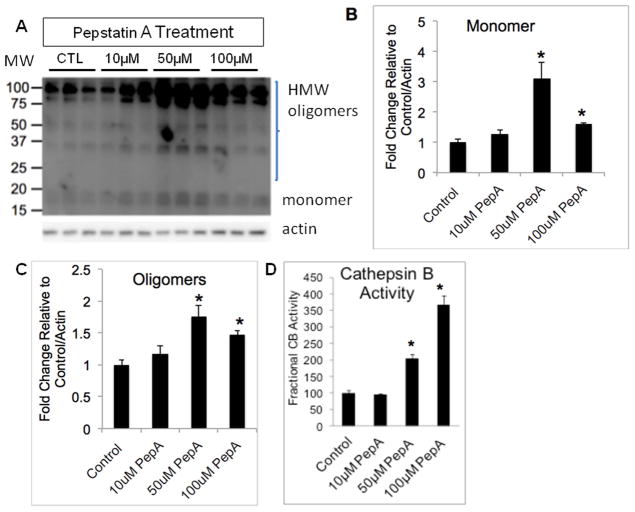
We used pepstatin A (PepA), a pharmacological inhibitor of CD, to test whether inhibition alone is sufficient to cause α-synuclein accumulation. As previously mentioned, 100 μM PepA for 3 days resulted in a significant inhibition of CD activity (Fig. 4B); the same dose of PepA also caused increased α-synuclein protein levels (Fig. 6A–C). α-Synuclein levels increased the highest in response to 50 μM rather than 100 μM PepA, this may be due to the high concentration of PepA resulting in off-target effects. This finding suggests that at least one mechanism by which mtCD D295N and PepA are causing α-synuclein accumulation is through inhibition of CD activity, but this does not preclude the possibility that mtCD D295N may also act through other mechanisms. Interestingly, we also observed a dose-dependent increase in CB activity in response to PepA-induced inhibition of CD activity, p<0.01 control= 10 μM < 50 μM < 100 μM (Fig. 6D), as was observed with the mtCD (Fig. 4E). Cell viability was determined for all concentrations and time points of PepA used in our studies to determine that no toxicity resulted from our treatments (data not shown).
Figure 6. Pepstatin A-induced inhibition of CD activity leads to similar cellular changes as does transduction with pLVX-mtCD.
A. Western blot showing α-synuclein levels in response to control, 10μM, 50μM, and 100μM PepA. B. Quantification of monomeric α-synuclein (shown in panel A). Data = mean ± SEM. (*p<0.05 control = 10 μM < 50 μM = 100 μM). C. Quantification of α-synuclein HMW species (shown in panel A). Data = mean ± SEM. (**p<0.001 control = 10 μM < 50 μM; *p<0.05 control = 10 μM < 100 μM; #p<0.05 100 μM < 50 μM). D. Cathepsin B activity is increased in a dose-dependent fashion in response to PepA-induced CD inhibition. Data = mean ± SEM. (*p<0.01 control = 10 μM < 50 μM < 100 μM).
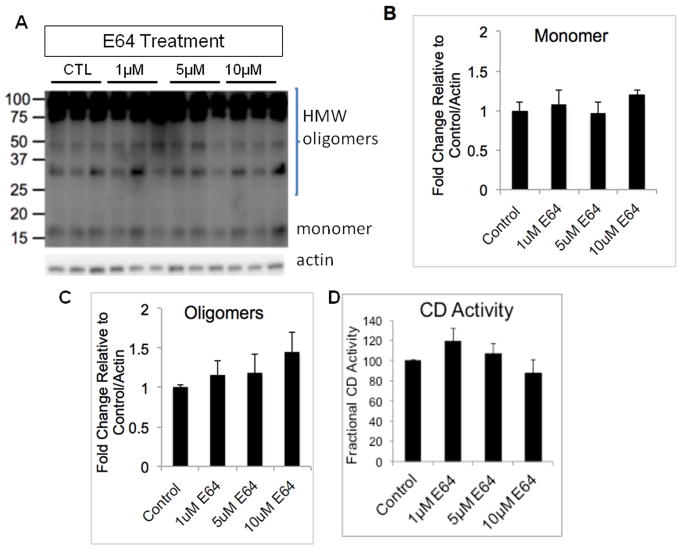
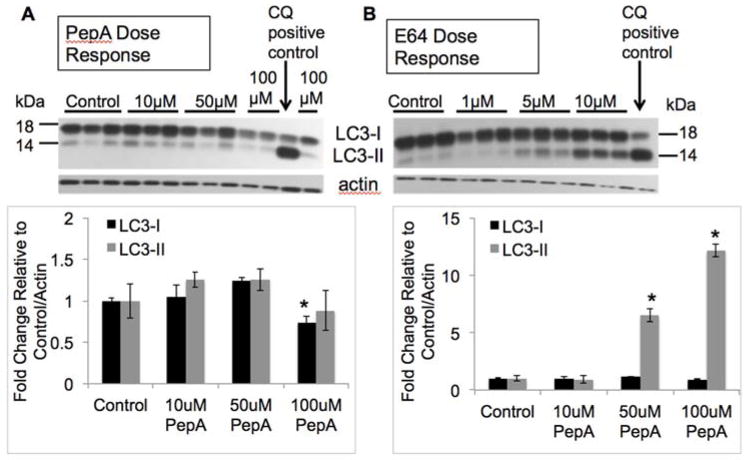
To determine whether α-synuclein accumulation in response to mtCD over expression or PepA inhibition is due to a specific property of CD function, rather than due to a non-specific deficit of lysosomal proteases, we also measured α-synuclein levels in response to E64 treatment. E64 is a cysteine protease inhibitor which inhibits cathepsins B, H, and L (Barrett et al. 1982). We found that α-synuclein levels were unaffected by E64 treatment (Fig. 7A–C). Suppression of CB activity with E64 did not result in any corresponding increases in CD activity (Fig. 7D). None of our E64 doses/time points negatively affected cell viability (data not shown). Interestingly, PepA did not have a significant effect on levels of LC3-II (Fig. 8A). In contrast, treatment with E64 resulted in a dose-dependent increase in LC3-II levels, *p<0.05 control = 1 μM < 5 μM < 10 μM (Fig. 8B). This observation is consistent with a lack of effect of wildtype or mtCD on autophagic flux.
Figure 7. Cathepsin B inhibition by E64 does not lead to α-synuclein accumulation.
A. Western blot for α-synuclein levels following 1 μM, 5 μM, or 10 μM E64 treatment for 3d compared to control group. Quantification shows that α-synuclein levels are not significantly changed by any dose of E64 in the monomeric (B), or HMW (C) forms. (_p_>0.05 for all comparisons). D. CD activity level is not altered in response to E64-induced cathepsin B inhibition. (_p_>0.05 for all comparisons).
Figure 8. E64 but not PepA Treatment Results in a Dose-Dependent Increase in LC3-II Levels.
A. Western blot of LC3 levels in response to PepA. Lower panel shows quantification. Data = mean ± SEM (*p<0.001 for LC3-I 100μM < all others). B. Western blot of LC3 levels in response to E64. Lower panel shows quantifications. Data = mean ± SEM (*p<0.001 for LC3-II control = 1 μM < 5 μM < 10 μM). Chloroquine (CQ) treatment was used as a positive control. Each panel was a summary from experiments performed with cells from 3 independent drug treatments.
Caspase-like and chymotrypsin-like proteasomal activities are similarly increased in wtCD or mtCD over expressing cells compared to controls
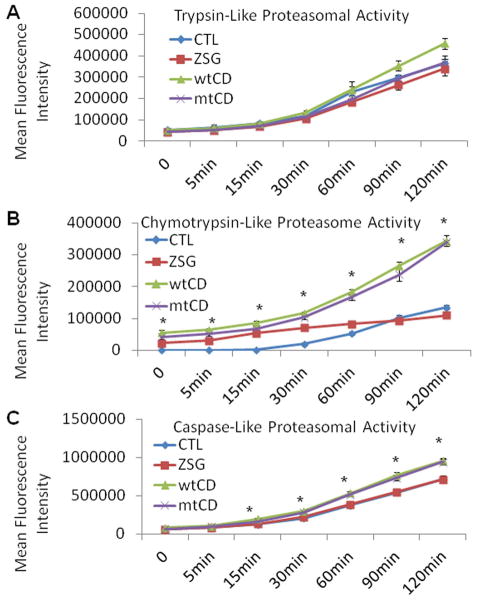
Because the autophagy-lysosomal and ubiquitin proteasome pathways have mutual influence over their respective activities (Qiao et al. 2008; Lamark and Johansen 2010), we examined whether proteasomal activities are changed in response to CD over expression. As shown in Fig. 9A, trypsin-like activities were unchanged by wt or mtCD over expression. Both chymotrypsin-like and caspase-like activities were significantly increased by either wtCD or mtCD over expression compared to controls (Fig. 9B–C). There were no significant differences between wtCD and mtCD with respect to their effects on proteasomal activity.
Figure 9. Proteasomal activities in cells over expressing wild type or D295N mutant CD.
Trypsin-like (A), chymotrypsin-like (B), and caspase-like (C) proteasomal activities in lysates from non-transduced, pLVX-zsGreen, pLVX-wtCD and p-LVX-mtCD transduced cells. Fluorescent products were monitored at 0, 5, 15, 30, 60, 90, and 120 min. A. Trypsin-like proteasome activity was not significantly different as a result of increased CD expression and activity. Data = mean ± SEM (p>0.05 for all comparisons). B. Chymotrypsin-like activity was significantly greater in wtCD and mtCD samples than in zsGreen and non-transduced controls. Data = mean ± SEM (*p<0.001 CTL=zsGreen < wtCD = mtCD). C. Caspase-like activity was also greater in both wtCD and mtCD over expressing cells beginning at 15 min and continuing through the last measured time point (120 min). Data = mean ± SEM (*p<0.001 CTL = zsGreen < wtCD = mtCD). Each panel was a summary from experiments performed with cells from 3 independent transductions of each virus.
DISCUSSION
We have shown that lentiviral expression of wt and D295N CD supported over expression of mature CD protein. WT CD and siRNA knockdown of CD levels did not change the endogenous α-synuclein levels, whereas an enzymatically inactive D295N mutant CD led to significant accumulation of endogenous α-synuclein. This highlights a potential key difference between knock-down of wtCD versus over expression of mtCD which may aberrantly affect function of the wtCD. α-synuclein protein is in low abundance in SH-SY5Y cells, and at this level may be degradable by the proteasomal pathway. We and others have shown that wild type CD is capable of reducing α-synuclein levels and aggregation both in vitro and in vivo in systems where α-synuclein is over expressed (Qiao et al. 2008; Cullen et al. 2009). It is likely that α-synuclein must reach a critical threshold within the cell before being recognized and cleared by the autophagic machinery and, degraded by CD in the lysosome. Although needing to be validated in vivo, the minimum impact of wtCD on endogenous α-synuclein is important for therapeutic considerations, since ideally we would want to preserve normal α-synuclein level but decrease the over-abundant α-synuclein.
One mechanism through which mtCD led to increased endogenous α-synuclein is the corresponding decrease of total CD catalytic activity. Potential mechanisms include decreased translation, trafficking or maturation of wtCD protein, or mtCD dimerization with wtCD thus inhibiting its activities. Further, considering siRNA of endogenous wtCD decreased its level to 50% but did not change endogenous α-synuclein level, mtCD may have indirectly effect on other cellular functions. These mechanisms are potentially complex and will need to be clarified in future studies. Decreased CD activity is accompanied by an increase in cathepsin B activity; however, increased cathepsin B activity is not compensatory and does not decrease α-synuclein levels. Previous studies have shown that even though mtCD D295N is processed and transported to the lysosome in the same manner as wild type CD (Partanen et al. 2003), its activity is less than one percent of the wild type enzyme (Tyynela et al. 2000). Because the known CD substrate α-synuclein was increased in response to mtCD, it is possible that the mtCD protein may be interacting with or binding to α-synuclein to inhibit its degradation by endogenous CD. However, this is unlikely to be the case, since we have performed co-immunoprecipitation experiments and failed to detect an interaction of mtCD with α-synuclein (data not shown).
CD activity is clearly important since 50 μM PepA caused a similar increase in α-synuclein levels as mtCD over expression. PepA at 100 μM led to less of an increase in α-synuclein levels than mtCD over expression, despite PepA causing a greater inhibition of CD activity than mtCD over expression. This suggests that 100 μM PepA has off-target effects. Interestingly, siRNA knockdown of CD had no effect on α-synuclein levels, this may be due to the remaining 50% of mature CD after siRNA transfection being in the right location to degrade α-synuclein. Other enzymes have been implicated in α-synuclein degradation, including calpain (Mishizen-Eberz et al. 2003) and neurosin (Iwata et al. 2003). It is possible that the activities of these or other enzymes may be differentially affected by mtCD over expression or CD siRNA. Interestingly, we did not observe significant changes in the autophagy-lysosomal pathway in response to overexpression of wildtype or mtCD. This observation suggests that autophagosomal activities and lysosomal biogenesis are relatively independent of cathepsin activities. The only exception is cathepsin B activity which is increased by the overexpression of either wildtype or mtCD. Finally, we observed that proteasomal activity was increased in cells over expressing wtCD or mtCD, indicating that the accumulation of endogenous α-synuclein in mtCD over expressing cells is not due to a decrease of proteasomal activity.
It is unclear however, why chymotrypsin-like and caspase-like activities were increased in response to the over expression of either wild type or catalytically inactive CD mutant. Our previous studies demonstrated that loss of CD results in decreased levels of proteasomal activity in the CD-deficient mouse model (Qiao and Zhang 2009). This may be due to a complete loss of CD and a massive accumulation of un-processed autophagosomes in the CD deficient mouse brains that overwhelmed the proteasome system at postnatal day 25. In comparison, ~50% of endogenous CD activity is still present in the cultured cells 3 days post-transduction of lentivirus over expressing mtCD. Thus, the accumulation of α-synuclein under this condition is not as pronounced as in vivo.
Taken together, our results further demonstrate that CD activity is essential for the metabolism of α-synuclein. Increased CD activity does not impact endogenous α-synuclein levels, autophagic flux, or lysosomal number, whereas decreased CD activity resulted in dramatic accumulation of α-synuclein protein without changing autophagic flux or lysosomal number. An associated increase of CB and proteasomal activities occurs in response to either wildtype or mtCD, but is not sufficient to compensate for the decrease in CD activity. In diseases such as PD, CD dysfunction may be a precipitating event in the development of synucleinopathy. Exploring strategies to increase or maintain CD enzymatic activity in the brain may need to be further investigated as potential therapies to alleviate α-synuclein burden in these devastating disorders.
Supplementary Material
Supp Fig S1-S2
Acknowledgments
We are grateful to Dr. Aimee Landar, Ms. Stephanie Wall, Victor Darley-Usmar and members of the Zhang laboratory for technical help and discussions. This work was supported by Michael J Fox Foundation, NIHR01-NS064090 and a VA merit award (to JZ), NINDSP30-NS047466 (UAB Neuroscience NINDS Protein Interaction Core C), and NIH P30 grant #P30 AR48311 (RDCC-APCC core).
The abbreviations used are
PD
Parkinson’s disease
CD
cathepsin D
wtCD
wild type CD
mtCD
mutant CD
PepA
pepstatin A
Footnotes
Authorship credit: DC, MD, XO, MBG, and QL performed the experiments. MEB helped with cloning and lentivirus preparation. NF performed all the statistics. JZ directed the research. DC, MD and JZ wrote the manuscript. All authors contributed to manuscript revision.
This manuscript contains supplemental figures 1–2
The authors have no conflict of interest to declare.
Reference List
- Alvarez-Erviti L, Rodriguez-Oroz MC, Cooper JM, Caballero C, Ferrer I, Obeso JA, Schapira AH. Chaperone-mediated autophagy markers in Parkinson disease brains. Arch Neurol. 2010;67:1464–1472. doi: 10.1001/archneurol.2010.198. [DOI] [PubMed] [Google Scholar]
- Anglade P, Vyas S, Javoy-Agid F, Herrero MT, Michel PP, Marquez J, Mouatt-Prigent A, Ruberg M, Hirsch EC, Agid Y. Apoptosis and autophagy in nigral neurons of patients with Parkinson’s disease. Histol Histopathol. 1997;12:25–31. [PubMed] [Google Scholar]
- Barrett AJ, Kembhavi AA, Brown MA, Kirschke H, Knight CG, Tamai M, Hanada K. L-trans-Epoxysuccinyl-leucylamido(4-guanidino)butane (E-64) and its analogues as inhibitors of cysteine proteinases including cathepsins B, H and L. Biochem J. 1982;201:189–198. doi: 10.1042/bj2010189. [DOI] [PMC free article] [PubMed] [Google Scholar]
- Chartier-Harlin MC, Kachergus J, Roumier C, Mouroux V, Douay X, Lincoln S, Levecque C, Larvor L, Andrieux J, Hulihan M, Waucquier N, Defebvre L, Amouyel P, Farrer M, Destee A. Alpha-synuclein locus duplication as a cause of familial Parkinson’s disease. Lancet. 2004;364:1167–1169. doi: 10.1016/S0140-6736(04)17103-1. [DOI] [PubMed] [Google Scholar]
- Crews L, Spencer B, Desplats P, Patrick C, Paulino A, Rockenstein E, Hansen L, Adame A, Galasko D, Masliah E. Selective molecular alterations in the autophagy pathway in patients with Lewy body disease and in models of alpha-synucleinopathy. PLoS ONE. 2010;5:e9313. doi: 10.1371/journal.pone.0009313. [DOI] [PMC free article] [PubMed] [Google Scholar] [Retracted]
- Cuervo AM, Stefanis L, Fredenburg R, Lansbury PT, Sulzer D. Impaired degradation of mutant alpha-synuclein by chaperone-mediated autophagy. Science. 2004;305:1292–1295. doi: 10.1126/science.1101738. [DOI] [PubMed] [Google Scholar]
- Cullen V, Lindfors M, Ng J, Paetau A, Swinton E, Kolodziej P, Boston H, Saftig P, Woulfe J, Feany MB, Myllykangas L, Schlossmacher MG, Tyynela J. Cathepsin D expression level affects alpha-synuclein processing, aggregation, and toxicity in vivo. Mol Brain. 2009;2:5. doi: 10.1186/1756-6606-2-5. [DOI] [PMC free article] [PubMed] [Google Scholar]
- Dehay B, Bove J, Rodriguez-Muela N, Perier C, Recasens A, Boya P, Vila M. Pathogenic lysosomal depletion in Parkinson’s disease. J Neurosci. 2010;30:12535–12544. doi: 10.1523/JNEUROSCI.1920-10.2010. [DOI] [PMC free article] [PubMed] [Google Scholar]
- Eskelinen EL. Roles of LAMP-1 and LAMP-2 in lysosome biogenesis and autophagy. Mol Aspects Med. 2006;27:495–502. doi: 10.1016/j.mam.2006.08.005. [DOI] [PubMed] [Google Scholar]
- Geisler S, Holmstrom KM, Treis A, Skujat D, Weber SS, Fiesel FC, Kahle PJ, Springer W. The PINK1/Parkin-mediated mitophagy is compromised by PD-associated mutations. Autophagy. 2010;6:871–878. doi: 10.4161/auto.6.7.13286. [DOI] [PubMed] [Google Scholar]
- Glondu M, Coopman P, Laurent-Matha V, Garcia M, Rochefort H, Liaudet-Coopman E. A mutated cathepsin-D devoid of its catalytic activity stimulates the growth of cancer cells. Oncogene. 2001;20:6920–6929. doi: 10.1038/sj.onc.1204843. [DOI] [PubMed] [Google Scholar]
- Ibanez P, Bonnet AM, Debarges B, Lohmann E, Tison F, Pollak P, Agid Y, Durr A, Brice A. Causal relation between alpha-synuclein gene duplication and familial Parkinson’s disease. Lancet. 2004;364:1169–1171. doi: 10.1016/S0140-6736(04)17104-3. [DOI] [PubMed] [Google Scholar]
- Iwata A, Maruyama M, Akagi T, Hashikawa T, Kanazawa I, Tsuji S, Nukina N. Alpha-synuclein degradation by serine protease neurosin: implication for pathogenesis of synucleinopathies. Hum Mol Genet. 2003;12:2625–2635. doi: 10.1093/hmg/ddg283. [DOI] [PubMed] [Google Scholar]
- Koike M, Nakanishi H, Saftig P, Ezaki J, Isahara K, Ohsawa Y, Schulz-Schaeffer W, Watanabe T, Waguri S, Kametaka S, Shibata M, Yamamoto K, Kominami E, Peters C, von FK, Uchiyama Y. Cathepsin D deficiency induces lysosomal storage with ceroid lipofuscin in mouse CNS neurons. J Neurosci. 2000;20:6898–6906. doi: 10.1523/JNEUROSCI.20-18-06898.2000. [DOI] [PMC free article] [PubMed] [Google Scholar]
- Lamark T, Johansen T. Autophagy: links with the proteasome. Curr Opin Cell Biol. 2010;22:192–198. doi: 10.1016/j.ceb.2009.11.002. [DOI] [PubMed] [Google Scholar]
- Lee J, Giordano S, Zhang J. Autophagy, mitochondria and oxidative stress: cross-talk and redox signalling. Biochem J. 2012;441:523–540. doi: 10.1042/BJ20111451. [DOI] [PMC free article] [PubMed] [Google Scholar]
- Mak SK, McCormack AL, Manning-Bog AB, Cuervo AM, Di Monte DA. Lysosomal degradation of alpha-synuclein in vivo. J Biol Chem. 2010;285:13621–13629. doi: 10.1074/jbc.M109.074617. [DOI] [PMC free article] [PubMed] [Google Scholar]
- Martin I, Dawson VL, Dawson TM. Recent advances in the genetics of Parkinson’s disease. Annu Rev Genomics Hum Genet. 2011;12:301–325. doi: 10.1146/annurev-genom-082410-101440. [DOI] [PMC free article] [PubMed] [Google Scholar]
- Mishizen-Eberz AJ, Guttmann RP, Giasson BI, Day GA, III, Hodara R, Ischiropoulos H, Lee VM, Trojanowski JQ, Lynch DR. Distinct cleavage patterns of normal and pathologic forms of alpha-synuclein by calpain I in vitro. J Neurochem. 2003;86:836–847. doi: 10.1046/j.1471-4159.2003.01878.x. [DOI] [PubMed] [Google Scholar]
- Partanen S, Storch S, Loffler HG, Hasilik A, Tyynela J, Braulke T. A replacement of the active-site aspartic acid residue 293 in mouse cathepsin D affects its intracellular stability, processing and transport in HEK-293 cells. Biochem J. 2003;369:55–62. doi: 10.1042/BJ20021226. [DOI] [PMC free article] [PubMed] [Google Scholar]
- Qiao L, Hamamichi S, Caldwell KA, Caldwell GA, Yacoubian TA, Wilson S, Xie ZL, Speake LD, Parks R, Crabtree D, Liang Q, Crimmins S, Schneider L, Uchiyama Y, Iwatsubo T, Zhou Y, Peng L, Lu Y, Standaert DG, Walls KC, Shacka JJ, Roth KA, Zhang J. Lysosomal enzyme cathepsin D protects against alpha-synuclein aggregation and toxicity. Mol Brain. 2008;1:17. doi: 10.1186/1756-6606-1-17. [DOI] [PMC free article] [PubMed] [Google Scholar]
- Qiao L, Zhang J. Inhibition of lysosomal functions reduces proteasomal activity. Neurosci Lett. 2009;456:15–19. doi: 10.1016/j.neulet.2009.03.085. [DOI] [PubMed] [Google Scholar]
- Schneider L, Zhang J. Lysosomal function in macromolecular homeostasis and bioenergetics in Parkinson’s disease. Mol Neurodegener. 2010;5:14. doi: 10.1186/1750-1326-5-14. [DOI] [PMC free article] [PubMed] [Google Scholar]
- Singleton AB, Farrer M, Johnson J, Singleton A, Hague S, Kachergus J, Hulihan M, Peuralinna T, Dutra A, Nussbaum R, Lincoln S, Crawley A, Hanson M, Maraganore D, Adler C, Cookson MR, Muenter M, Baptista M, Miller D, Blancato J, Hardy J, Gwinn-Hardy K. alpha-Synuclein locus triplication causes Parkinson’s disease. Science. 2003;302:841. doi: 10.1126/science.1090278. [DOI] [PubMed] [Google Scholar]
- Tyynela J, Sohar I, Sleat DE, Gin RM, Donnelly RJ, Baumann M, Haltia M, Lobel P. A mutation in the ovine cathepsin D gene causes a congenital lysosomal storage disease with profound neurodegeneration. EMBO J. 2000;19:2786–2792. doi: 10.1093/emboj/19.12.2786. [DOI] [PMC free article] [PubMed] [Google Scholar]
- Vekrellis K, Stefanis L. Targeting intracellular and extracellular alpha-synuclein as a therapeutic strategy in Parkinson’s disease and other synucleinopathies. Expert Opin Ther Targets. 2012;16:421–432. doi: 10.1517/14728222.2012.674111. [DOI] [PubMed] [Google Scholar]
- Vogiatzi T, Xilouri M, Vekrellis K, Stefanis L. Wild type alpha-synuclein is degraded by chaperone-mediated autophagy and macroautophagy in neuronal cells. J Biol Chem. 2008;283:23542–23556. doi: 10.1074/jbc.M801992200. [DOI] [PMC free article] [PubMed] [Google Scholar]
- Webb JL, Ravikumar B, Atkins J, Skepper JN, Rubinsztein DC. Alpha-Synuclein is degraded by both autophagy and the proteasome. J Biol Chem. 2003;278:25009–25013. doi: 10.1074/jbc.M300227200. [DOI] [PubMed] [Google Scholar]
- Winslow AR, Chen CW, Corrochano S, cevedo-Arozena A, Gordon DE, Peden AA, Lichtenberg M, Menzies FM, Ravikumar B, Imarisio S, Brown S, O’Kane CJ, Rubinsztein DC. alpha-Synuclein impairs macroautophagy: implications for Parkinson’s disease. J Cell Biol. 2010;190:1023–1037. doi: 10.1083/jcb.201003122. [DOI] [PMC free article] [PubMed] [Google Scholar]
- Yamamoto A, Tagawa Y, Yoshimori T, Moriyama Y, Masaki R, Tashiro Y. Bafilomycin A1 prevents maturation of autophagic vacuoles by inhibiting fusion between autophagosomes and lysosomes in rat hepatoma cell line, H-4-II-E cells. Cell Struct Funct. 1998;23:33–42. doi: 10.1247/csf.23.33. [DOI] [PubMed] [Google Scholar]
- Yang Z, Klionsky DJ. Eaten alive: a history of macroautophagy. Nat Cell Biol. 2010;12:814–822. doi: 10.1038/ncb0910-814. [DOI] [PMC free article] [PubMed] [Google Scholar]
Associated Data
This section collects any data citations, data availability statements, or supplementary materials included in this article.
Supplementary Materials
Supp Fig S1-S2
