A model of breast cancer heterogeneity reveals vascular mimicry as a driver of metastasis (original) (raw)
. Author manuscript; available in PMC: 2015 Nov 5.
Published in final edited form as: Nature. 2015 Apr 8;520(7547):358–362. doi: 10.1038/nature14403
Abstract
Cancer metastasis requires that primary tumour cells evolve the capacity to intravasate into the lymphatic system or vasculature, and extravasate into and colonize secondary sites1. Others have demonstrated that individual cells within complex populations show heterogeneity in their capacity to form secondary lesions2–5. Here we develop a polyclonal mouse model of breast tumour heterogeneity, and show that distinct clones within a mixed population display specialization, for example, dominating the primary tumour, contributing to metastatic populations, or showing tropism for entering the lymphatic or vasculature systems. We correlate these stable properties to distinct gene expression profiles. Those clones that efficiently enter the vasculature express two secreted proteins, Serpine2 and Slpi, which were necessary and sufficient to program these cells for vascular mimicry. Our data indicate that these proteins not only drive the formation of extra-vascular networks but also ensure their perfusion by acting as anticoagulants. We propose that vascular mimicry drives the ability of some breast tumour cells to contribute to distant metastases while simultaneously satisfying a critical need of the primary tumour to be fed by the vasculature. Enforced expression of SERPINE2 and SLPI in human breast cancer cell lines also programmed them for vascular mimicry, and SERPINE2 and SLPI were overexpressed preferentially in human patients that had lung-metastatic relapse. Thus, these two secreted proteins, and the phenotype they promote, may be broadly relevant as drivers of metastatic progression in human cancer.
Until now, the most detailed studies of tumour heterogeneity have been retrospective6–9. For example, single cell analyses of human breast tumours have illustrated evolutionary paths of genetic diversification9. In such cases, genetic variation could not be associated with differences in the behaviour and capabilities of clonal populations and their specific contributions to disease. We therefore wished to complement such studies by creating an experimental model of tumour heterogeneity.
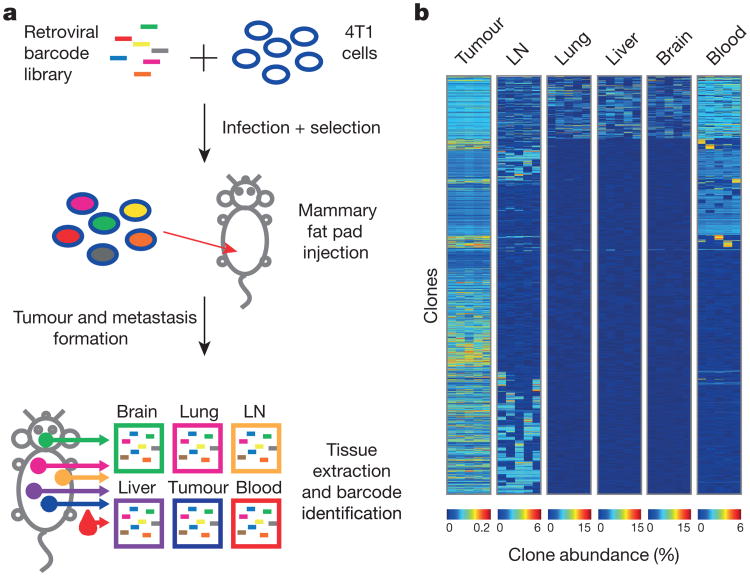
To this end, we marked individual mouse mammary carcinoma 4T1 cells with a molecular barcode via retroviral infection (Fig. 1a and Extended Data Fig. 1a). We drew from a complex mixture five different cohorts of 100,000 cells each, and introduced these orthotopically into immunocompromised recipients (NOD-SCID-_Il2rg_−/− (NSG) mice). After 24 days, primary tumours, brachial lymph nodes, blood, lungs, livers and brains were collected, and the barcode populations within each tissue were quantified (Fig. 1b and Extended Data Fig. 1f). We asked whether the subset of clones that engrafted in all samples (∼1,400 clones) showed consistent behaviour in terms of contributions to aspects of disease progression across all five experiments.
Figure 1. Clonal analysis of 4T1 transplantation by molecular barcoding.
a, Retroviral barcoding strategy for identifying clonal populations within the 4T1 cell line. b, Relative proportions of clones that engrafted in all animals in the lymph node (LN), lung, liver, brain and blood. Columns represent independent experiments (n = 5 mice). Shown are the ∼1,400 clones that successfully engrafted in all animals.
Two conclusions were drawn from this analysis. First, clone abundance within the primary tumour did not correlate with abundance in circulating tumour cells (CTCs) or secondary lesions. Second, distinct groups of clones contributed to lymph node and blood-borne metastases. Significant overlap existed between abundant clones in the blood-borne metastases and CTCs (Fig. 1b and Extended Data Fig. 1g, P<0.001, hypergeometric test). However, no significant overlap was observed when comparing these sets to the prominent clones in the lymph node (Fig. 1b and Extended Data Fig. 1h). Indeed, others have reported that 20–30% of patients with distant relapse are free of axillary lymph-node metastases10. Thus, clonal populations within the 4T1 cell line reproducibly contribute to different aspects of disease progression.
We wished to understand the properties of these clones, which underlay their differential capabilities. We therefore established 23 clonal lines from another barcoded population (Fig. 2a and Extended Data Figs 1b and 2). All relevant barcode integration sites were mapped to ensure that no known oncogenes or tumour suppressors were altered during the barcoding process (Supplementary Information). The clones spanned a range of in vitro growth rates and cellular morphologies. After minimal propagation, they were pooled and orthotopically injected into NSG mice. In addition, the pool was propagated on adherent culture plates. Primary tumours and aliquots from the in vitro system were removed after 14 and 24 days. In addition, at 24 days, the brachial lymph nodes, blood, lungs, livers and brains were isolated.
Figure 2. Focused analysis of a subset of 4T1 clones throughout metastatic disease progression.
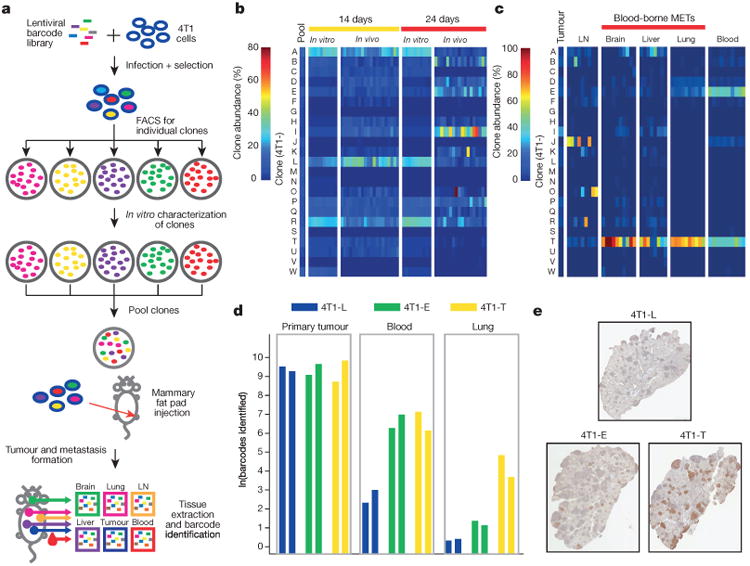
a, Strategy for isolating individual molecularly barcoded 4T1 clones. b, Relative proportions of the clonal lines in vitro and in orthotopic primary tumours at 14 and 24 days (in vitro n =10 cell lines, in vivo n = 18 mice). c, Relative proportions of clonal lines among the vascular CTCs and secondary lesions in lymph node, brain, liver and lungs in animals corresponding to the tumours extracted at 24 days in b (n = 8 mice). d, Subclonal analysis of 4T1-L, 4T1-E and 4T1-T cells via secondary barcode library infection. Clonal lines were separately infected with a second barcode library, pooled with the 22 other lines and then orthotopically injected into two mice. Indicated is the number of clones identifiedin100 bootstrap samplesof1million sequence reads. e, Immunohistochemistry analysis for mCherry in lung metastases resulting from each of the three pooled injections discussed in d. mCherry is expressed in the secondary barcode library. Original magnification, ×20.
At 14 days, the clonal profiles of the in vitro samples and the primary tumours were found to be highly similar (Fig. 2b). However, at 24 days, while the in vitro population maintained its distribution, the primary tumour evolved along a different trajectory with clone 4T1-I dominating. Even when engrafted individually, 4T1-I showed accelerated growth between the 14- and 24-day time points, indicating that this phenotype is not dependent on clonal interactions (Extended Data Fig. 3a).
Examination of metastatic sites and CTCs showed that different clones had different capacities to contribute, and this did not correlate with their abundance in the primary tumour (Fig. 2c). Clones that were relatively less represented in the primary tumour entered the bloodstream and survived as CTCs, and a subset of these had the additional ability to colonize secondary sites. The latter clones differ still from those that colonized lymph nodes. The 4T1-T clone that dominates sites colonized by blood-borne routes was also best at forming lung metastases when injected individually (Extended Data Fig. 3b). Intravasation seemed a key gating step since intracardiac injection of the pool led to an entirely different clonal distribution in CTCs and lung metastases (Extended Data Fig. 3c).
The proclivities of each clonal line were general properties of most of their constituent cells. This was demonstrated by infection of lines 4T1-L, 4T1-E and 4T1-T with secondary, independent barcode libraries containing mCherry, allowing for populations of cells within each line to be monitored at each stage of disease (Fig. 2d and Extended Data Fig. 3d). Each secondarily barcoded line was separately pooled with the remaining lines and injected orthotopically. Similar numbers of subclones were identified for each clonal line within the tumours, indicating that they engraft at comparable rates. A large proportion of the engrafted 4T1-E and 4T1-T subclones were able to contribute to the CTC population. Furthermore, many 4T1-T CTCs were able to extravasate and colonize the lung. The ability of the 4T1-T clone to form lung metastases was confirmed by mCherry staining of lung tissue sections from these experiments (Fig. 2e). Finally, these properties appear to be stable as they remained after the clones had been propagated for more than 20 doublings (Extended Data Fig. 3e).
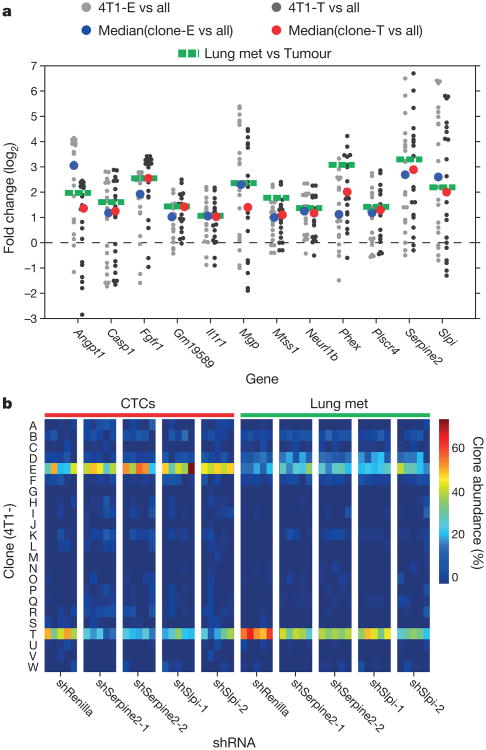
To ascertain the specific drivers of this phenotype, we intersected the set of genes significantly overexpressed in clones 4T1-E and 4T1-T with a set that was found to be upregulated in lung metastases relative to matched primary tumours (Fig. 3a). Expression levels of the resultant 12 candidates were additionally examined in human patients, comparing those that did or did not relapse with lung metastases11. Of the 10 genes with associated patient data, the human orthologues of Serpine2 and Slpi (SERPINE2 and SLPI, respectively) emerged as the most significantly overexpressed in relapsed patients. The 4T1 cell line is used to model aggressive breast cancer subtypes such as basal, Her2 and claudin-low. Notably, it is precisely these tumour types, and not luminal cancers, that show increased SERPINE2 and SLPI expression in patients that relapse (Extended Data Fig. 4a, P<0.005, Wilcoxon rank-sum test for summed expression). Additionally, a hazard analysis determined that amplified expression of these genes was significantly associated with relapse in the lung (P<0.0002, Supplementary Information). Both SERPINE2 and SLPI have been implicated in breast cancer progression, however, Slpi has also been proposed to suppress tumour growth12–16.
Figure 3. Serpine2 and Slpi are regulators of intravasation into the cardiovascular system.
a, Genes upregulated in the intravasating clones 4T1-E and 4T1-T. RNA sequencing (RNA-seq) was performed for all clonal lines (n = 2 per cell line) as well as for two pairs of matched primary tumours and lung metastases. Grey dots represent the fold change of each gene in 4T1-E (light grey) or 4T1-T (dark grey) relative to each of the other clonal lines (the median values are plotted as blue and red dots for 4T1-E and 4T1-T, respectively). The green dotted lines represent the mean fold change in the tumour and lung metastases (met) pairs. b, Relative proportions of clonal lines in the CTCs and lung where 4T1-T has been infected with non-targeting shRNAs and shRNAs targeting Serpine2 and Slpi (P< 0.02, Wilcoxon rank-sum, n = 5 mice).
To validate Serpine2 and Slpi as drivers of metastatic progression, 4T1-T populations were individually infected with two short hairpin RNAs (shRNAs) targeting each gene or with a control shRNA (Extended Data Fig. 1c and Supplementary Information). After orthotopic injection of a pooled collection of the resultant lines, a significant depletion of the Serpine2 and Slpi shRNA expressing cells in CTCs and lung metastases was observed (Extended Data Fig. 4b, P<0.01, Wilcoxon rank-sum). When each shRNA-expressing line was assessed separately in a polyclonal setting, Serpine2- and Slpi-depleted 4T1-T clones were significantly decreased in their contribution to CTCs and lung metastases (Fig. 3b, P<0.02, Wilcoxon rank-sum). Also, a reduction in shRNA-expressing lung nodules was observed after silencing of either gene (Extended Data Fig. 4c, d, P<0.01, Wilcoxon rank-sum). Finally, when Serpine2 and Slpi were silenced in parental 4T1 cells, singly or in combination (Extended Data Fig. 1c, d), significant reductions in lung metastases were observed. Lungs corresponding to single gene knockdowns showed a ∼50% reduction in metastases and those corresponding to double knockdowns showed a ∼60% reduction in secondary lesions (Extended Data Fig. 4e, f, P<0.01 and P<0.005, respectively, Wilcoxon rank-sum).
Thus, Serpine2 and Slpi probably act at the intravasation step, a hypothesis supported by the finding that intracardiac injection rescued the metastatic potential of shRNA-expressing cells (not shown). Notably, a recent study also implicated Serpins, including SERPINE2, in metastasis of breast cancer to the brain17. In this study, knockdown of SERPINE2 did not block metastasis; however, cells were introduced by intracardiac injection, bypassing the requirement for increased SERPINE2 and SLPI expression according to our model.
In tumours derived from 4T1-E or 4T1-T cell lines, we observed an increase in vessels with focal loss of the endothelial cell marker CD31 (not shown). Quantitative analysis of vascular leakiness revealed that vessels within 4T1-T tumours were significantly more leaky than those of parental 4T1 and 4T1-L tumours (Extended Data Fig. 5a, b, P< 0.05, Wilcoxon rank-sum). Finally, silencing of Serpine2 or Slpi in these cells resulted in reduced vascular leakiness (Extended Data Fig. 5c, P<0.03, Wilcoxon rank-sum).
Focal loss of CD31 in vessels and a high degree of tumour leakiness has been associated with a phenomenon termed vascular mimicry, in which tumour cells differentiate into endothelial-like cells and form extracellular-matrix-rich tubular structures to carry blood from the vasculature to hypoxic regions of the tumour18–20. We proposed that the propensity of 4T1-E and 4T1-T cells to intravasate was the result of a heightened capacity for vascular mimicry, placing tumour cells in direct contact with blood.
Analysis of serial sections of tumours derived from mCherry expressing 4T1-T cells revealed vast networks of structures consistent with vascular mimicry (PAS+/CD31− fluid-filled channels lined by mCherry+ tumour cells; Fig. 4a, b and Extended Data Fig. 6a). An equivalent number of PAS+/CD31− channels were identified in 4T1-E-derived tumours. By contrast, a much lower number of such structures were identified in tumours derived from other clones (Fig. 4b). When mCherry-expressing 4T1-T cells were pooled with the remaining clones and injected orthotopically, most tumour cells surrounding the resulting PAS+/CD31− vessels were mCherry-positive (Extended Data Fig. 6b).
Figure 4. Vascular mimicry drives metastatic progression.
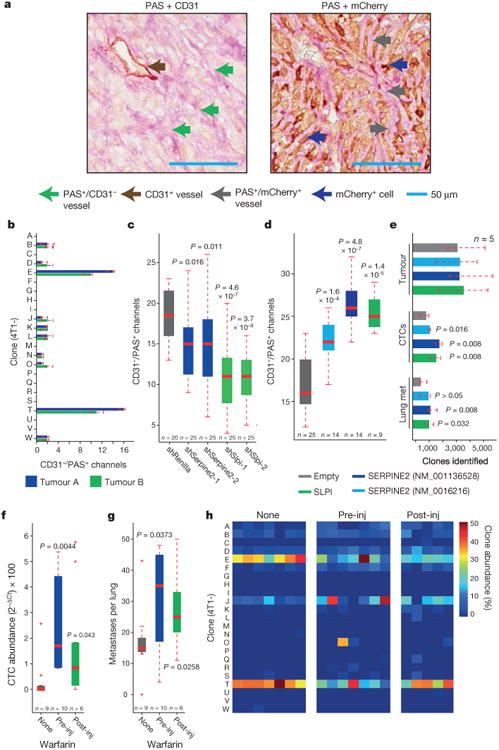
a, Serial sections of a primary tumour derived from 4T1-T cells constitutively expressing mCherry stained with PAS and either CD31 or mCherry. Brown arrow indicates CD31-positive blood vessels, green arrows CD31-negative/PAS-positive channels, blue arrows show mCherry-positive tumour cells, and grey arrows show PAS+ channels lined by mCherry-positive tumour cells. Scale bars, 50μm. b, Quantification of CD31−/PAS+ channels in tumours derived from each clonal line (median of n = 5 fields plotted). c, Quantification of CD31−/PAS+ channels in 4T1-T-derived primary tumours that have been infected with a non-targeting shRNA and shRNAs targeting Serpine2 or Slpi (P < 0.02, Wilcoxon rank-sum, n = 20 fields for shRenilla and n = 25 fields for shSerpine2-1, shSerpine2-2, shSlpi-1 and shSlpi-2). d, Quantification of CD31−/PAS+ channels in MDA-MB-231-derived primary tumours cells that have been infected with an empty vector or vectors for overexpression of SERPINE2 or SLPI (P < 0.0002, Wilcoxon rank-sum, n = 25 fields for empty, n = 14 fields for SERPINE2 (NM_001135528 and NM_0016216) and n = 9 fields for SLPI). e, Sub-clonal analysis of MDA-MB-231 cells that have been infected with an empty vector or vectors for overexpression of SERPINE2 or SLPI (P < 0.04, Wilcoxon rank-sum, n = 5 mice). f, Cardiovascular CTC abundance (measured by qPCR of the barcode vector) in animals injected orthotopically with all 23 clonal lines and administered regular drinking water or water containing 10 mg ml−1 warfarin (P < 0.05, Wilcoxon rank-sum, n = 9, 10 and 6 mice for mice administered no warfarin, warfarin pre-injection and warfarin post-injection, respectively). g, Numbers of lung metastatic nodules identified in the animals described in f (P < 0.04, Wilcoxon rank-sum, n = 9, 10 and 6 mice for mice administered no warfarin, warfarin pre-injection and warfarin post-injection, respectively). h, Relative proportions of each clone in the cardiovascular CTCs of animals that were orthotopically injected with the 23-clone pool and administered regular drinking water or water containing 10 mg ml−1 warfarin (either pre- or post-injection, P < 0.002, Wilcoxon rank-sum, n = 7, 7 and 5 mice for mice administered no warfarin, warfarin preinjection and warfarin post-injection, respectively). For all box plots, the edges of the box are the twenty-fifth and seventy-fifth percentiles. The error bars extend to the values _q_3 + w(_q_3 − _q_1) and _q_1 − w(_q_3 − _q_1), in which w is 1.5 and _q_1 and _q_3 are the twenty-fifth and seventy-fifth percentiles, respectively.
Clones 4T1-E and 4T1-T were robust in their capacity to form tubular structures when grown on matrigel, a characteristic consistent with increased vascular mimicry in tumour cells (Extended Data Fig. 7a). In addition, Serpine2- and Slpi-depleted 4T1-T cells displayed fewer PAS+/CD31− channels in their derived tumours, and formed significantly fewer tubular structures in vitro (Fig. 4c and Extended Data Fig. 7b, P< 0.02 and P< 0.0002, Wilcoxon rank-sum).
Enforced expression of Serpine2 and Slpi in parental 4T1 cells or non-intravasating clones 4T1-B, -F, -N and -S increased in vitro formation of tubular structures (with the exception of 4T1-B over-expression of Slpi, Extended Data Fig. 1e, 7c, P< 0.03, Wilcoxon rank-sum). For each clonal line (with the exception of 4T1-F), this was accompanied by an enhanced capacity to contribute to CTCs in the context of a heterogeneous clone mixture (for this experiment lacking 4T1-E, Extended Data Fig. 7d, P< 0.05, Wilcoxon rank-sum). Tumours derived from the parental 4T1 cells overexpressing Serpine2 and Slpi had significantly more PAS+/CD31− channels than cells infected with an empty vector, and this was accompanied by an increase in lung metastases (Extended Data Fig. 7e–g, P< 0.01, Wilcoxon rank-sum, and P< 0.05, Friedman).
Serpine2 and Slpi also enabled vascular mimicry in human basal and/or claudin-low breast cancer lines MDA-MB-231 and -436 in vitro (Extended Data Fig. 8a, b, P< 0.05, Friedman) and in vivo (Fig. 4d and Extended Data Fig. 8c, P< 0.0002 and P< 0.002, respectively, Wilcoxon rank-sum). This was accompanied by an increase in lung metastatic burden (Extended Data Fig. 8d, e, P< 0.05, Wilcoxon rank-sum). A barcode analysis of these lines (as described for Fig. 2d) determined that this resulted from an expansion in the number of clones that were able to form CTCs (Fig. 4e and Extended Data Fig. 8f, P < 0.04 and P < 0.02, respectively, Wilcoxon rank-sum).
Both Serpine2 and Slpi are anticoagulants and previous studies have reported that such factors are amplified in tumours with pronounced vascular mimicry21. Anticoagulants could have a role in maintaining flow in extravascular channels by preventing clotting at the vascular– extravascular interface. To test whether anticoagulants promote intravasation and metastasis, we orthotopically injected the pool of clones into warfarin-treated mice. These animals had significantly reduced levels of cleaved prothrombin factors fragments 1 and 2 (F1 and F2) in the blood, and increased vascular leakiness in their tumours (Extended Data Fig. 9a–c, P < 0.01 and P < 0.000005, Wilcoxon rank-sum). However, no significant change in PAS+/CD31− vessels was observed (not shown). While tumour volumes remained stable, quantitative PCR (qPCR) for the barcode vector in whole blood revealed a significant escalation in the number of CTCs (Fig. 4f, P< 0.05, Wilcoxon rank-sum). This was also accompanied by an increase in lung metastatic burden (Fig. 4g, P < 0.04, Wilcoxon rank-sum). By contrast, when cells were injected intracardially, a significant decrease in metastases was observed, indicating that anticoagulants strongly promote intravasation (Extended Data Fig. 9d, P < 0.05, Wilcoxon rank-sum).
If the anticoagulant activity of Serpine2 and Slpi is important for intravasation, one would expect cells overexpressing these proteins to have less of a competitive advantage if coagulation were reduced globally within the tumour. We therefore clonally profiled the tumours, blood and lung metastases from warfarin-treated animals. Although no difference was observed between the primary tumours, clones 4T1-E and 4T1-T were reduced relatively in the CTCs and lung metastases of the warfarin-treated groups (Fig. 4h and Extended Data Fig. 9e, f, P < 0.002 and P < 0.003, Wilcoxon rank-sum). Those clones with relatively increased abundance in CTCs of warfarin-treated animals all showed some native capacity to form extravascular networks in vivo. These results hint that the anticoagulant action of Serpine2 and Slpi promotes extravascular network perfusion and consequently intravasation.
We have described a mouse model of breast tumour heterogeneity, which allowed us to probe the molecular basis of stable differences in the ability of clonal populations to contribute to various aspects of the disease. In this model, the ability to form CTCs, and ultimately metastases, is closely linked to the capacity for vascular mimicry. Tumour cell lined vasculature has shown a strong clinical correlation with advanced stage disease and poor clinical outcome22. In our model, vascular mimicry is driven by increased expression of two secreted proteins, Serpine2 and Slpi. Very little is currently known of the molecular determinants that enable vascular mimicry, and, to our knowledge, Serpine2 and Slpi are among the first validated drivers of this process. These proteins drive the formation of tubules in vitro and extravascular networks in vivo. In addition, we have shown that they probably have an additional role, by acting as anticoagulants at the vascular/extravascular interface to maintain perfusion of the tumour lined networks. Together, these properties are likely to promote the passage of red blood cells into the tumour and cancer cells into the bloodstream. Thus, our findings reveal a process that links fulfilment of the needs of the primary tumour with metastatic progression.
Methods
Cell culture
The mouse mammary tumour cell line 4T1 (ATCC) and any derived clonal cell lines were cultured in DMEM high glucose (Life Technologies) supplemented with 5% fetal bovine serum (FBS; Thermo Scientific), 5% fetal calf serum (FCS; Thermo Scientific), non-essential amino acids (Life Technologies) and penicillin-streptomycin (Life Technologies). Human breast tumour cell lines MDA-MB-231 and MDA-MB-436 (ATCC) were cultured in DMEM high glucose supplemented with 10% FBS, non-essential amino acids and penicillin-streptomycin. Human umbilical vein endothelial cells (HUVECs) (Lonza) were cultured in EBM-2 media with the EGM-2 Bulletkit (Lonza). HUVECs were used within three passages. Platinum-A (Cell BioLabs) and 239-FT (Life Technologies) packaging cell lines were cultured in DMEM high glucose supplemented with 10% FBS and penicillin-streptomycin.
Virus production
All retroviral vectors were packaged using platinum-A packaging cells. The lentiviral barcode library was packaged using 293-FT lentivirus packaging cells. Cells were plated on 15 cm adherent tissue culture plates (Corning) ∼5 h before transfection at a confluency of ∼70%. A transfection mixture was prepared with viral vector (75 μg), VSV-G (7.5 μg), 2 M calcium chloride (187.5 μl) (Sigma-Aldrich) and, when transfecting shRNA-containing vectors, 20 nM siRNAs targeting Pasha (200 μl) (Qiagen). The mixture was brought to 1.5 ml with H2O and then added drop-wise to the same amount of 2× HBS while being bubbled. One litre of 2× HBS was prepared with 280 mM NaCl, 50 mM HEPES, 1.5 mM Na2HPO4, 12mM dextrose and 10 mM KCl (Sigma-Aldrich), then adjusted to a pH of 7.02. After the transfection mixture was added to the HBS, vigorous bubbling continued for 30–60 s. After letting the resultant mixture stand for 15 min, it was added to the packaging cells along with 100 mM chloroquin (7.5 μl) (Sigma-Aldrich). After 14 h, media was replaced. Thirty hours after media change, virus was collected and filtered through a 0.45-μm filter (EMD Millipore) and stored at 4°C.
Establishment of clonal cell lines. Around 30 million 4T1 cells were infected with the lentiviral barcode library (Extended Data Fig. 1b) at a multiplicity of infection (MOI) of 0.3. Single cells were sorted using the FACSAria IIU cell sorter (BD Biosciences) into 96-well plates. Clonal cell lines were minimally expanded and frozen down. The barcode of each individual clonal cell line was determined by Sanger sequencing. Forward primer: 5′-CAGAATCGTTGCCTGCACATCTTGGAA-AC-3′ and reverse primer: 5′-ATCCAGAGGTTGATTGTTCCAGACGCGT-3′.
Clonal cell line proliferation rates
Proliferation assays were performed by counting viable cells over 72h. In total, 1 × 10⁵ cells were plated in duplicates and were counted using the MACSQuant Analyzer (Miltenyi Biotec).
Chromosomal integration site
Genomic DNA from each clone was isolated using the QIAamp DNA Blood Mini Kit (Qiagen). Choromosmal integration sites were determined using the Lentiviral Integration Site Analysis Kit (Clontech).
Pooling experiments
For clonal pooling experiments, clonal cell lines were counted in duplicates using the MACSQuant Analyzer (Miltenyi Biotec). Equal numbers of cells were pooled together for injection. A pre-injection pool was collected to validate equal representation of each clone before injection. Tumour, lung, brain, liver and brachial lymph node were collected from mice for further processing. Blood was collected through cardiac perfusion with PBS and 0.5M EDTA, pH8.0, was added as an anticoagulant.
Animal studies
All mouse experiments were approved by the Cold Spring Harbour Animal Care and Use Committee. Female 6–7-week-old NOD-SCID-Il2rg−/− (NOD.Cg-Prkdcscid Il2rgtm1Wjl/SzJ, NSG) were purchased from JAX. All orthotopic injections were performed using 1 × 10⁵ mouse mammary tumour cells re-suspended in 20μl of a 1:1 mix of PBS and growth-factor-reduced Matrigel (BD Biosciences). For human breast cancer cells MDA-MB-231 and MDA-MB-436, 2 × 10⁶ cells were re-suspended in 50μl of a 1:1 mix of PBS and Matrigel. Injections were done into mammary gland 4. For intracardiac injections, 1 × 10⁵ mouse mammary tumour cells were re-suspended in 200μl of PBS and injected into the left cardiac ventricle. For tail-vein injections, 5 × 10⁵ mouse mammary tumour cells were re-suspended in 100μl PBS.
Primary tumour volume was measured using the formula V = 1/2(L × W2), in which L is length and W is width of the primary tumour. Warfarin (10mgl−1, Sigma-Aldrich) was administered with drinking water and changed every 3 days. For all animal studies where a P value was to be reported, a minimum of five animals per condition were used. This allows for standard non-parametric tests (for example, Wilcoxon rank-sum) to detect strong effects. Animals were assigned to treatment groups through random cage selection. Animals that succumbed to tumour cell injections were excluded from analysis. No statistical methods were used to predetermine sample size.
Quantification of lung metastatic burden
The lung metastatic burden of individual clones and MDA-MB-231 cells injected into the mammary gland was evaluated in five-micrometre sections stained with a standard haematoxylin and eosin protocol. Quantification was performed using Image J Software (NIH) converting images to 8-bit. Upper and lower thresholds for each image were adjusted to determine total lung area and adjusted again to determine the metastatic area. Both values were used to obtain relative metastatic areas. For all other experiments, the lung metastatic burden was evaluated by counting the number of metastatic nodules in the lung. For this, five-micrometre sections were stained with a standard haematoxylin and eosin protocol.
Barcode and shRNA analysis
Genomic DNA was isolated using phenol chloroform extraction for all tissues except blood. Genomic DNA for blood was isolated using the QIAamp DNA Blood Mini Kit (Qiagen).
The barcodes of the retroviral library (Extended Data Fig. 1a) were amplified using a one-step PCR protocol. For each sample, 96 individual PCR reactions of 200 ng of genomic DNA were carried out using KOD Polymerase (EMD Millipore). Forward primer: 5′-AATGATACGGCGACCACCGAGATCTACA-CTCTTTCCCTACACGACGCTCTTCCGATCT-3′ and reverse primer: 5′-CAAGCAGAAGACGGCATACGAGATNNNNNNGTGACTGGAGTTC-AGACGTGTGCTCTTCCGATC-3′. The reverse primer contained a barcode (NNNNNN) that enabled multiplexing with standard Illumina Truseq chemistry and software. The PCR was carried out for 30 cycles and PCR products were purified using the PCR purification kit (Qiagen). PCR products were size selected on an E-gel SizeSelect 2% agarose gel (Life Technologies), and sequenced on the Illumina HiSeq sequencer generating 22-nucleotide single-end (SE) reads.
The barcodes of the lentiviral library (Extended Data Fig. 1b) were amplified using a two-step PCR protocol. For each sample, eight individual PCR reactions of 200ng of genomic DNA were carried out using KOD Polymerase (EMD Millipore). Forward primer 1: 5′-GTGACTGGAGTTCAGACGTGTGCTCTTCCGATCT-CAGAATCGTTGCCTGCACATCTTGGAAAC-3′ and reverse primer 1: 5′-AC-ACTCTTTCCCTACACGACGCTCTTCCGATCTATCCAGAGGTTGATTGT-TCCAGACGCGT-3′. The first PCR was carried out for 25 cycles. PCR products were purified using the PCR purification kit (Qiagen). The second PCR was performed using 500 ng of PCR product from the first PCR. Forward primer 2: 5′-AATGATACGGCGACCACCGAGATCTACACTCTTTCCCTACACGAC-GCTCTTCCGATCT-3 and reverse primer 2: 5′-CAAGCAGAAGACGGCAT-ACGAGATNNNNNNGTGACTGGAGTTCAGACGTGTGCTCTTCCGAT-C-3′. The reverse primer contained a barcode (NNNNNN) that enabled multiplexing with standard Illumina Truseq chemistry and software. The second PCR was carried out for 25 cycles and PCR products were again purified using the PCR purification kit (Qiagen). PCR products were size selected on an E-gel SizeSelect 2% agarose gel (Life Technologies), and sequenced on the Illumina HiSeq sequencer generating 22-nucleotide single-end (SE) reads.
For Figs 1, 2d, 4e and Extended Data Fig. 8f, the vector library was sequenced at high depth. For each experiment the corresponding fastq file was aligned to the vector library with the Bowtie software, allowing three mismatches. Each experimental read was then assigned to the most abundant vector sequence that it mapped to. For Fig. 1 only sequences that were present with a count greater than or equal to five in all tumours were analysed. For Fig. 2d, the error bars represent the number of clones that were identified when 100 bootstrapped samples of 1million reads each were processed for each of the two tumours, blood and lung samples. For Fig. 4e and Extended Data Fig. 8f, bootstrapping was also performed as described above and each sample (tumour, blood sample or pair of lungs) was assigned the median of the clones identified in the corresponding random samplings.
For Extended Data Fig. 1g, h, a mixed Gaussian model was fitted to the summed distributions described in Extended Data Fig. 1f. Abundant clones were identified as those that then subsequently clustered into the Gaussian with the larger mean.
The shRNAs were amplified using the same two-step PCR protocolas described above for the lentiviral barcode library. Forward primer 1: 5′-CAG-AATCGTTGCCTGCACATCTTGGAAAC-3′ and reverse primer1: 5′-CTGCT-AAAGCGCATGCTCCAGACTGC-3′. Forward primer 2: 5′-AATGATACGG-CGACCACCGAGATCTACACTAGCCTGCGCACGTAGTGAAGCCACAG-ATGTA-3′ and reverse primer 2: 5′-CAAGCAGAAGACGGCATACGAGAT-NNNNNNGTGACTGGAGTTCAGACGTGTGCTCTTCCGATCTCTGCTA-AAGCGCATGCTCCAGACTGC-3′. The reverse primer contained a barcode (NNNNNN) that enabled multiplexing.
NGS libraries that failed to produce more than 5,000 sequences were excluded from any further analysis as this was taken as evidence of poor quality.
Barcode quantification
Barcode libraries were de-convoluted using the Bowtie software allowing three mismatches23. Barcode counts were then quantified from the resultant .sam file with a simple shell script containing the unix commands, cut, sort and uniq-c.
Isolationof matched tumour and lung metastatic cells
Tumour and lung tissue were harvested from mice injected with the pool of 23 clonal cell lines. Tissue was minced and treated in DMEM high glucose containing 1 × collagenase/hyaluronidase buffer (StemCell) and 10U DNase I (Sigma) for 1h at 37°C. Cells were washed in HBSS (Life Technologies) twice and then re-suspended in 4T1 cell culture media containing 60μM 6-thioguanine. Cells were passaged for 5 days until all stromal cells died.
RNA-seq library preparation
Total RNA was purified and DNase treated using the Qiagen RNeasy Mini Kit. RNA integrity (RNA Integrity score > 9) and quantity was measured on an Agilent Bioanalyzer (RNA Nano kit). The NuGEN Ovation RNA-Seq V2 protocol was carried out on 100 ng of total RNA. cDNA was fragmented using the Covaris LE220 sonicator according to the manufacturer's instruction to yield a target fragment size of 200 bp. The fragmented cDNA was subsequently processed using the NuGEN Ovation Ultralow DR Multiplex System. Two technical replicates were used per sample.
Analysis of RNA-seq data
Each sample was sequenced on the Illumina HiSeq sequencer generating 76-nucleotide single-end reads. Reads were aligned to the mm 10 genome using the Bowtie-2 alignment tool under default parameters24. Mapped reads were then assigned to genes using HTSeq-count (using the latest version of RefSeq.gtf file for gene coordinates)25. Resultant counts were then normalized and compared using DESeq26. For a gene to be considered overexpressed it had to show an at least twofold change with a false discovery rate (FDR) < 0.05.
Analysis of clinical data
A matrix where rows correspond to genes and columns to patients was quantile normalized to ensure that each patient profile had an equivalent empirical distribution. For the analysis of SERPINE2 and SLPI in relapsed and non-relapsed patients the across-patient profiles were _z_-score normalized and then the values of the relapsed patients compared to the non-relapse for each tumour subtype and site of relapse combination.
shRNA knockdown and cDNA overexpression
Mouse and human cell lines were transduced with amphotropically packaged retroviruses (Extended Data Fig. 1c–e). For shRNA knockdown studies, 4T1-T cells and parental 4T1 cells were selected with 500 μg ml−1 hygromycin for 1week.
For overexpression studies, all mouse clonal cells lines were selected with 1,000 μg ml−1 G418 for 1 week, the parental 4T1 cell line was selected with 600 μg ml−1 G418 for 1 week. MDA-MBA-231 cells were selected with 1,500 μg ml−1 G418 and MDA-MD-436 cells were selected with 1,000μg ml−1 G418 for 1 week. shSerpine2-1: 5′-TGCTGTTGACAGTGAGCGACAGGTCTTCAATCAGAT-CATATAGTGAAGCCACAGATGTATATGATCTGATTGAAGACCTGGT-GCCTACTGCCTCGGA-3′. shSerpine2-2: 5′-TGCTGTTGACAGTGAGCGA-CCAGTTCAACTCTCTGTCACTTAGTGAAGCCACAGATGTAAGTGACA-GAGAGTTGAACTGGGTGCCTACTGCCTCGGA-3′. shSlpi1-1: 5′-TGCTG-TTGACAGTGAGCGATGCGTGAATCCTGTTCCCATATAGTGAAGCCAC-AGATGTATATGGGAACAGGATTCACGCACTGCCTACTGCCTCGGA-3′. shSlpi2-2: 5′-TGCTGTTGACAGTGAGCGATCAGGCAAGATGTATGATG-CTTAGTGAAGCCACAGATGTAAGCATCATACATCTTGCCTGAGTGCC-TACTGCCTCGGA-3′.
Barcode complexity studies
Parental 4T1 cells were infected with the retroviral barcode library and were selected with 500μg ml−1 hygromycin for 1 week. 4T1-E, 4T1-L and 4T1-T cells were infected with the retroviral barcode library. 4T1-E and 4T1-L cells were selected with 1,000 μg ml−1 hygromycin for 1 week. 4T1-T cells were selected with 500 μg ml−1 hygromycin for 1 week.
After infection and selection of MDA-MB-231 and MDA-MB-436 cells with overexpression constructs, cells were infected with the lentiviral barcode library and selected with 1 μg ml−1 puromycin for 5 days.
qRT–PCR
Total RNA was purified and DNase treated using the RNeasy Mini Kit (Qiagen). Synthesis of cDNA was performed using SuperScript III Reverse Transcriptase (Sigma). Quantitative PCR analysis was performed on the Eppendorf Mastercycler ep realplex. All signals were quantified using the Δ_C_t method and were normalized to the levels of Gapdh.
qRT–PCR primers
Mouse Slpi (exon 1–2): 5′-GACTGTGGAAGGAGGCAAA-3′, 5′-GGCATTGTGGCTTCTCAAG-3′. Mouse Slpi (exon 3–4): 5′-CAGT-GTGACGGCAAATACAAG-39, 59-GCCAATGTCAGGGATCAGG-3′. Mouse Serpine2 (exon 3–4): 5′-TCTGCCTCTGAGTCCATCA-3′, 5′-AACCGAGAC-TTCCACAAACC-3′. Mouse Serpine2 (exon 5–6): 5′-TCATCCCTCACATCA-CTACCA-3′, 5′-CTTTCAGTGGCTCCTTCAGAT-3′. Mouse Gapdh (exon 2–3): 5′-AATGGTGAAGGTCGGTGTG-3′, 5′-GTGGAGTCATACTGGAAC-ATGTAG-3′. Human SLPI (exon 1–2): 5′-TGTGGAAGGCTCTGGAAAG-3′, 5′-TGGCACTCAGGTTTCTTGTATC-3′. Human SERPINE2 (exon 5-6): 5′-GCCATGGTGATGAGATACGG-3′, 5′-GCACTTCAATTTCAGAGGCAT-3′. Human GAPDH (exon 2–3): 5′-ACATCGCTCAGACACCATG-3′, 5′-TGTAG-TTGAGGTCAATGAAGGG-3′.
mCherry analysis
For immunohistochemistry, five-micrometre sections of paraffin-embedded lungs or primary tumours were deparaffinized in xylene, rehydrated in an alcohol series and immersed in distilled water. The sections were treated with high-temperature antigen retrieval in citrate buffer (pH 6). The slides were then blocked with 2.5% ready-to-use normal horse serum from ImmPRESS Anti-Rabbit Ig (peroxidase) Polymer Detection Kit (MP-7401, Vector Laboratories) for 1h and then incubated with primary antibody RFP Antibody Pre-adsorbed (1:200) (600-401-379, Rockland) overnight at 4 °C. After washing, the slides were incubated with secondary antibody from the previous kit for 30 min, rinsed and developed with chromogen ImmPACT DAB Peroxidase Substrate for staining (SK-4105, Vector Laboratories) until the desired intensity was achieved. Slides were counterstained with haematoxylin and coverslipped. Sections were then scanned on the Aperio Light Field Slide Scanner (Aperio) for further quantification. Omission of the primary antibody was used as a negative control in both cases. All quantification was performed in a blinded setting.
Vascular leakage
To visualize vascular leakage in the primary tumour, 100 μl of dextran Alexa 647, 10kDa (1mg ml−1 in PBS) (Life Technologies) were injected into mice by tail vein injection. Three minutes later, mice were perfused with 4% paraformaldehyde (PFA). After fixation, tumours were collected and placed in 4% PFA overnight at 4 °C. After this, samples were infiltrated with 20% sucrose overnight at 4 °C. Tumours were frozen in OCT compound (Sakura Finetek) and 25-μm thick sections were cut, washed, incubated with DAPI (1 mg ml−1) (Sigma-Aldrich) and mounted in ProLong Gold antifade reagent (Life Technologies). Sections were examined under the LSM 780 Confocal microscope (Zeiss).
An average of 5–7 fields were taken from each sample. Images were quantified using ImageJ software (NIH). For quantifying fluorescence, the threshold of each picture was adjusted to the lowest possible value in the DAPI channel to measure total tissue area. The dextran threshold was fixed in each picture at a determined value based on the average intensity of all samples processed. The dextran-positive area was then normalized to the total tissue area in order to calculate the leakiness index. All quantification was performed in a blinded setting.
CD31 analysis
Four-micrometre sections of paraffin-embedded primary tumours were de-paraffinized in xylene, rehydrated in an alcohol series and immersed in distilled water. The sections were then treated with high-temperature antigen retrieval in citrate buffer (pH 6), blocked with 2.5% ready-to-use normal horse serum from ImmPRESS Anti-Rabbit Ig (peroxidase) Polymer Detection Kit (MP-7401, Vector Laboratories) for 1 h and incubated with primary antibody against CD31 (1:400) (28364, Abcam) overnight at 4 °C. After washing, the slides were incubated with secondary antibody from the previous kit for 30 min, rinsed, and developed with chromogen ImmPACT DAB Peroxidase Substrate for staining (SK-4105, Vector Laboratories) until the desired intensity was achieved. Slides were then stained with Periodic Acid-Schiff (PAS) Kit (Sigma) according to manufacturer's instructions. Sections were then scanned on the Aperio Light Field Slide Scanner (Aperio) for further analysis. Omission of the primary antibody was used as a negative control.
Vascular mimicry
PAS staining, haematoxylin and eosin staining, and CD31 immunohistochemistry were used to evaluate the presence and extent of mimicry as previously described18–20. Five random ×40 fields per tumour were scored for the number and size of areas with morphology consistent with mimicry. The criteria used was (1) PAS positive channels that contain red cells and fluid, (2) the absence of CD31 staining in these channels, and (3) the polarization of tumour cells on an indistinct or imperceptible matrix lining vascular channels with red cells and/or fluid and no evidence of endothelization or tumour cells lining vascular spaces with no evidence of amatrix. All quantification was performed in a blinded setting.
Tube formation assay
The 96-well plates were coated with 50ml of growth-factor-reduced Matrigel (BD Biosciences) and 5 × 10³ cells were re-suspended in EBM-2 media and plated in each well. All cells were plated in four replicates. Morphological studies were performed after 8h using the Zeiss Axio Observer inverted microscope. For Extended Data Fig. 7a, the morphological analysis was performed after overnight incubation.
Prothrombing fragment 1 + 2 ELISA
Blood was collected from animals that were treated with warfarin by cardiac heart puncture using 3.8% sodium citrate as an anticoagulant. Samples were centrifuged at 1,000g for 15min at 4 °C. Blood plasma was isolated and stored at −80°C for further processing. Plasma samples were analysed for prothrombin fragment 1 + 2 using the Mouse Prothrombin Fragment 1 + 2 (F1 + 2) ELISA kit (Kamiya Biomedical Company) according to manufacturer's instructions.
qPCR for circulating tumour cells
Genomic DNA for blood was isolated using the QIAamp DNA Blood Mini Kit (Qiagen) and quantified using Prime Time qPCR assays (IDT). All samples were processed in triplicates. Each reaction consisted of 50 μl, containing 25 μl of iTaq Universal Super mix (BioRad), 2.5 μl of barcode primers and probe (primer 1: 5′-ATCCAGAGGTTGATTGTTCCAGACGCGT-3′, primer 2: 5′-CAGAATCGTTGCCTGCACATCTTGGAAAC-3′, FAM probe: 5′-/56-FAM/AAGGCTCGA/ZEN/GACGTAGTCAGACGT/3IABkFQ/-3′), 2.5 μl of housekeeping (NM_172901.2) primers and probe (primer 1: 5′-GACTTGTAAC-GGGCAGGCAGATTGTG-3′, primer 2: 5′-GAGGTGTGGGTCACCTCGACA-TC-3′, HEX probe: 5′-/5HEX/CCGTGTCGC/ZEN/TCTGAAGGGCAATAT/3IABkFQ/-3, IDT) and 20 μl of gDNA sample (100 ng). The cycling conditions were 1 cycle of denaturation at 95 °C for 3 min, followed by 40 cycles of amplification (95 °C for 15 s, 68 °C for 1 min). qPCR analysis was performed on the Eppendorf Master cycler ep realplex. All signals were quantified using the Δ_C_t method and were normalized to the levels of the housekeeping gene.
Extended Data
Extended Data Figure 1. Overview of vector plasmids and clonal abundances in the primary tumour and secondary sites after 4T1 transplantation.
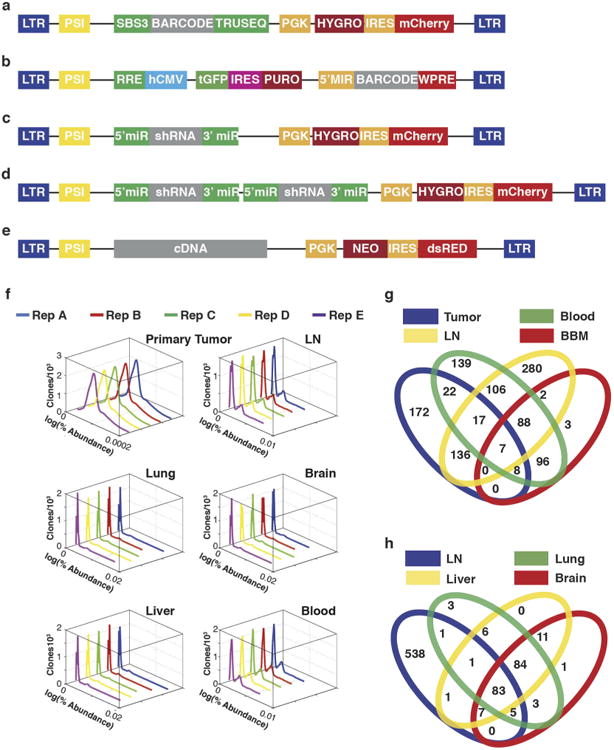
a, Schematic of the retroviral barcode vector (used for Figs 1, 2d, 4e and Extended Data Fig. 8f). b, Schematic of the lentiviral barcode vector (used for Fig. 2a–c). c, Schematic of the retroviral shRNA vector used for single gene knockdown. d, Schematic of the tandem retroviral shRNA vector used for double gene knockdown. e, Schematic of the retroviral cDNA vector used for gene overexpression. f, Distribution of clone abundances in the primary tumours and secondary sites for the 4T1 clones that engrafted and contributed to tumour formation in all five animals after orthotopic injection. g, Overlap of abundant clones in the primary tumour, lymph nodes, blood and in all blood-borne metastases (BBM: lung, liver and brain) (P < 0.001, hypergeometric test). h, Overlap of the abundant clones in the lymph nodes, liver, lung and brain.
Extended Data Figure 2. Morphology and proliferation rates of all clonal lines grown.
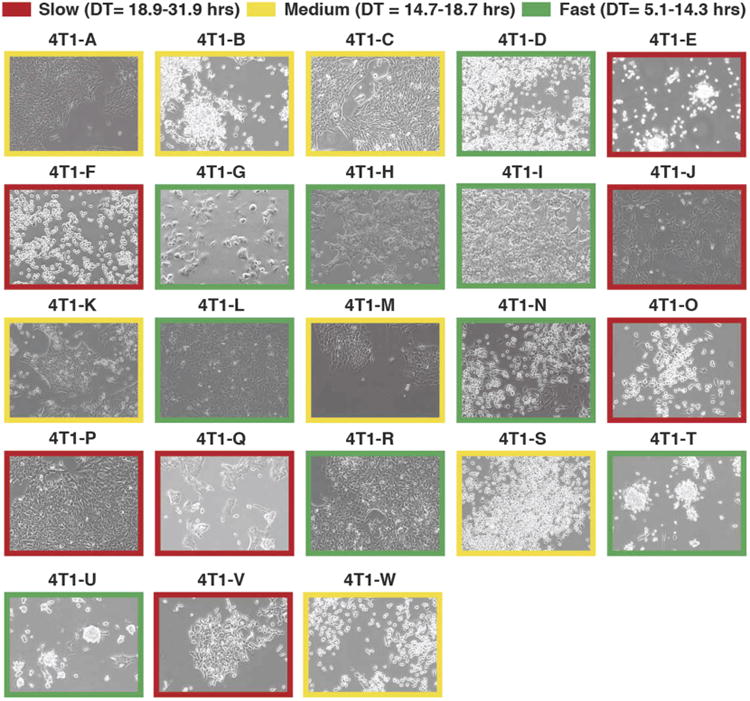
Microscopic phase-contrast images of the 23 clonal lines discussed in Figs 2–4. Doubling times (DT), as calculated over a 3-day period, are colour-coded in the image borders. Original magnification, ×10.
Extended Data Figure 3. Tumour growth and metastases rates for individually injected clones and clonal composition of intracardiacally injected pool.
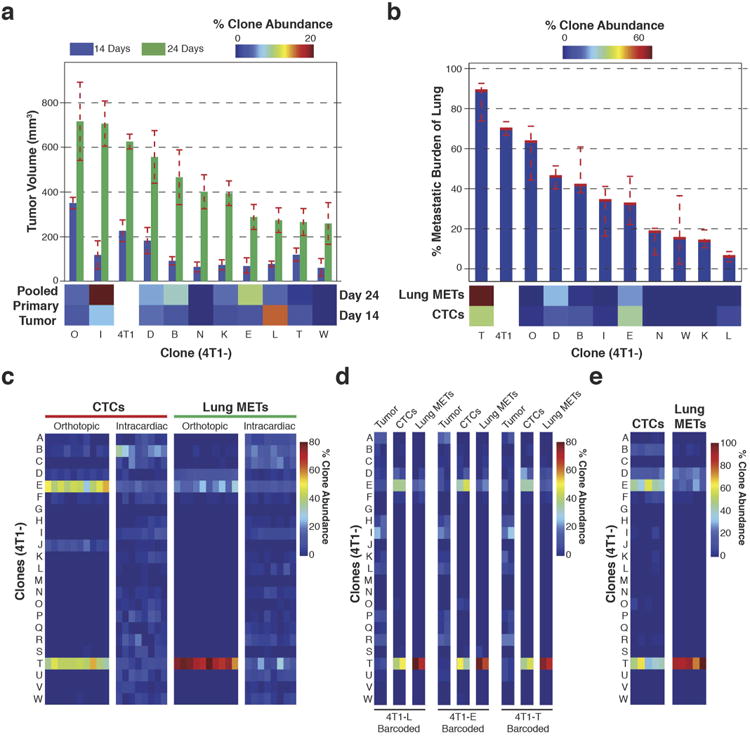
a, Primary tumour volumes resulting from orthotopically injected individual clonal cell lines. Measurements were taken 14 and 24 days after injection (n = 4 mice). For comparison, the clonal composition of the primary tumour when the pool of clones is injected orthotopically is shown below. b, The percentage of lung metastatic burden for the animals discussed in a 24 days after injection (n = 4 mice). For comparison, the clonal composition of the lung when the pool of clones is injected orthotopically is shown below. c, A comparison of the clonal composition of CTCs and lung metastases when the pool of 23 clonal lines was orthotopically injected (data from Fig. 2c) versus injected into the left cardiac ventricle of mice (n = 10 mice for orthotopic injections and n = 8 mice for intracardiac injections). d, Clonal compositions of the primary tumours, CTCs and lung metastases analysed in Fig. 2d. e, Clonal composition of CTCs and lung metastases after orthotopic injection when the individual clones were frozen down 3–5 times and cultured for a week each time (n = 5 mice). For all bar graphs, error bars extend to the values _q_3 + w(_q_3−_q_1), and _q_1 − w(_q_3 − _q_1), in which w is 1.5 and _q_1 and _q_3 are the twenty-fifth and seventy-fifth percentiles.
Extended Data Figure 4. SERPINE2 and SLPI expression in human patients and Serpine2 and Slpi shRNAs abundances in lung and CTCs after orthotopic and intracardiac injection.
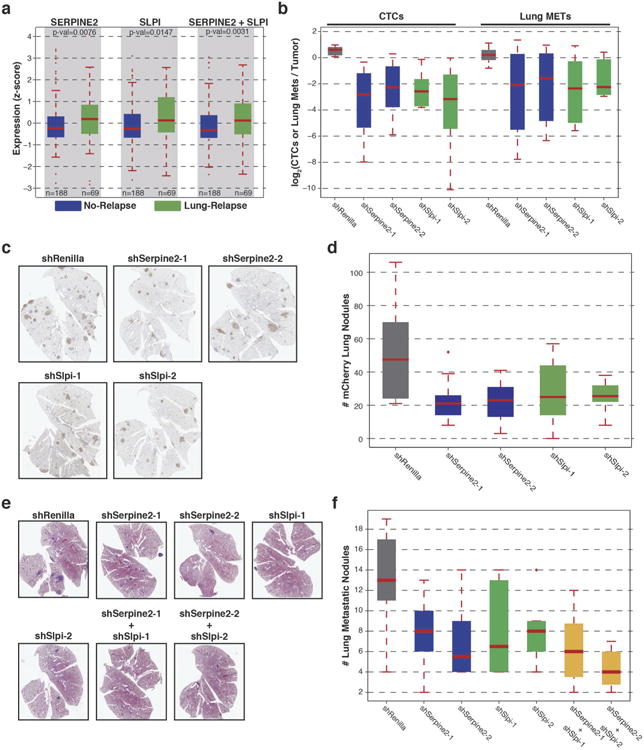
a, Analysis of Serpine2 and Slpi human orthologues SERPINE2 and SLPI, respectively in basal, Her2 or claudin-low breast cancer patients with no relapse as compared to patients with relapse in the lung (P < 0.005, Wilcoxon rank-sum, n indicated in figure). b, A non-targeting shRNA and two targeting each of Serpine2 and Slpi were infected separately into 4T1-T cells. After selection, the separately infected cells were pooled in equal amounts with the remaining 22 clonal lines and orthotopically injected into mice. The proportions of shRNAs shown are that of the CTCs and lung metastases in comparison to those in the primary tumour (P < 0.01, Wilcoxon rank-sum, n = 10 mice). c, 4T1-T cells were infected with a non-targeting shRNA or shRNAs targeting Serpine2 or Slpi. The shRNAs were cotained in a vector that constitutively expressed mCherry. The infected cells were then pooled with the other 22 clones and injected orthotopically (n = 10 mice). Shown are representative images of the resultant mCherry positive lung metastatic nodules. d, Quantification of all mCherry positive metastatic lung nodules in all mice (P < 0.01, Wilcoxon rank-sum, n = 10 mice). e, 4T1-parental cells were infected with a non-targeting shRNA or shRNAs targeting Serpine2 or Slpi. In each case the cells were then orthotopically injected into mice. Shown are representative images of haematoxylin-and-eosin-stained lung sections (n = 10 mice). f, Quantification of lung metastatic nodules in all haematoxylin-and-eosin-stained sections described in e (P < 0.01 and P < 0.005 for single- and double-knockdowns, respectively, Wilcoxon rank-sum, n = 10 mice). For all box plots, the edges of the box are the twenty-fifth and seventy-fifth percentiles. The error bars extend to the values _q_3 + w(_q_3−_q_1), and _q_1 − w(_q_3 − _q_1), in which w is 1.5 and _q_1 and _q_3 are the twenty-fifth and seventy-fifth percentiles.
Extended Data Figure 5. Leakiness index of clonal cell lines.
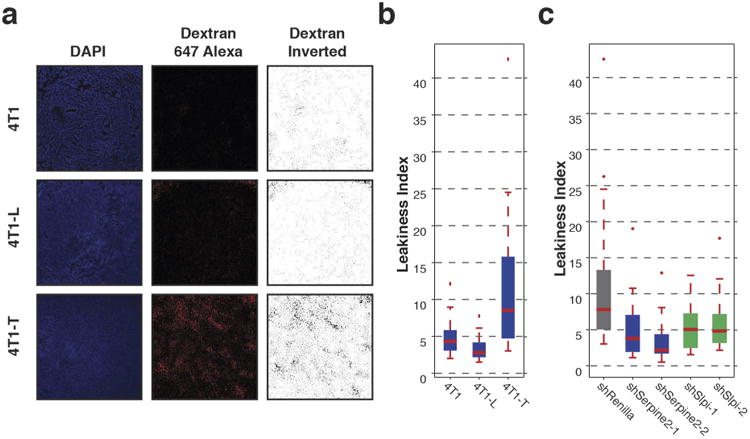
a, DAPI and dextran Alexa 647 (+ dextran inverted)-stained tumour sections from orthotopic tumours derived from parental-4T1, 4T1-L and 4T1-T cells. b, Leakiness index of primary tumours resulting from orthotopic injection of parental-4T1, 4T1-L and 4T1-T cells (P < 0.05, Wilcoxon rank-sum, n = 15 mice). c, The leakiness index of primary tumours derived from 4T1-T cells that have been infected with either a non-targeting shRNA or an shRNA targeting Serpine2 or Slpi (P < 0.03, Wilcoxon rank-sum, n = 18 mice). For all box plots, the edges of the box are the twenty-fifth and seventy-fifth percentiles. The error bars extend to the values _q_3 + w(_q_3 − _q_1), and _q_1 − w(_q_3 − _q_1), in which w is 1.5 and _q_1 and _q_3 are the twenty-fifth and seventy-fifth percentiles.
Extended Data Figure 6. Vascular mimicry in 4T1-T and pooled primary tumours.
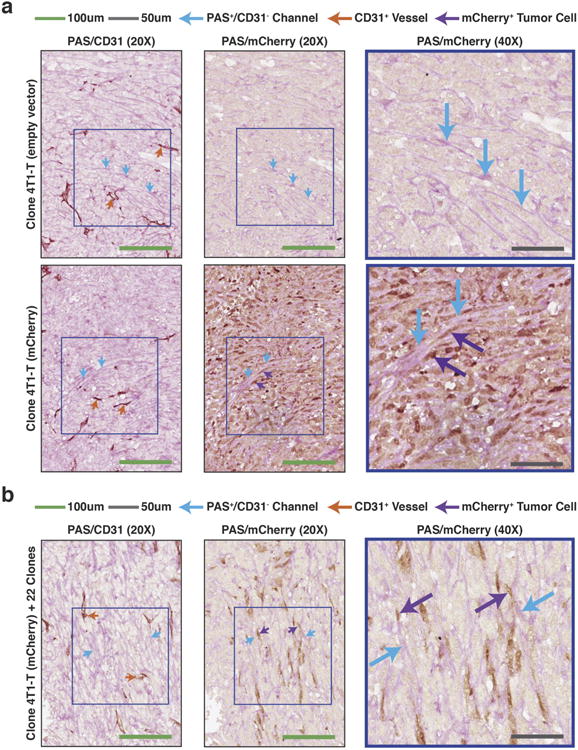
a, PAS/CD31 (left) and PAS/mCherry (right) staining of serially sectioned 4T1-T derived primary tumours, where the tumour cells constitutively express an empty vector or mCherry. Orange arrows indicate CD31+ endothelial blood vessels and blue arrows show PAS+/CD31− channels. The purple arrows indicate mCherry-positive tumour cells adjacent to PAS+ channels (green scale bars = 100 μm, grey scale bars = 50 μm). b, PAS/CD31 (left) and PAS/mCherry (right) staining of serially sectioned primary tumours resulting from orthotopic injection of a pool of the 23 clones, in which the 4T1-T clonal line constitutively expresses mCherry. Orange arrows indicate CD31+ endothelial blood vessels and blue arrows show PAS+/CD31− channels. The purple arrows indicate mCherry-positive tumour cells adjacent to PAS+ channels (green scale bars = 100 μm, grey scale bars = 50μm).
Extended Data Figure 7. Overexpression of Serpine2 and Slpi in parental 4T1 and clonal cell lines.
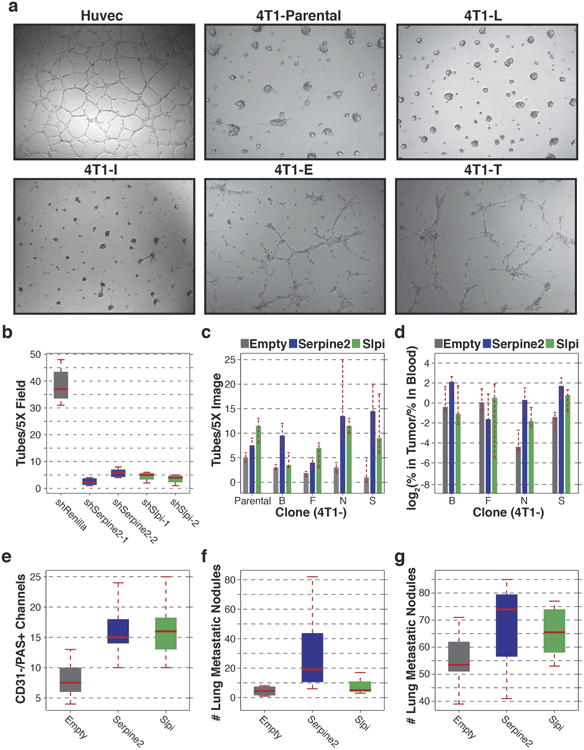
a, Images of HUVECs, parental 4T1, 4T1-L, 4T1-I, 4T1-E and 4T1-T cells grown on Matrigel to assess tube formation ability. b, Number of tubular structures identified per ×5 microscopic field when 4T1-T cells had been infected with a non-targeting shRNA or shRNAs targeting Serpine2 or Slpi and grown on Matrigel (P<0.0002, Wilcoxon rank-sum, n = 8 fields). c, Number of tubular structures identified per ×5 microscopic image when non-intravasating 4T1 clonal lines had been infected with an empty retroviral vector or vectors for overexpression of Serpine2 or Slpi (P < 0.03, Wilcoxon rank-sum, with the exception of 4T1-B overexpressing Slpi, n = 4 fields). d, Relative CTC proportions of the cells described in c after they had been pooled with the remaining clonal lines and orthotopically injected (P < 0.05, Wilcoxon rank-sum, with the exception of 4T1-F and 4T1-B Slpi, n = 10 mice). e, PAS+/CD31− channels in primary tumours resulting from orthotopic injection of parental 4T1 cells infected with an empty retroviral vector or vectors for overexpression of Serpine2 or Slpi (P < 0.01, Wilcoxon rank-sum, n = 10 fields). f, Quantification of the number of lung metastatic nodules resulting from the tumours described in e after 18 days (n = 4 mice). g, Quantification of the number of lung metastatic nodules resulting from the tumours described in e after 24 days (P<0.05, Friedman, n = 10 mice). For all box plots, the edges of the box are the twenty-fifth and seventy-fifth percentiles. The error bars extend to the values _q_3 + w(_q_3 − _q_1), and _q_1 − w(_q_3 − _q_1), in which w is 1.5 and _q_1 and _q_3 are the twenty-fifth and seventy-fifth percentiles.
Extended Data Figure 8. Overexpression of SERPINE2 and SLPI in human breast cancer cell lines.
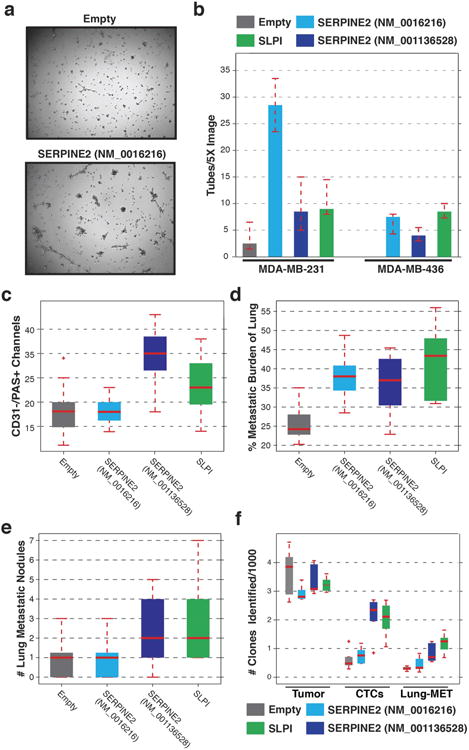
a, MDA-MB-231 cells infected with an empty overexpression vector plated on Matrigel (top) and MDA-MB-231 cells overexpressing SERPINE2 (NM_0016216) plated on Matrigel (bottom). b, Full quantification of tubular structures in basal cell lines MDA-MB-231 and MDA-MB-436 when infected with an empty overexpression vector or when infected with vectors for overexpressing SERPINE2 or SLPI (P < 0.05, Friedman test, for SERPINE2 isoform NM_0016216 and SLPI, n = 4 fields). c, Quantification of CD31−/PAS+ channels in MDA-MB-436-derived primary tumours cells that have been infected with an empty retroviral vector or vectors for overexpression of SERPINE2 or SLPI (P < 0.002, Wilcoxon rank-sum, for SERPINE2 isoform NM_001136528 and SLPI, n = 20 fields for empty, SERPINE2 NM_001136528 and NM_0016216 and n = 25 fields for SLPI). d, The percentage of lung metastatic burden after orthotopic injection of MDA-MB-231 cells that have been infected with an empty retroviral vector or vectors for overexpression of SERPINE2 or SLPI (P < 0.05, Wilcoxon rank-sum, n = 9 mice). e, Quantification of the number of lung metastatic nodules after orthotopic injection of MDA-MB-436 cells that have been infected with an empty retroviral vector or vectors for overexpression of SERPINE2 or SLPI (Wilcoxon rank-sum P < 0.05 for SERPINE2 isoform NM_001136528 and SLPI, n = 9 mice). f, Sub-clonal analysis of MDA-MB-436 cells that have been infected with an empty retroviral vector or vectors for overexpression of SERPINE2 or SLPI. Each cell line was infected with a barcode library and then the number of clones were quantified in the primary tumour, cardiovascular CTCs and lung metastatic cells (P < 0.02, Wilcoxon rank-sum, for SERPINE2 isoform NM_001136528 and SLPI in CTCs and lung metastasis, n = 5 mice). For all box plots, the edges of the box are the twenty-fifth and seventy-fifth percentiles. The error bars extend to the values _q_3 + w(_q_3−_q_1) and _q_1 − w(_q_3 − _q_1), where w is 1.5 and _q_1 and _q_3 are the twenty-fifth and seventy-fifth percentiles.
Extended Data Figure 9. Effect of warfarin on leakiness, metastasis and clonal abundance.
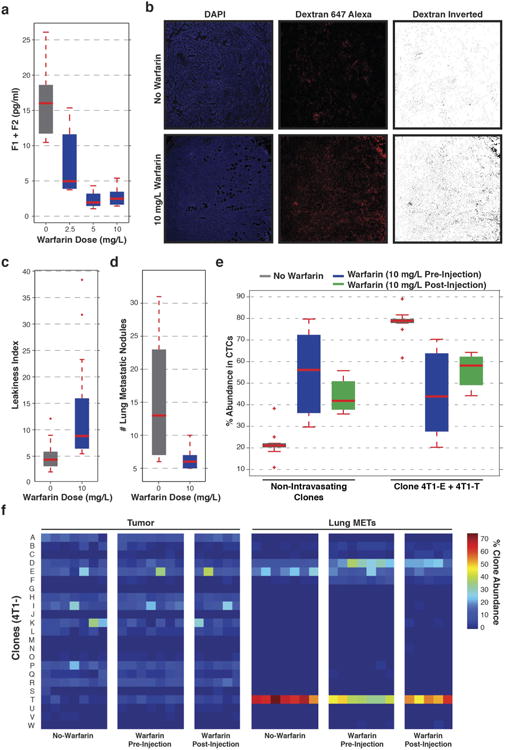
a, Levels of prothrombin fragments F1 and F2 (active component of blood coagulation), as quantified by ELISA, after administration of warfarin in the drinking water of mice (P < 0.01, Wilcoxon rank-sum, n = 4 mice). b, DAPI and dextran Alexa 647 staining to visualize vascular leakage in primary tumours derived from the pool of 23 clonal lines. Animals were administered drinking water either with or without 10mg ml−1 warfarin. c, Leakiness index of primary tumours resulting from orthotopic injection of the pool of 23 clonal lines. After injection mice were administered drinking water with no warfarin or water containing 10mg ml−1 warfarin (P < 0.000005, Wilcoxon rank-sum, n = 10 mice). d, Counts of lung metastatic nodules in animals that were injected intravenously with the pool of 23 clonal lines administered drinking water with no warfarin or water containing 10mg ml−1 of warfarin (P,0.05, Wilcoxon rank-sum, n = 10 mice). e, The pool of 23 clonal lines was injected orthotopically and the mice administered drinking water with no warfarin or 10mg ml−1 warfarin. The percentage abundance of each clone in the cardiovascular CTCs of animals (either pre- or post-injection, P < 0.002, n = 7 mice for no warfarin, n = 7 mice for pre-injection and n = 5 mice for post-injection). f, The clone proportions in the resultant primary tumours and lung metastases described in (e) (P<0.003, Wilcoxon rank-sum, for lung metastases, n = 7 mice for no warfarin, n = 7 mice for pre-injection and n = 5 mice for post-injection). For all box plots, the edges of the box are the twenty-fifth and seventy-fifth percentiles. The error bars extend to the values _q_3 + w(_q_3 − _q_1), and _q_1 − w(_q_3 − _q_1), in which w is 1.5 and _q_1 and _q_3 are the twenty-fifth and seventy-fifth percentiles.
Supplementary Material
Table s1
table s2
table s3
Acknowledgments
This work was supported by the Howard Hughes Medical Institute as well as grants from the NIH (G.J.H.). This work was performed with assistance from CSHL Shared Resources, which are funded, in part, by the Cancer Center Support Grant 5P30CA045508. We thank M. Mosquera, M. Cahn, J. Coblentz, L. Bianco for support with mouse work;J. Ratcliff and P. Moody for assistance with flow cytometry;D. Hoppe, A. Nourjanova, R. Puzis for histology support and S. Hearn for microscopy assistance. We thank E. Hodges and E. Lee for support with next-generation sequencing; K. Chang for the lentiviral barcode library; E. Mardis and C. Sawyers for comments on the manuscript. E. W. is a Starr Centennial Scholar and is supported by a fellowship from the Boehringer Ingelheim Fonds. J.C.H. and C.M.P. were supported by funds from the NCI Breast SPORE program (P50-CA58223-09A1), the Breast Cancer Research Foundation and the Triple Negative Breast Cancer Foundation. S.R.V.K. is supported by a fellowship from The Hope Funds For Cancer Research.
Footnotes
Online Content Methods, along with any additional Extended Data display items and Source Data,are available in the online version of the paper; references unique to these sections appear only in the online paper.
Supplementary Information is available in the online version of the paper.
Author Contributions: E.W., G.J.H. and S.R.V.K. designed the experiments. E.W., M.S., S.G., C.A.H., A.L.G., A.R.M., N.E., A.M.W., S.Y.K., S.D. and S.R.V.K. performed experiments and analysed data. J.C.H. and C.M.P. assisted with human expression data. A.D.S. helped with analysis. J.E.W. performed histological analysis. E.W., G.J.H. and S.R.V.K. wrote the paper. G.J.H. and S.R.V.K. supervised the research.
All raw and processed data is available through the Gene Expression Omnibus (GEO) under the accession number GSE63180.
The authors declare no competing financial interests.
Readers are welcome to comment on the online version of the paper.
References
- 1.Vanharanta S, Massague J. Origins of metastatic traits. Cancer Cell. 2013;24:410–421. doi: 10.1016/j.ccr.2013.09.007. [DOI] [PMC free article] [PubMed] [Google Scholar]
- 2.Miller FR, Miller BE, Heppner GH. Characterization of metastatic heterogeneity among subpopulations of a single mouse mammary tumor: heterogeneity in phenotypic stability. Invasion Metastasis. 1983;3:22–31. [PubMed] [Google Scholar]
- 3.Miller BE, Miller FR, Wilburn D, Heppner GH. Dominance of a tumor subpopulation line in mixed heterogeneous mouse mammary tumors. Cancer Res. 1988;48:5747–5753. [PubMed] [Google Scholar]
- 4.Fidler IJ, Kripke ML. Metastasis results from preexisting variant cells within a malignant tumor. Science. 1977;197:893–895. doi: 10.1126/science.887927. [DOI] [PubMed] [Google Scholar]
- 5.Fidler IJ. Tumor heterogeneity and the biology of cancer invasion and metastasis. Cancer Res. 1978;38:2651–2660. [PubMed] [Google Scholar]
- 6.Ding L, et al. Genome remodelling in a basal-like breast cancer metastasis and xenograft. Nature. 2010;464:999–1005. doi: 10.1038/nature08989. [DOI] [PMC free article] [PubMed] [Google Scholar]
- 7.Lohr JG, et al. Widespread genetic heterogeneity in multiple myeloma: implications for targeted therapy. Cancer Cell. 2014;25:91–101. doi: 10.1016/j.ccr.2013.12.015. [DOI] [PMC free article] [PubMed] [Google Scholar]
- 8.Mullighan CG, et al. Genomic analysis of the clonal origins of relapsed acute lymphoblastic leukemia. Science. 2008;322:1377–1380. doi: 10.1126/science.1164266. [DOI] [PMC free article] [PubMed] [Google Scholar]
- 9.Navin N, et al. Tumour evolution inferred by single-cell sequencing. Nature. 2011;472:90–94. doi: 10.1038/nature09807. [DOI] [PMC free article] [PubMed] [Google Scholar]
- 10.Braun S, et al. Cytokeratin-positive cells in the bone marrow and survival of patients with stage I, II, or III breast cancer. N Engl J Med. 2000;342:525–533. doi: 10.1056/NEJM200002243420801. [DOI] [PubMed] [Google Scholar]
- 11.Harrell JC, et al. Genomic analysis identifies unique signatures predictiveof brain, lung, and liver relapse. Breast Cancer Res Treat. 2012;132:523–535. doi: 10.1007/s10549-011-1619-7. [DOI] [PMC free article] [PubMed] [Google Scholar]
- 12.Amiano NO, et al. Anti-tumor effect of SLPI on mammary but not colon tumor growth. J Cell Physiol. 2013;228:469–475. doi: 10.1002/jcp.24153. [DOI] [PubMed] [Google Scholar]
- 13.Fayard B, et al. The serine protease inhibitor protease nexin-1 controls mammary cancer metastasis through LRP-1-mediated MMP-9 expression. Cancer Res. 2009;69:5690–5698. doi: 10.1158/0008-5472.CAN-08-4573. [DOI] [PubMed] [Google Scholar]
- 14.Martin KJ, Patrick DR, Bissell MJ, Fournier MV. Prognostic breast cancer signature identified from 3D culture model accurately predicts clinical outcome across independent datasets. PLoS ONE. 2008;3:e2994. doi: 10.1371/journal.pone.0002994. [DOI] [PMC free article] [PubMed] [Google Scholar]
- 15.Rosso M, et al. Secretory Leukocyte Protease Inhibitor (SLPI) expression downregulates E-cadherin, induces beta-catenin relocalisation and triggers apoptosis-related events in breast cancer cells. Biol. Cell. 2014;106:308–322. doi: 10.1111/boc.201300075. [DOI] [PubMed] [Google Scholar]
- 16.Sayers KT, Brooks AD, Sayers TJ, Chertov O. Increased secretory leukocyte protease inhibitor (SLPI) production by highly metastatic mouse breast cancer cells. PLoS ONE. 2014;9:e104223. doi: 10.1371/journal.pone.0104223. [DOI] [PMC free article] [PubMed] [Google Scholar]
- 17.Valiente M, et al. Serpins promote cancer cell survival and vascular co-option in brain metastasis. Cell. 2014;156:1002–1016. doi: 10.1016/j.cell.2014.01.040. [DOI] [PMC free article] [PubMed] [Google Scholar]
- 18.Maniotis AJ, et al. Vascular channel formation by human melanoma cells in vivo and in vitro: vasculogenic mimicry. Am J Pathol. 1999;155:739–752. doi: 10.1016/S0002-9440(10)65173-5. [DOI] [PMC free article] [PubMed] [Google Scholar]
- 19.Hendrix MJ, Seftor EA, Hess AR, Seftor RE. Vasculogenic mimicry and tumour-cell plasticity: lessons from melanoma. Nature Rev Cancer. 2003;3:411–421. doi: 10.1038/nrc1092. [DOI] [PubMed] [Google Scholar]
- 20.Folberg R, Hendrix MJ, Maniotis AJ. Vasculogenic mimicry and tumor angiogenesis. Am J Pathol. 2000;156:361–381. doi: 10.1016/S0002-9440(10)64739-6. [DOI] [PMC free article] [PubMed] [Google Scholar]
- 21.Ruf W, et al. Differential role of tissue factor pathway inhibitors 1 and 2 in melanoma vasculogenic mimicry. Cancer Res. 2003;63:5381–5389. [PubMed] [Google Scholar]
- 22.Cao Z, et al. Tumour vasculogenic mimicry is associated with poor prognosis of human cancer patients: a systemic review and meta-analysis. Eur J Cancer. 2013;49:3914–3923. doi: 10.1016/j.ejca.2013.07.148. [DOI] [PubMed] [Google Scholar]
- 23.Langmead B, Trapnell C, Pop M, Salzberg SL. Ultrafast and memory-efficient alignment of short DNA sequences to the human genome. Genome Biol. 2009;10:R25. doi: 10.1186/gb-2009-10-3-r25. [DOI] [PMC free article] [PubMed] [Google Scholar]
- 24.Langmead B, Salzberg SL. Fast gapped-read alignment with Bowtie2. Nature Methods. 2012;9:357–359. doi: 10.1038/nmeth.1923. [DOI] [PMC free article] [PubMed] [Google Scholar]
- 25.Anders S, Pyl PT, Huber W. HTSeq—A Python framework to work with high throughput sequencing data. Bioinformatics. 2015;31:166–169. doi: 10.1093/bioinformatics/btu638. [DOI] [PMC free article] [PubMed] [Google Scholar]
- 26.Anders S, Huber W. Differential expression analysis for sequence count data. Genome Biol. 2010;11:R106. doi: 10.1186/gb-2010-11-10-r106. [DOI] [PMC free article] [PubMed] [Google Scholar]
Associated Data
This section collects any data citations, data availability statements, or supplementary materials included in this article.
Supplementary Materials
Table s1
table s2
table s3
