Clinical Validation of Reduced Alcohol Consumption After Treatment for Alcohol Dependence Using the World Health Organization Risk Drinking Levels (original) (raw)
Abstract
Background
Alcohol use disorder (AUD) is a highly prevalent public health problem associated with considerable individual and societal costs. Abstinence from alcohol is the most widely accepted target of treatment for AUD, but it severely limits treatment options and could deter individuals who prefer to reduce their drinking from seeking treatment. Clinical validation of reduced alcohol consumption as the primary outcome of alcohol clinical trials is critical for expanding treatment options. One potentially useful measure of alcohol treatment outcome is a reduction in the World Health Organization (WHO, International Guide for Monitoring Alcohol Consumption and Related Harm. Geneva, Switzerland, 2000) risk levels of alcohol use (very high risk, high risk, moderate risk, and low risk). For example, a 2‐shift reduction in WHO risk levels (e.g., high risk to low risk) has been used by the European Medicines Agency (2010, Guideline on the Development of Medicinal Products for the Treatment of Alcohol Dependence. UK) to evaluate nalmefene as a treatment for alcohol dependence (AD; Mann et al. 2013, Biol Psychiatry 73, 706–13).
Methods
The current study was a secondary data analysis of the COMBINE study (n =1,383; Anton et al., 2006) to examine the association between reductions in WHO risk levels and reductions in alcohol‐related consequences and mental health symptoms during and following treatment in patients with AD.
Results
Any reduction in WHO risk drinking level during treatment was associated with significantly fewer alcohol‐related consequences and improved mental health at the end of treatment and for up to 1 year posttreatment. A greater reduction in WHO risk drinking level predicted a greater reduction in consequences and greater improvements in mental health.
Conclusions
Changes in WHO risk levels appear to be a valid end point for alcohol clinical trials. Based on the current findings, reductions in WHO risk drinking levels during treatment reflect meaningful reductions in alcohol‐related consequences and improved functioning.
Keywords: World Health Organization Risk Drinking Levels, Alcohol Dependence, Reduced Alcohol Consumption, Alcohol Treatment Outcomes, Harm Reduction
Harmful drinking and alcohol use disorders (AUD), including alcohol dependence (AD), are prevalent public health problems associated with considerable individual and societal costs (Bouchery et al., 2011; Whiteford et al., 2013; World Health Organization [WHO], 2014). Internationally, approximately 16% of drinkers engage in heavy episodic drinking (defined as consuming 60 g or more of alcohol per occasion), and the prevalence of AD exceeds 5% in many countries (WHO, 2014). Epidemiological data from 2012 through 2013 indicate that the lifetime prevalence of AUD was 29% in the United States (Grant et al., 2015).
For more than 100 years, abstinence from alcohol has been the most widely accepted outcome in the treatment of AD (Kraepelin, 1904). Abstinence may be the safest treatment outcome for many individuals, yet low‐risk drinking may be a reasonable alternative for some individuals. There is a growing appreciation of the benefits of reducing drinking, even in the absence of total abstinence (Aubin and Daeppen, 2013; Gastfriend et al., 2007), including significant reductions in morbidity and mortality (Laramée et al., 2015), lower healthcare costs (Kline‐Simon et al., 2014), and improved psychosocial functioning (Kline‐Simon et al., 2013; Witkiewitz, 2013). Numerous studies have provided evidence of the feasibility of reducing drinking to moderate, nonharmful levels, even among individuals who have previously been diagnosed with AD (Dawson et al., 2005; Hasin et al., 2013). Because AD is often described as a chronic disease, a focus on reducing harmful drinking can be an important aspect of disease management (Maremmani et al., 2015).
Acceptance of drinking reduction as a potential outcome of treatment may also lead affected individuals to be more willing to seek treatment for alcohol problems and in new settings (e.g., primary care) (Rehm et al., 2016). Individuals with AD often report fear of the stigma associated with being labeled an alcoholic and reluctance to stop drinking completely (Probst et al., 2015) as reasons to not seek treatment. The indiscriminate requirement of abstinence for all individuals, irrespective of their place on the AD continuum of severity, is a likely contributor to the current situation in which the majority of individuals with AD never seek treatment (Grant et al., 2015; Probst et al., 2015).
Abstinence as the primary end point also limits available treatment options. Despite empirical support for harm reduction approaches to treating AD, they are not as widely available as abstinence‐based approaches (Witkiewitz and Marlatt, 2006). The approval of medications to treat AD may have been limited, partially due to regulatory agencies historically requiring abstinence, a difficult target from a chronic disease perspective, as the primary end point in phase III clinical trials (Litten et al., 2014). The requirement of abstinence as a primary end point has been proposed as a surrogate marker of how a person “feels and functions” (Food and Drug Administration, 2015), with the assumption that an individual who is not drinking is likely to feel better and function at a higher level than the individual who continues drinking. Importantly, empirical research shows that low‐risk drinking is associated with a substantial improvement in functioning, similar to that achieved with abstinence (Kline‐Simon et al., 2013; Witkiewitz, 2013; Witkiewitz et al., 2017). Thus, low‐risk drinking may also be a surrogate for improvements in functioning.
Recently, both the European Medicines Agency (EMA) and the U.S. Food and Drug Administration (FDA) have accepted reduced drinking (EMA, 2010) or low‐risk drinking (FDA, 2015) as alternative end points for alcohol medication development. In its approval of Vivitrol in 2006 (FDA, 2006) and in more recent draft guidance (FDA, 2015), the FDA proposed that for phase III clinical trials, no heavy drinking days (i.e., low‐risk drinking or abstinence) be used in addition to abstinence as a primary outcome (FDA, 2015). No heavy drinking days is defined as: number of occasions on which women consume more than 3 drinks and men consume more than 4 drinks.
The EMA guidance (2010) describes an intermediate harm reduction strategy as a primary end point that includes measuring reductions in total alcohol consumption (grams of ethanol [EtOH] per day) and reductions in heavy drinking days (with heavy drinking defined as 40 g of EtOH for women and 60 g of EtOH for men). Another option endorsed by the EMA is the proportion of subjects with a significant categorical shift in WHO risk levels of drinking which, as is shown in Table 1, is defined as at least a 2‐level reduction from “very high risk” to at most “medium risk” or a reduction from “high risk” to at most “low risk.” The WHO risk levels (WHO, 2000) were based on 16 cohort studies conducted in Australia in the early 1990s, which showed increased mortality risk at each of the sex‐specific levels of alcohol consumption (English et al., 1995). In a placebo‐controlled trial of nalmefene for reducing alcohol consumption (Aubin et al., 2015), the 2‐level categorical shift in WHO risk level showed a statistically significant medication group difference. However, no other published studies have evaluated the sensitivity of this end point in a sample of patients with AD. Importantly, the shift in WHO risk level as an end point has not been validated by, for example, examining how changes in it relate to changes in alcohol consequences and functioning, information that is crucial to both the regulatory process and clinicians’ ability to evaluate clinical trial data and their treatment implications.
Table 1.
World Health Organization (WHO) Risk Levels and Frequencies (N [%]) at Each Risk Level in the COMBINE Trial
| WHO risk level (grams (g) of pure alcohol per day for males/females) | Baseline (past 3 months) (%) | End of treatment (past 2 months) (%) | End of treatment (past 1 month) (%) |
|---|---|---|---|
| Abstinence (0 g) | 0 (0.0) | 376 (28.8) | 459 (35.7) |
| Low risk (1 to 40 g/1 to 20 g) | 45 (3.3) | 613 (47.0) | 503 (39.1) |
| Medium risk (41 to 60 g/21 to 40 g) | 158 (11.4) | 124 (9.5) | 126 (10.0) |
| High risk (61 to 100 g/41 to 60 g) | 360 (26.0) | 85 (6.1) | 88 (6.8) |
| Very high risk (101+ g/61+ g) | 820 (59.3) | 106 (8.1) | 111 (8.6) |
| Change in WHO risk level | Baseline (past 3 months) to the end of treatment (past 2 months) (%) | Baseline (past 3 months) to the end of treatment (past 1 month) (%) |
|---|---|---|
| Increase | 14 (1.1) | 14 (1.1) |
| No change | 151 (11.6) | 157 (12.2) |
| Decrease 1 level | 213 (16.3) | 200 (15.5) |
| Decrease 2 levels | 293 (22.5) | 283 (22.0) |
| Decrease 3 levels | 404 (29.2) | 360 (28.0) |
| Decrease 4 levels | 229 (16.6) | 273 (21.2) |
In view of the need to validate shifts in WHO risk drinking levels using large‐scale, clinical trial data, this study examined shifts in drinking levels as a surrogate measure of patient functioning. Using data from 1,383 participants in a multisite clinical trial for AD, we examined the concurrent and predictive validity of reductions in WHO risk levels using predefined, clinically meaningful measures of patient functioning.
Materials and Methods
Participants and Procedures
Data were derived from the COMBINE study (Anton et al., 2006), a 16‐week, U.S. multisite randomized double‐blind clinical trial that evaluated combinations of medications (acamprosate, naltrexone, or matched placebos) and behavioral interventions (medication management or combined behavioral intervention [CBI]) in the treatment of AD. Participants with AD were randomized into 1 of 8 treatment conditions using a 2 × 2 × 2 design, with participants receiving: (i) active naltrexone (100 mg/d) or placebo naltrexone, (ii) active acamprosate (3,000 mg/d) or placebo acamprosate, and (iii) medication management with a CBI or medication management alone. A ninth treatment condition received only CBI with no study drug. Participants completed follow‐up assessments at the end of treatment (week 16) and at 3 follow‐ups: 10 weeks (week 26), 26 weeks (week 52), and 1 year following treatment (week 68). COMBINE participants (n =1,383) were largely male (68.8%) and non‐Hispanic White (76.7%) [Black/African American (7.9%), Asian (0.3%), Hispanic (11.2%), American Indian/Alaskan Native (1.3%), multiracial (1.3%), and other race (1.2%)], with mean age 44.43 years (SD = 10.19).
Measures
Daily alcohol consumption was measured using calendar‐based methods, via the Form‐90 (Miller, 1996) and Timeline Follow‐Back interview (Sobell and Sobell, 1992). Consistent with EMA guidelines (EMA, 2010), we calculated WHO drinking risk levels (see Table 1) based on patient reports of the number of standard drinks (defined as 0.6 ounces of absolute alcohol) consumed, which were converted to grams of pure alcohol (0.6 ounces = 14 g). WHO risk levels were then calculated based on the average grams of alcohol consumed per day (i.e., drinks per day). A separate category for abstinence was not included in the original WHO risk levels (WHO, 2000); rather, abstinence was included in the low‐risk drinking category. However, given the prominence of abstinence as a goal of alcohol treatment and an outcome in clinical trials, we included it here as a fifth risk level. For the baseline period, we calculated the WHO risk levels using data from the 3 months prior to the last drink before randomization. For the end‐of‐treatment WHO risk level, follow‐up periods were based on the time period specified for the measure of functioning. Specifically, to match the time interval captured by the measure of drinking consequences, we defined WHO risk as the average grams of alcohol consumed over the 2 months prior to the end of treatment. To match the time interval captured by the measure of mental health, we defined WHO risk as the average grams of alcohol per day consumed over the month prior to the end of treatment. For all analyses, a reduction in risk level was computed by subtracting the end‐of‐treatment WHO risk levels, assessed at week 16, from the baseline WHO risk levels, resulting in 4 binary risk reduction variables: a 1‐level decrease, a 2‐level decrease, a 3‐level decrease, and a 4‐level decrease. For all analyses, we compared these 4 variables to a reference group that did not change its WHO risk level.
Alcohol‐related consequences were assessed with the Drinker Inventory of Consequences (DrInC; Miller et al., 1995), a 50‐item measure that uses a 4‐level response scale (0 = never, 3 = daily or almost daily). We used the DrInC total score (based on 45 drinking consequences, excluding the 5 control items) to assess alcohol‐related consequences over the prior 3 months at baseline, the prior 2 months at the end of treatment (week 16), and the prior 4 months at the 1‐year follow‐up (week 68, 1 year posttreatment). DrInC internal consistency and reliability exceeded Cronbach's α = 0.93 at all time periods. Mental health was assessed using the 12‐item Short Form Health Survey (SF‐12; Ware et al., 1996) mental health subscale, which included 6 items assessed on a Likert‐type response scale (1 = all of the time, 5 = none of the time). We used _T_‐scores (with average functioning of 50 and standard deviation of 10 in the general population) from the SF‐12 mental health subscale, with higher scores indicating better mental health functioning over the past month at baseline, the end of treatment (week 16), and the last follow‐up at which the SF‐12 was administered (week 52, 9 months posttreatment). The reliability of the SF‐12 items exceeded Cronbach's α = 0.80 at all time periods.
Statistical Analysis
Descriptive analyses examined the frequency of participants categorized by each of the WHO risk levels at baseline and the end of treatment, as well as changes in WHO risk drinking levels from baseline to the end of treatment using cross‐tabulation and chi‐square tests of independence.
To examine the concurrent and predictive validity of reductions in WHO risk levels, we used multiple regression analyses with DrInC and SF‐12 mental health scores at the end of treatment (concurrent validity test) and up to 1‐year follow‐up (predictive validity test) regressed on reductions in WHO risk levels from baseline to the end of treatment. For all regression models, we controlled for the following covariates: baseline DrInC or SF‐12 mental health subscale, age, sex, race/ethnicity, years of education, body mass index, smoking status, and WHO risk level at baseline.
Sensitivity analyses examined 4 alternative definitions of the change in WHO risk level, including (i) WHO risk based on average grams of alcohol consumed per drinking day (rather than “_per day_”; provided in Tables S1 and S2, Figs S1 and S2), (ii) WHO risk based on both grams per day and grams per drinking day with reductions to abstinence examined as a separate category (e.g., if an individual decreased 2 levels from moderate risk to abstinence, then they were categorized as having reduced to abstinence, rather than categorized as having a 2‐level decrease; results not shown), (iii) WHO risk based on both grams per day and grams per drinking day with either no change or an increase in the WHO risk as the reference group (results not shown), and (iv) analyses that examined baseline WHO risk as a moderator variable in predicting change in WHO risk based on both grams per day and grams per drinking day (results not shown). In addition, we ran a fifth sensitivity analysis to examine whether the results were robust to missing data (<7% had missing drinking data in the COMBINE study) using multiple imputation methods to estimate the models (Hallgren and Witkiewitz, 2013). Finally, we conducted additional analyses with the subscales of the DrInC. Results from the 5 sensitivity analyses and the analysis of the DrInC subscales were not substantively different from the results described below.
Results
The frequencies of participants categorized at each WHO risk level based on the past 3 months at baseline and both the past 2 months and the past 1 month at the end of treatment are shown in Table 1. At baseline, the majority of individuals (59%) were in the “very high‐risk” category (drinking over 101/61 [males/females] grams of pure alcohol per day on average) and there were no abstainers. At the end of treatment (for the past 2‐month time frame), see Table 1 and Fig. 1, 29% of the sample achieved abstinence, 47% were categorized as “low‐risk” drinkers, 10% were categorized as “medium‐risk” drinkers, 7% were categorized as “high‐risk drinkers”, and 8% were categorized as “very high‐risk” drinkers. These rates were comparable to those in the 1‐month end‐of‐treatment time frame (Table 1), although in the last month more participants achieved abstinence (36%) and were in the low‐risk category (39%).
Figure 1.
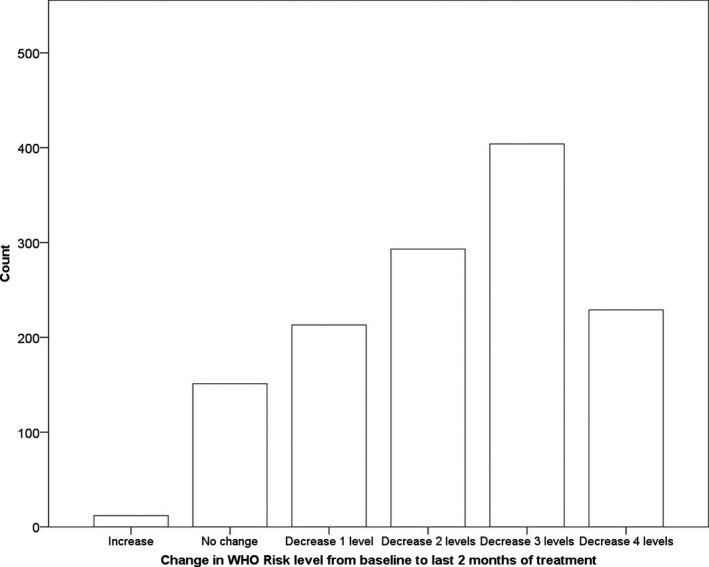
Histogram (count) of individuals who had an increase, no change, or decrease in WHO risk level from baseline to the end of treatment.
There were significant changes in WHO risk levels from baseline to the end of treatment regardless of the time frame used to determine risk (Table 1). For example, comparing the past 3 months at baseline to the last 2 months of treatment, χ2(12) = 98.16, p <0.001, approximately 1% of individuals increased from a lower risk level to a higher risk level, 12% did not change risk levels, 16% decreased 1 risk level, 22% decreased 2 risk levels, 29% decreased 3 risk levels, and 17% decreased 4 risk levels. Of participants who were low risk at baseline, 40% decreased to abstinence and 60% remained low risk. Of those who were moderate risk at baseline, 26% decreased to abstinence, 64% decreased to low risk, 6% remained moderate risk, and 4% increased to a higher risk level. Of individuals who were high risk at baseline, 27% decreased to abstinence, 53% decreased to low risk, 12% decreased to moderate risk, 6% remained high risk, and 2% increased to a higher risk level. Of individuals who were very high risk at baseline, 30% decreased to abstinence, 40% decreased to low risk, 10% decreased to moderate risk, 8% decreased to high risk, and 12% remained very high risk.
Effect sizes (Cohen's d) and the average change in WHO risk level associated with the DrInC and SF‐12 outcomes are shown in Figs 2 and 3. Reductions in WHO risk level from baseline to the end of treatment and to the 1‐year follow‐up were associated with large effect size reductions in alcohol‐related consequences (Fig. 2) and medium effect size improvements in mental health (Fig. 3). Even a 1‐level decrease in WHO risk was associated with a reduction in consequences and increases in mental health functioning at the end‐of‐treatment assessment.
Figure 2.
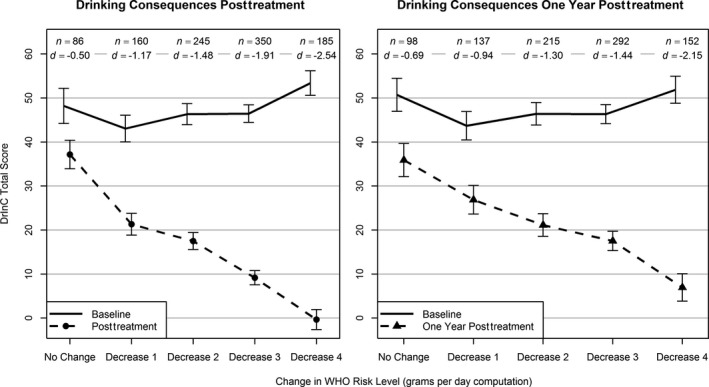
Average Drinker Inventory of Consequences (DrInC) total scores by change in WHO risk level from baseline (solid line) to the end of treatment and posttreatment (dashed lines). Vertical bars indicate 95% confidence intervals (CIs). n = number of participants with data available for analysis within each level of WHO risk change. d = Cohen's d effect size, computed as the difference in means from baseline to follow‐up within each level of WHO risk change divided by the standard deviation at baseline within the same level of WHO risk change. All means and 95% CIs (baseline and follow‐up) were estimated using linear regression and controlled for age at baseline, gender, race, education, body mass index at baseline, and smoker status at baseline; follow‐up estimates also controlled for baseline values of the dependent variable and baseline WHO risk level. All control variables were grand‐mean‐centered.
Figure 3.
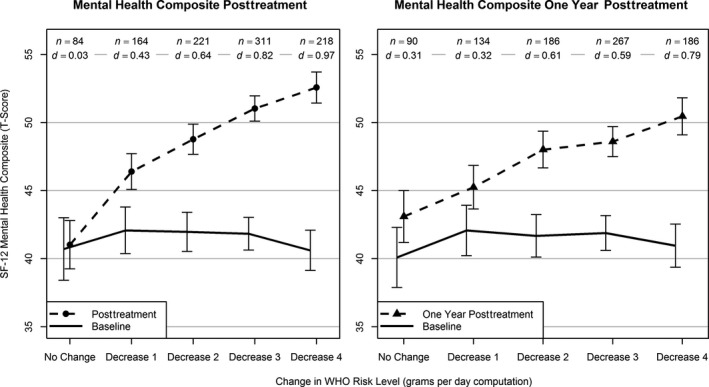
Average 12‐item Short Form Health Survey (SF‐12) Mental Health Composite Scores by change in WHO risk level from baseline (solid line) to the end of treatment and posttreatment (dashed lines). Vertical bars indicate 95% confidence intervals (CIs). n = number of participants with data available for analysis within each level of WHO risk change. d = Cohen's d effect size, computed as the difference in means from baseline to follow‐up within each level of WHO risk change divided by the standard deviation at baseline within the same level of WHO risk change. All means and 95% CIs (baseline and follow‐up) were estimated using linear regression and controlled for age at baseline, gender, race, education, body mass index at baseline, and smoker status at baseline; follow‐up estimates also controlled for baseline values of the dependent variable and baseline WHO risk level. All control variables were grand‐mean‐centered.
Regression analyses examined changes in WHO risk levels as a predictor of alcohol‐related consequences, assessed via the DrInC, and mental health symptoms, assessed via the SF‐12, at the end of treatment and at 1‐year follow‐up. As shown in Table 2, any decrease in the WHO risk level from baseline to the end of treatment was associated with significantly lower DrInC scores and significantly higher mental health scores on the SF‐12 at the end of treatment. Greater decreases in WHO risk predicted fewer alcohol‐related consequences and greater mental health functioning. Regardless of the time frame, even a 1‐level decrease in WHO risk predicted significantly fewer alcohol‐related consequences. Similarly, at least a 1‐level decrease in WHO risk predicted significantly greater mental health at the end of treatment and a 2‐level decrease in WHO risk predicted significantly greater mental health at the follow‐up.
Table 2.
Concurrent and Predictive Validity of Changes in World Health Organization (WHO) Risk Levels in Predicting End of Treatment and Follow‐Up Alcohol‐Related Consequences (DrInC) and Mental Health Symptoms (SF‐12) with No Change in WHO Risk as Reference Group
| Decrease in risk level from baseline to the end of treatment | DrInC total end of treatment | DrInC total 1‐year follow‐up | Mental health end of treatment | Mental health 9‐month follow‐up | ||||
|---|---|---|---|---|---|---|---|---|
| B (SE) | 95% CI | B (SE) | 95% CI | B (SE) | 95% CI | B (SE) | 95% CI | |
| Increase in WHO risk | 12.80 (6.76) | −0.45, 26.06 | 12.99 (8.57) | −3.81, 29.82 | 4.14 (2.91) | −1.57, 9.85 | 1.85 (3.85) | −5.70, 9.40 |
| Decrease 1 level | −13.17 (1.98)*** | −17.05, −9.28 | −5.68 (2.51)* | −10.61, −0.76 | 4.83 (1.13)*** | 2.60, 7.05 | 1.29 (1.29) | −1.24, 3.82 |
| Decrease 2 levels | −20.61 (1.83)*** | −24.19, −17.03 | −14.63 (2.27)*** | −19.07, −10.19 | 7.85 (1.06)*** | 5.77, 9.94 | 4.86 (1.18)*** | 2.53, 7.18 |
| Decrease 3 levels | −32.54 (1.83)*** | −36.13, −28.95 | −21.72 (2.22)*** | −26.08, −17.36 | 10.50 (1.04)*** | 8.46, 12.55 | 6.00 (1.14)*** | 3.76, 8.23 |
| Decrease 4 levels | −42.88 (2.02)*** | −46.85, −38.92 | −32.95 (2.50)*** | −37.85, −28.04 | 12.22 (1.12)*** | 10.03, 14.40 | 7.99 (1.23)*** | 5.58, 10.40 |
Sensitivity analyses provided similar results when WHO risk was defined by grams per drinking day, when a decrease to abstinence was modeled as a separate category, when the reference group was no change or an increase in WHO risk, when baseline WHO risk was included in the model as a moderator (i.e., interaction) variable, and when the models were estimated using multiple imputation methods to accommodate missing data. Finally, the pattern of results was consistent when examining each of the DrInC subscales.
Discussion
Longitudinal analyses of individuals with AD who received pharmacotherapy and/or behavioral treatment as part of the COMBINE study indicated that reductions in WHO risk drinking levels from baseline to the end of treatment were significantly associated with improvements in functioning at the end of treatment and up to 1 year following treatment. A 1‐level decrease in the WHO risk level predicted a significantly lower alcohol‐related consequences score, as measured by the DrInC, and significantly better mental health, as measured by the SF‐12. Although greater reductions in WHO risk levels predicted greater improvements in functioning, even the 1‐level decrease was associated with large improvements in functioning, especially at the end of treatment. Consistent results were obtained regardless of whether the WHO risk was defined by grams per day or grams per drinking day (Tables S1 and S2).
The current findings are consistent with recent empirical work showing that reductions in drinking and drinking at lower risk levels are associated with significant improvements in functioning (Kline‐Simon et al., 2013; Laramée et al., 2015; Witkiewitz, 2013; Witkiewitz et al., 2017). The current study provides evidence of the concurrent and predictive validity of the WHO risk levels of drinking as a surrogate end point in alcohol clinical trials (Aubin et al., 2015; Mann et al., 2013) and suggests that even a 1‐shift reduction in WHO risk levels is associated with significant reductions in alcohol‐related consequences and significant improvements in mental health functioning. The findings with an alcohol‐dependent sample also map onto the recent findings of Hasin and colleagues (under review) in a general population sample, who found that reductions in the WHO risk level over a 3‐year period were associated with a significantly lower risk of AD at the 3‐year follow‐up, even among individuals who were alcohol dependent initially.
While there was a minimal amount of missing data in the COMBINE study (<7% missing data), missing data and the reliance on complete case analysis in the current study could have biased the results (Hallgren and Witkiewitz, 2013). To examine the potential bias in missing data, we reestimated all models using multiple imputation methods for handling missing data and found no differences in the substantive conclusions, suggesting that the current results are robust across different missing data models. No studies have examined methods for handling missing data in WHO risk levels and this is an important area for future research.
The current study also has limitations. First, the study relied on secondary data analyses and thus was limited to questions that could be asked with the available data. For example, it would be helpful to have other measures of patient functioning, including measures of social and interpersonal functioning, as well as detailed information on employment and healthcare utilization. A recent study using the COMBINE economic data found that low‐risk drinking at the end of treatment in COMBINE was associated with significant reductions in healthcare costs over time (Aldridge et al., 2016) and it would be useful to examine the association between the WHO risk level reductions and healthcare costs in COMBINE.
In conclusion, the WHO risk levels appear to be a useful surrogate end point for alcohol clinical trials that provide a harm reduction‐based alternative to abstinence as a primary end point. Reductions in WHO risk corresponded to significant and meaningful reductions in alcohol‐related consequences and improvements in mental health functioning for up to 1 year following treatment. This study adds to the growing body of literature supporting reduced alcohol consumption as an alternative to abstinence as an end point for alcohol clinical trials. In summary, the 1‐shift reduction in WHO risk is a very promising end point for alcohol clinical trials and future research should validate the utility of the 1‐shift reduction in WHO risk level for this purpose.
Disclosures
Dr. Kranzler has been a consultant, advisory board member, or CME lecturer for Lundbeck, Otsuka, and Indivior. Dr. Mann received honoraria for consultancies from Pfizer, Novartis, and Abbvie and speaker fees from Lundbeck. Dr. Hasin is principal investigator of a study funded by inVentiv Health Consulting that combines support from Actavis, Inc.; Endo Pharmaceuticals; Janssen Pharmaceuticals, Inc.; Mallinckrodt, LLC; Pfizer, Inc.; Purdue Pharma, L.P.; Rhodes Pharmaceuticals, L.P.; Roxane Laboratories, Inc.; and Zogenix, Inc. Dr. O'Malley reports personal fees from Alkermes, grants from Lilly, personal fees from Hazelden Betty Ford Foundation, other (study drug) from Pfizer, Astra Zeneca, other (consulting agreement) from Cerecor, Amygdala, outside the submitted work. Dr. Anton has been a consultant in the recent past for Lilly, Lundbeck, Novartis, Indivior, and Alkermes, and on Advisory Boards for Alkermes, Indivior, and Lundbeck. Drs. Witkiewitz, Kranzler, Mann, Hasin, Falk, Litten, O'Malley, and Anton are members of the American Society of Clinical Psychopharmacology's Alcohol Clinical Trials Initiative (ACTIVE Group), which over the time that this paper was developed was supported by Abbvie, Alkermes, Ethypharm, Indivior, Lilly, Lundbeck, Otsuka, Pfizer, and Xenoport. Drs. Hallgren, Falk, and Litten have no disclosures.
Supporting information
Fig. S1. Average Drinker Inventory of Consequences (DrInC) total scores by change in WHO risk level based on grams per drinking day from baseline (solid line) to end of treatment and posttreatment (dashed lines).
Fig. S2. Average 12‐item Short Form Health Survey (SF‐12) mental health composite scores by change in WHO risk level based on grams per drinking day from baseline (solid line) to end of treatment and posttreatment (dashed lines).
Table S1. World Health Organization (WHO) risk levels based on grams of alcohol per drinking day and frequencies (N [%]) at each risk level at baseline and end of treatment.
Table S2. Concurrent and predictive validity of changes in World Health Organization (WHO) risk levels based on grams of alcohol per drinking day in predicting end of treatment and follow‐up alcohol‐related consequences (DrInC) and mental health symptoms (SF‐12).
Acknowledgments
This study was funded by the U.S. National Institute on Alcohol Abuse and Alcoholism (R01AA022328, T32AA007455). In addition to the authors, the following individuals are or were members of the Alcohol Clinical Trials Initiative (ACTIVE) Workgroup and provided intellectual input into this manuscript during attendance at Workgroup meetings: Joanne Fertig, PhD, National Institute on Alcohol Abuse and Alcoholism; Keith Isenberg, MD, Anthem Blue Cross Blue Shield; David McCann, PhD, National Institute on Drug Abuse; Didier Meulien, MD, Lundbeck SAS; Roger Meyer, MD, Best Practice Project Management, Inc.; Charles O'Brien, MD, PhD, University of Pennsylvania; Megan Ryan, PhD, National Institute on Alcohol Abuse and Alcoholism; Bernard Silverman, MD, Alkermes, Inc.; Francoise Trinquet, MD, Ethypharm; Benjamin Zakine, MD, Ethypharm. Lindsay Snyder and Sarah Timm (ASCP) provided important administrative support to the ACTIVE workgroup.
The copyright line for this article was changed on 13 January 2017 after original online publication.
References
- Aldridge A, Zarkin GA, Dowd W, Bray JW (2016) The relationship between end of treatment alcohol use and subsequent health care costs: do heavy drinking days predict higher health care costs? Alcohol Clin Exp Res 40:1122–1128. [DOI] [PMC free article] [PubMed] [Google Scholar]
- Anton RF, O'Malley SS, Ciraulo DA, Cisler RA, Couper D, Donovan DM, Gastfriend DR, Hosking JD, Johnson BA, LoCastro JS, Longabaugh R, Mason BJ, Mattson ME, Miller WR, Pettinati HM, Randall CL, Swift R, Weiss RD, Williams LD, Zweben A (2006) Combined pharmacotherapies and behavioral interventions for alcohol dependence: the COMBINE study: a randomized controlled trial. JAMA 295:2003–2017. [DOI] [PubMed] [Google Scholar]
- Aubin H‐J, Daeppen J‐B (2013) Emerging pharmacotherapies for alcohol dependence: a systematic review focusing on reduction in consumption. Drug Alcohol Depend 133:15–29. [DOI] [PubMed] [Google Scholar]
- Aubin H‐J, Reimer J, Nutt DJ, Bladström A, Torup L, François C, Chick J (2015) Clinical relevance of as‐needed treatment with nalmefene in alcohol‐dependent patients. Eur Addict Res 21:160–168. [DOI] [PubMed] [Google Scholar]
- Bouchery EE, Harwood HJ, Sacks JJ, Simon CJ, Brewer RD (2011) Economic costs of excessive alcohol consumption in the US, 2006. Am J Prev Med 41:516–524. [DOI] [PubMed] [Google Scholar]
- Dawson DA, Grant BF, Stinson FS, Chou PS, Huang B, Ruan WJ (2005) Recovery from DSM‐IV alcohol dependence: United States, 2001–2002. Addiction 100:281–292. [DOI] [PubMed] [Google Scholar]
- English DR, Holman CDJ, Milne E, Winter MG, Hulse GK, Codde JP, Bower CI, Corti B, de Klerk N, Knuiman MW, Kurinczuk JJ, Lewin GF, Ryan GA (1995) The Quantification of Drug Caused Morbidity and Mortality in Australia, 1995 Edition Commonwealth Department of Human Services and Health, Canberra, ACT. [Google Scholar]
- European Medicines Agency (2010) Guideline on the Development of Medicinal Products for the Treatment of Alcohol Dependence European Medicines Agency, London, UK. [Google Scholar]
- Food and Drug Administration (2006) Medical Review of Vivitrol: 21‐897 Food and Drug Administration, Rockville, MD. [Google Scholar]
- Food and Drug Administration (2015) Alcoholism: Developing Drugs for Treatment (No. FDA D‐0152‐001) Food and Drug Administration, Silver Spring, MD. [Google Scholar]
- Gastfriend DR, Garbutt JC, Pettinati HM, Forman RF (2007) Reduction in heavy drinking as a treatment outcome in alcohol dependence. J Subst Abuse Treat 33:71–80. [DOI] [PubMed] [Google Scholar]
- Grant BF, Goldstein RB, Saha TD, Chou SP, Jung J, Zhang H, Pickering RP, Ruan WJ, Smith SM, Huang B, Hasin DS (2015) Epidemiology of DSM‐5 Alcohol Use Disorder: results from the National Epidemiologic Survey on Alcohol and Related Conditions III. JAMA Psychiatry 72:757–766. [DOI] [PMC free article] [PubMed] [Google Scholar]
- Hallgren KA, Witkiewitz K (2013) Missing data in alcohol clinical trials: a comparison of methods. Alcohol Clin Exp Res 37:2152–2160. [DOI] [PMC free article] [PubMed] [Google Scholar]
- Hasin DS, Aharonovich E, O'Leary A, Greenstein E, Pavlicova M, Arunajadai S, Waxman R, Wainberg M, Helzer J, Johnston B (2013) Reducing heavy drinking in HIV primary care: a randomized trial of brief intervention, with and without technological enhancement. Addiction 108:1230–1240. [DOI] [PMC free article] [PubMed] [Google Scholar]
- Hasin DS, Wall M, Witkiewitz K, Kranzler HR, Falk DE, Litten RZ, Mann K, O'Malley SS, Scodes J, Robinson RL, Anton R (under review) Change in non‐abstinent WHO risk drinking levels and alcohol dependence: a 3‐year follow‐up study in the United States general population. Lancet Psychiatry. [DOI] [PMC free article] [PubMed] [Google Scholar]
- Kline‐Simon AH, Falk DE, Litten RZ, Mertens JR, Fertig J, Ryan M, Weisner CM (2013) Posttreatment low‐risk drinking as a predictor of future drinking and problem outcomes among individuals with alcohol use disorders. Alcohol Clin Exp Res 37(Suppl 1):E373–E380. [DOI] [PMC free article] [PubMed] [Google Scholar]
- Kline‐Simon AH, Weisner CM, Parthasarathy S, Falk DE, Litten RZ, Mertens JR (2014) Five‐year healthcare utilization and costs among lower‐risk drinkers following alcohol treatment. Alcohol Clin Exp Res 38:579–586. [DOI] [PMC free article] [PubMed] [Google Scholar]
- Kraepelin E (1904) Lecture XVIII: chronic alcoholism, in Lectures on Clinical Psychiatry (Johnstone T. ed), pp 171–179. William Wood & Co, New York, NY. [Google Scholar]
- Laramée P, Leonard S, Buchanan‐Hughes A, Warnakula S, Daeppen J‐B, Rehm J (2015) Risk of all‐cause mortality in alcohol‐dependent individuals: a systematic literature review and meta‐analysis. EBioMedicine 2:1394–1404. [DOI] [PMC free article] [PubMed] [Google Scholar]
- Litten RZ, Falk DE, Ryan M, Fertig J (2014) Research opportunities for medications to treat alcohol dependence: addressing stakeholders’ needs. Alcohol Clin Exp Res 38:27–32. [DOI] [PubMed] [Google Scholar]
- Mann K, Bladström A, Torup L, Gual A, van den Brink W (2013) Extending the treatment options in alcohol dependence: a randomized controlled study of as‐needed nalmefene. Biol Psychiatry 73:706–713. [DOI] [PubMed] [Google Scholar]
- Maremmani I, Cibin M, Pani PP, Rossi A, Turchetti G (2015) Harm reduction as “Continuum Care” in alcohol abuse disorder. Int J Environ Res Public Health 12:14828–14841. [DOI] [PMC free article] [PubMed] [Google Scholar]
- Miller WR (1996) Form 90: A Structured Assessment Interview for Drinking and Related Behaviors National Institute on Alcohol Abuse and Alcoholism, Bethesda, MD. [Google Scholar]
- Miller WR, Tonigan JS, Longabaugh R (1995) The Drinker Inventory of Consequences (DrInC) National Institute on Alcohol Abuse and Alcoholism, Bethesda, MD. [Google Scholar]
- Probst C, Manthey J, Martinez A, Rehm J (2015) Alcohol use disorder severity and reported reasons not to seek treatment: a cross‐sectional study in European primary care practices. Subst Abuse Treat Prev Policy 10:32. [DOI] [PMC free article] [PubMed] [Google Scholar]
- Rehm J, Anderson P, Manthey J, Shield KD, Struzzo P, Wojnar M, Gual A (2016) Alcohol use disorders in primary health care: What do we know and where do we go? Alcohol Alcohol 51:422–427. [DOI] [PubMed] [Google Scholar]
- Sobell LC, Sobell MB (1992) Timeline follow‐back: a technique for assessing self‐reported ethanol consumption, in Measuring Alcohol Consumption: Psychosocial and Biological Methods (Allen J, Litten RZ. eds), pp. 41–72. Humana Press, Totowa, NJ. [Google Scholar]
- Ware JE, Kosinski M, Keller SD (1996) A 12‐Item Short‐Form Health Survey: construction of scales and preliminary tests of reliability and validity. Med Care 34:220–233. [DOI] [PubMed] [Google Scholar]
- Whiteford HA, Degenhardt L, Rehm J, Baxter AJ, Ferrari AJ, Erskine HE, Charlson FJ, Norman RE, Flaxman AD, Johns N, Burstein R, Murray CJL, Vos T (2013) Global burden of disease attributable to mental and substance use disorders: findings from the Global Burden of Disease Study 2010. Lancet 382:1575–1586. [DOI] [PubMed] [Google Scholar]
- Witkiewitz K (2013) “Success” following alcohol treatment: moving beyond abstinence. Alcohol Clin Exp Res 37(Suppl 1):E9–E13. [DOI] [PubMed] [Google Scholar]
- Witkiewitz K, Marlatt GA (2006) Overview of harm reduction treatments for alcohol problems. Int J Drug Policy 17:285–294. [Google Scholar]
- Witkiewitz K, Roos CR, Pearson MR, Hallgren KA, Maisto SA, Kirouac M, Forcehimes AA, Wilson AD, Robinson CS, McCallion E, Tonigan JS, Heather N (2017) How much is too much? Patterns of drinking during alcohol treatment and associations with post‐treatment outcomes across three alcohol clinical trials. J Stud Alcohol Drugs doi:10.15288/jsad.2017.78.59. [DOI] [PMC free article] [PubMed] [Google Scholar]
- World Health Organization (WHO) (2000) International Guide for Monitoring Alcohol Consumption and Related Harm World Health Organization, Geneva, Switzerland. [Google Scholar]
- World Health Organization (WHO) (2014) Global Status Report on Alcohol and Health World Health Organization, Geneva, Switzerland. [Google Scholar]
Associated Data
This section collects any data citations, data availability statements, or supplementary materials included in this article.
Supplementary Materials
Fig. S1. Average Drinker Inventory of Consequences (DrInC) total scores by change in WHO risk level based on grams per drinking day from baseline (solid line) to end of treatment and posttreatment (dashed lines).
Fig. S2. Average 12‐item Short Form Health Survey (SF‐12) mental health composite scores by change in WHO risk level based on grams per drinking day from baseline (solid line) to end of treatment and posttreatment (dashed lines).
Table S1. World Health Organization (WHO) risk levels based on grams of alcohol per drinking day and frequencies (N [%]) at each risk level at baseline and end of treatment.
Table S2. Concurrent and predictive validity of changes in World Health Organization (WHO) risk levels based on grams of alcohol per drinking day in predicting end of treatment and follow‐up alcohol‐related consequences (DrInC) and mental health symptoms (SF‐12).