Pathway of processive ATP hydrolysis by kinesin (original) (raw)
. Author manuscript; available in PMC: 2007 Apr 24.
Published in final edited form as: Nature. 1995 Feb 23;373(6516):671–676. doi: 10.1038/373671a0
Abstract
Direct measurement of the kinetics of kinesin dissociation from microtubules, the release of phosphate and ADP from kinesin, and rebinding of kinesin to the microtubule have defined the mechanism for the kinesin ATPase cycle. The processivity of ATP hydrolysis is ten molecules per site at low salt concentration but is reduced to one ATP per site at higher salt concentration. Kinesin dissociates from the microtubule after ATP hydrolysis. This step is rate-limiting. The subsequent rebinding of kinesin · ADP to the microtubule is fast, so kinesin spends only a small fraction of its duty cycle in the dissociated state. These results provide an explanation for the motility differences between skeletal myosin and kinesin.
Kinesin, a microtubule-activated ATPase, functions as a cytoplasmic motor to drive organelle translocation toward the plus ends of microtubules1-3. The principles governing the conversion of chemical energy from ATP hydrolysis to force production for the sliding of kinesin along microtubules may be similar to those for actomyosin and the axonemal dynein–microtubule ATPases4,5. However, the motility of single motor molecules in vitro suggests that mechanochemical coupling for kinesin must be somewhat different from actomyosin. For example, a single molecule of kinesin (2 heads) will promote translocation for several micrometres and at maximal rates6. In contrast, multiple skeletal myosin molecules are required for directed movement along an actin filament and the velocity increases as the number of myosin molecules is increased7. In addition, the non-hydrolysable ATP analogue AMP–PMP (β, γ-imidoadenosine 5′-triphosphate) causes dissociation of the actomyosin and microtubule–dynein complexes, but promotes stabilization of the microtubule–kinesin complex5,8.
Here we describe mechanistic studies of the kinetics of indi|vidual steps in the ATPase cycle of the kinesin ATPase to explain the interactions of kinesin with the microtubule lattice responsible for movement. We have used the Drosophila kinesin motor domain expressed in Escherichia coli9-11. This protein, designated K401 and containing the N-terminal 401 amino acids, is a fully active, homogeneous preparation with the kinetic and structural properties expected of a native kinesin9-11. It has a very low ATPase activity in the absence of microtubules which is limited by the rate of ADP release (∼0.01 s−1). In the presence of microtubules, the steady-state rate increases to a maximum of 20 ± 2 s−1. Furthermore, K401 is a dimer under our experimental conditions (J. J. Correia, S.P.G., M. L. Moyer and K.A.J., manuscript submitted).
Chemical quench-flow experiments11 established the rate of ATP hydrolysis at the active site to be significantly faster (100 s−1) than steady-state turnover; therefore, the rate-limiting step of the microtubule-activated ATPase must occur after ATP hydrolysis. These results were initially interpreted to suggest that ADP product release from the microtubule–kinesin · ADP (M–K · ADP) complex is rate-limiting, analogous to the microtubule-dynein ATPase12 and actomyosin4. But our stopped-flow results reported here establish a mechanochemical coupling mechanism for kinesin distinct from either actomyosin or the microtubule-dynein ATPases. These studies show that ATP binding and ATP hydrolysis occur before dissociation of kinesin from the microtubule. Accordingly, kinesin can remain associated with the microtubule through multiple rounds of hydrolysis because it spends only a small fraction of its 50-ms cycle time dissociated from the microtubule. In addition, kinetic evidence is presented for sequential release of the kinesin heads from microtubules, suggestive of cooperativity which may contribute to the observed processivity in the motility and kinetic experiments. Direct evidence for processive ATP hydrolysis is presented and this is shown to be dependent on salt concentration.
K401 dissociation
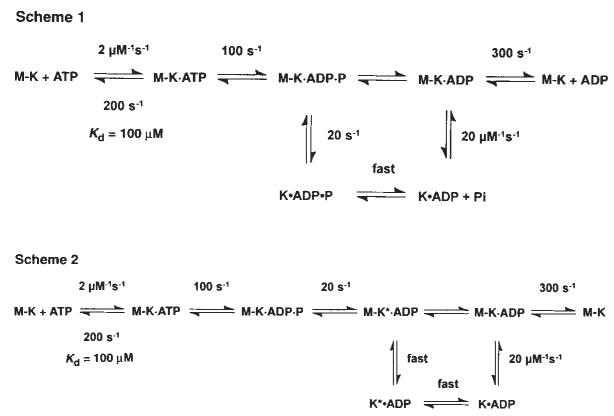
Previous chemical quench-flow experiments have defined the kinetics of ATP binding and ATP hydrolysis by the M–K complex11. ATP binding is rapid (2 μM−1 s−1, _k_off,ATP = 200 s−1) but weak, with an apparent _K_d,ATP = 100 μM, and ATP hydrolysis at the active site is ∼100 s−1 (Fig. 1, scheme 1). To determine whether ATP binding induces kinesin dissociation from the microtubule before or after ATP hydrolysis, we measured K401 dissociation from the microtubule directly by stopped-flow turbidity measurements.
FIG. 1.
Schemes 1 and 2 discussed in the text. Steady-state kinetic parameters are as follows: _k_cat=20 s−1; _K_m,ATP= 62 μM; and _K_0.5,MT=1 μM.
Scheme 1.
Figure 2a shows the time course of K401 dissociation after mixing the M–K401 complex with 1 mM Mg-ATP plus 100 mM KCl. The observed rate of the fast phase is a function of ATP concentration (Fig. 2b), and the fit of the rate data to a hyperbola results in a maximum rate of 13.6 s−1. The rate constant for dissociation is 13.6 s−1 and is significantly less than ATP hydrolysis at the active site occurring at 100 s−1. This result therefore establishes that ATP hydrolysis occurs before K401 crossbridge dissociation and while K401 is still bound to the microtubule (Fig. 1, scheme 1). Furthermore, the rate constant for K401 dissociation is comparable to, and may therefore limit, the maximum steady-state turnover rate (see Discussion).
FIG. 2.
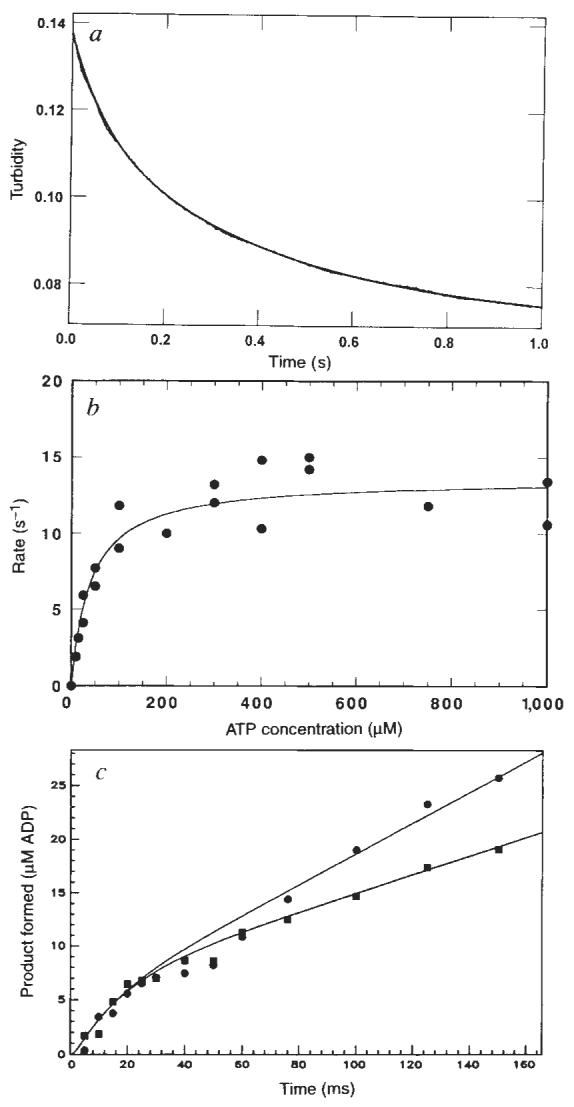
Dissociation of the M–K complex. Mg-ATP was rapidly mixed with preformed M–K401 complexes and monitored in a stopped-flow instrument to measure the rate of kinesin dissociation from the micro-tubule. a, The stopped-flow record with 1 μM K401, 0.75 μM tubulin, 1 mM Mg-ATP, and 100 mM KCI (final concentrations). The solid line is the best fit of the data to a double exponential, with _k_obs of the initial fast phase as 13.4±0.3 s−1. The slow phase observed in the absence of ATP was ignored as it was too slow to be part of the ATPase cycle and was independent of ATP concentration. b, Rate of K401 dissociation from the M–K complex (1 μM K401, 0.75 μM tubulin) as a function of Mg-ATP concentration. The solid line is the fit of the data to a hyperbola with _k_diss=13.6±0.6 s−1. c, Pre-steady-state kinetics of the M–K complex (10 μM K401, 12 μM tubulin) at 400 μM [α-32P]Mg-ATP in the presence (■) and absence (●) of 100 mM KCI. Smooth lines show the global fit of the data by computer simulation to the mechanism in scheme 1 of Fig. 1, with _K_on,ATP=0.9 μM−1 s−1; _k_off. ATP=200 s−1 and _k_hydrol=75 s−1. In the absence of added KCI, _k_ss=22 s−1, and in the presence of 100 mM KCI, _k_ss=11 s−1. The rate constant, _k_ss, represents the rate-limiting step in the pathway that limits subsequent steady-state turnovers of ATP. The linear phase of each transient represents subsequent turnover and corresponds to steady state.
METHODS. K401 and tubulin were prepared as described9. Micro-tubules were assembled from soluble tubulin (cold depolymerized and clarified) and stabilized with 20 μM taxol. All assays were done at 25 °C in ATPase buffer (20 mM HEPES, pH 7.2 with KOH, 5 mM magnesium acetate, 0.1 mM EDTA, 0.1 mM EGTA, 50 mM potassium acetate, 1 mM DTT), with concentrations being the final values after mixing. One syringe contained the preformed M–K401 complex (all M–K401 complexes stabilized with 10 μM taxol), and the other syringe contained Mg-ATP plus KCI. Stopped-flow experiments were performed using a KinTek StopFlow System (model SF-2001, KinTek). Turbidity was monitored at 340 nm; each trace or data point represents the average of 4–8 stopped-flow traces. The data a were fitted to a double exponential to correct for a slow change seen in the signal. The rate of the slow phase did not increase with increasing ATP concentration and was too slow to be on the pathway. In a control experiment, the M–K401 complex was rapidly mixed with buffer in the presence of 100 mM KCI. There was no fast change in turbidity. The rapid quench experiment (c) was done as described11 using a rapid-quench-flow instrument (model RQF-3, KinTek). The reaction was terminated by 2 M HCI, then mixed with chloroform to denature the protein and 2 M Tris–3 M NaOH to neutralize the reaction mixture. The product [α-32P]ADP was separated from [α-32P]ATP by PEI-cellulose thin-layer chromatography (elution buffer, 0.6 M potassium phosphate, pH 3.4), and radiolabelled ADP and ATP were quantified using a Betascope 603 blot analyser (Betagen). Kinetics were modelled by numerical integration using the KINSIM program22.
Attempts to measure the kinetics of K401 dissociation in the absence of added 100 mM KCI were unsuccessful. Subsequent analysis showed that kinesin was not completely released from the microtubule in a single turnover in the absence of added KCI. Experiments at low salt (Fig. 3b) show that kinesin goes through multiple turnovers of ATP per encounter with a microtubule before reaching steady state, and without significant release of kinesin from the microtubule (see later). To determine the effect of salt on ATP turnover, steady-state and rapid quench experiments were performed to examine the kinetics of ATP hydrolysis. Steady-state analysis showed that _k_cat is unaffected by the added 100 mM KCI (20 s−1) but that the _K_m for microtubules is increased dramatically (data not shown). Figure 2c shows that the kinetics of ATP hydrolysis by the M–K401 complex during the first turnover (0–30 ms) were not affected by the presence of the added KCI. The KCI, however, did affect subsequent turnovers of ATP, as shown by the linear phase of each transient in Fig. 2c, presumably by slowing microtubule rebinding and affecting the activation of product release. In the absence of added KCI, the rate of the linear phase is 22s−1, which is comparable to independent steady-state measurements for the M–K401 complex11 (_k_cat = 20 ± 2 s−1 per site for this K401 preparation). The rate of the linear phase is 11 s−1 when 100 mM KCl is present with the Mg-ATP, and this rate is comparable to measurements made during steady-state turnover in the presence of 100 mM KCl and 12 μM tubulin. The maximum rate was still 20 ± 2 s−1 at the higher salt concentration, but greater tubulin concentrations were required to achieve the maximal activation. Thus these results show that addition of 100 mM KCl with Mg-ATP does not significantly affect the rate constants governing the first turnover, namely ATP binding and hydrolysis, yet slows microtubule rebinding sufficiently to allow the kinetics of K401 dissociation from the microtubule to be measured.
FIG. 3.
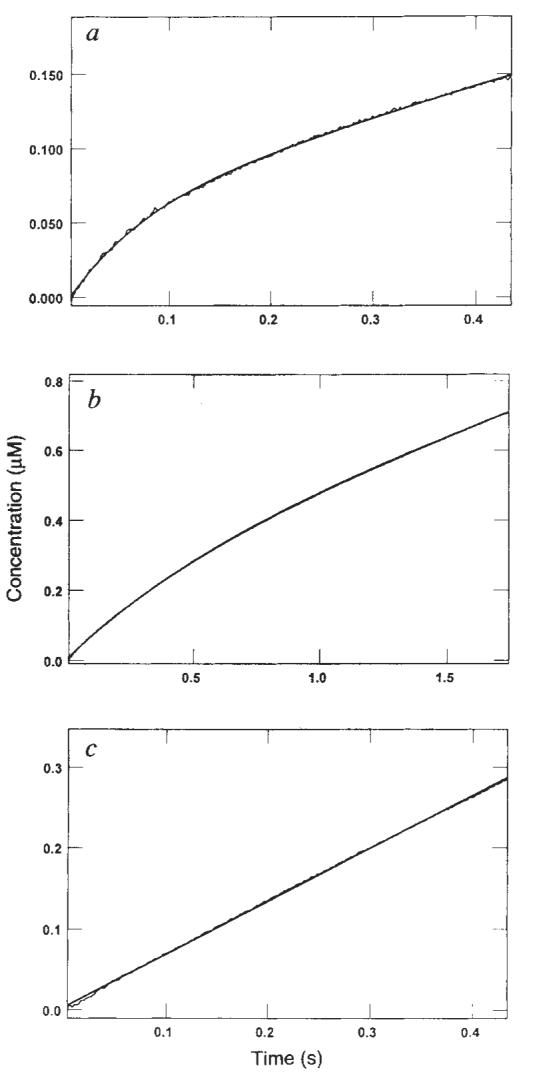
Phosphate release kinetics. Real-time kinetics of Pi release were measured directly using a fluorescent coupled assay15. a, Stopped-flow trace for rapid mixing of M–K401 complex (0.05 μM K401, 0.075 μM tubulin) with 500 μM Mg-ATP plus 100 mM KCl. Data are expressed as μM Pi formed as a function of time (fluorescence signal provided 2 volts, equivalent to 1 μM Pi). The smooth line shows the fit of the data to the burst equation (y = A_1 * exp (−_k_1_t) + k_2_t + C) which gave the rate (_k_1) of Pi release during the first turnover as 13.1 ± 0.2 s−1, the amplitude of the burst (_A_1) as 0.5 μM, and the observed rate of Pi release during subsequent turnovers (_k_2) as 4.2 ± 0.02 s−1. b, Stopped-flow trace as for a but without KCl. The M–K401 complex was formed at 0.05 μM K401 and 0.075 μM tubulin with 500 μM Mg-ATP. Data were fitted to the burst equation to give an apparent burst rate of 1.8 s−1 and an amplitude of 0.25 μM (corresponding to 5 ATP per site). c, Stopped-flow trace in the absence of added KCl but with a higher concentration of microtubules. The M–K401 complex was formed at 0.05 μM K401 and 2 μM tubulin and rapidly mixed with Mg-ATP to a final concentration of 500 μM, with 50 mM potassium acetate. No burst of product formation was evident during the first turnover, and the data were fitted to a straight line with an observed rate of 13.4 ± 0.04 s−1.
METHODS. The coupled assay system15 contained the A197C mutant of the E. coli phosphate-binding protein (PBP) covalently modified at cysteine 197 by _N_-[2-(1-maleimidyl)ethyl]-7-diethylaminocoumarin-3-carboxamide (MDCC) to produce the fluorescent reporter molecule, MDCC-PBP. The probe binds Pi rapidly (1.36 × 10⁸ M−1 s−1) and tightly (_K_d ∼ 0.1 μM), affording a 5-fold change in fluorescence. Background phosphate was removed from the buffer and solutions by the ‘Pi mop’, consisting of 7-methylguanosine (0.5 mM) and purine nucleoside phosphorylase (0.5 units per ml). Pi release from the M–K401 complex upon mixing with Mg-ATP was determined by measurement of the fluorescence change that occurred with Pi binding by MDCC-PBP (2 μM). The data, recorded as the relative fluorescence (volts), was converted to concentration (μM) based on preliminary experiments in which the MDCC-PBP was rapidly mixed with excess KH2PO4 (data not shown). Stopped-flow experiments used a Hg arc lamp, with excitation at 425 nm; emission was observed using a 450 nm cutoff long-wave pass filter. The M–K401 complex was preformed in 2 μM K401 and 3 μM tubulin and diluted to 0.05 μM K401, 0.075 μM tubulin to ensure that K401 was in a dimer state.
Phosphate release kinetics
ADP remains tightly bound to kinesin in the absence of microtubules in both native and bacterially expressed kinesin9,13,14. However, no direct measurements of inorganic phosphate (Pi) release under any conditions or ADP release in the presence of microtubules have been reported. Figure 3 shows the kinetics of Pi release for the M–K401 complex during the first turnover using a newly developed fluorescence-detected phosphate assay15. Figure 3a shows the time-dependence of the fluorescence change after mixing the M–K401 complex with Mg-ATP plus 100 mM KCl. The fluorescence change shows a burst of phosphate release (amplitude, 0.05 μM; 1 ATP per site) and a rate of 13.1 s−1, followed by a slower linear phase of Pi release during subsequent turnovers of ATP. The experiment was done using a very low concentration of microtubules in the presence of 100 mM KCl added with the ATP so that the rate of the subsequent turnovers (during the steady state) would be less than the rate of the first turnover. These conditions permitted observation of the initial burst of product formation during the first turnover. The results demonstrated that phosphate release occurs at a rate equal to the rate of dissociation of the microtubule–kinesin complex.
An identical experiment was performed in the absence of added KCl (Fig. 3b). The data fitted a burst equation with a rate of 1.8 s−1 and an amplitude of 0.25 μM (5 ATP per site). So under these conditions, the burst of phosphate formation is a function of processive ATP hydrolysis, whereby several ATP molecules are hydrolysed per site before the steady-state distribution of kinesin on and off the microtubule is attained; that is, kinesin continues along the microtubule for several rounds of ATP hydrolysis before dissociating. The kinetics of the processive hydrolysis are a function of the relative rates of ATP-induced dissociation and rebinding of the kinesin intermediate state with one head released from the microtubule (see below and Fig. 6). The observed burst amplitude of 5 ATP per site should be corrected for the reduction in amplitude due to the fast steady-state rate relative to the slow observed burst rate. A simple burst model would lead to a corrected burst amplitude of 20 ATP per site. However, more rigorous analysis of the kinetics of this reaction by numerical integration shows that the time course can be fitted by a model with a rebinding rate of ∼200 s−1, indicating a processivity of ten molecules of ATP hydrolysed per kinesin head before complete release from the microtubule (see below). This experiment provides a direct demonstration and quantification of processive ATP hydrolysis by kinesin at low microtubule concentrations.
FIG. 6.
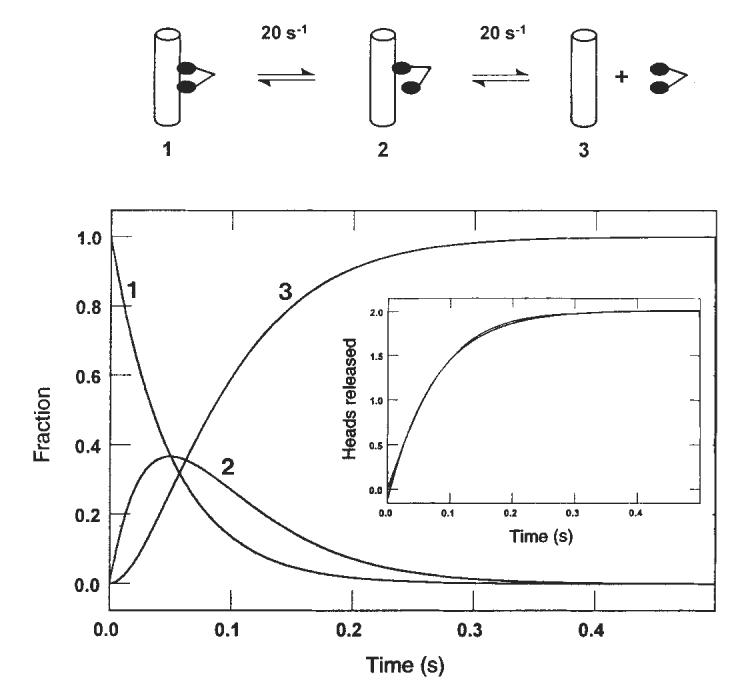
Sequential release of the kinesin heads from the microtubule. Computer modelling (KINSIM) of the kinetic data predicted the time courses shown as dimeric kinesin progresses through a complete cycle (2 ATPs hydrolysed). Curve 1 represents the species with both kinesin heads bound to the microtubule. Curve 2 shows the appearance of the intermediate that results after the first head is released, and curve 3 shows the appearance of the intermediate in which both heads are dissociated from the microtubule. Inset: simulated kinetics of the sequential release of two heads, with each species contributing equally to the signal and each step occurring at 20 s−1. Superimposed on this trace is the best fit to a single exponential giving a rate of 13.3 s−1.
In a similar experiment using a higher concentration of microtubules (2 μM tubulin) and without added KCl (Fig. 3c), a burst is not seen because the high microtubule concentration leads to maximum activation of turnover, which is limited by the rate of phosphate release (and microtubule release). The rate of the linear phase at 2 μM tubulin (13 s−1) is equal to that observed by steady-state measurements at this subsaturating microtubule concentration (data not shown).
Our kinetic data eliminate any model that assumes fast Pi release followed by slow dissociation of kinesin from the M–K complex. Rather, they indicate that the rate of Pi release is equal to the rate of K401 dissociation from the M–K complex. Thus, it is difficult to establish which reaction occurred first, and two possible pathways exist (Fig. 1, schemes 1 and 2). No lag was apparent in the kinetics of either K401 dissociation or Pi release, implying that the first reaction in the sequence occurs at 13 s−1 and is followed immediately by the second reaction at a much faster rate. The lower limit for the second step must be ∼100 s−1; otherwise a lag in the kinetics of the second reaction would be detected. A more complete discussion of the kinesin dissociation and Pi release kinetics will be presented in the discussion.
Scheme 2.
K401 · ADP binding to the microtubule
Because native kinesin and K401 purify with tightly bound ADP9,13,14 it has been assumed that the K · ADP intermediate rebinds to microtubules to complete the cycle (Fig. 1, schemes 1 and 2). The rate of binding of K401 · ADP was measured by stopped-flow turbidity measurements. Figure 4a shows a representative experiment at 5 μM tubulin, giving a rate of binding of 90 s−1. The rate of binding is dependent on microtubule concentration (Fig. 4b), increasing linearly with microtubule concentration. The rate defines the apparent second-order rate constant for K · ADP binding to the microtubule as 20 μM−1 s−1 (Fig. 1, scheme 1). This rate constant for microtubule binding is equal to the apparent second-order rate constant for microtubule activation of steady-state turnover (Fig. 3c) obtained from the initial slope of the microtubule-concentration dependence of the ATPase rate (equal to the ratio _k_cat/ _K_0.5,MT = 20 μM−1 s−1). It is therefore reasonable to suggest that both assays are measuring the same rate-limiting step at low microtubule concentrations; namely, the binding of the K · ADP intermediate to microtubules.
FIG. 4.
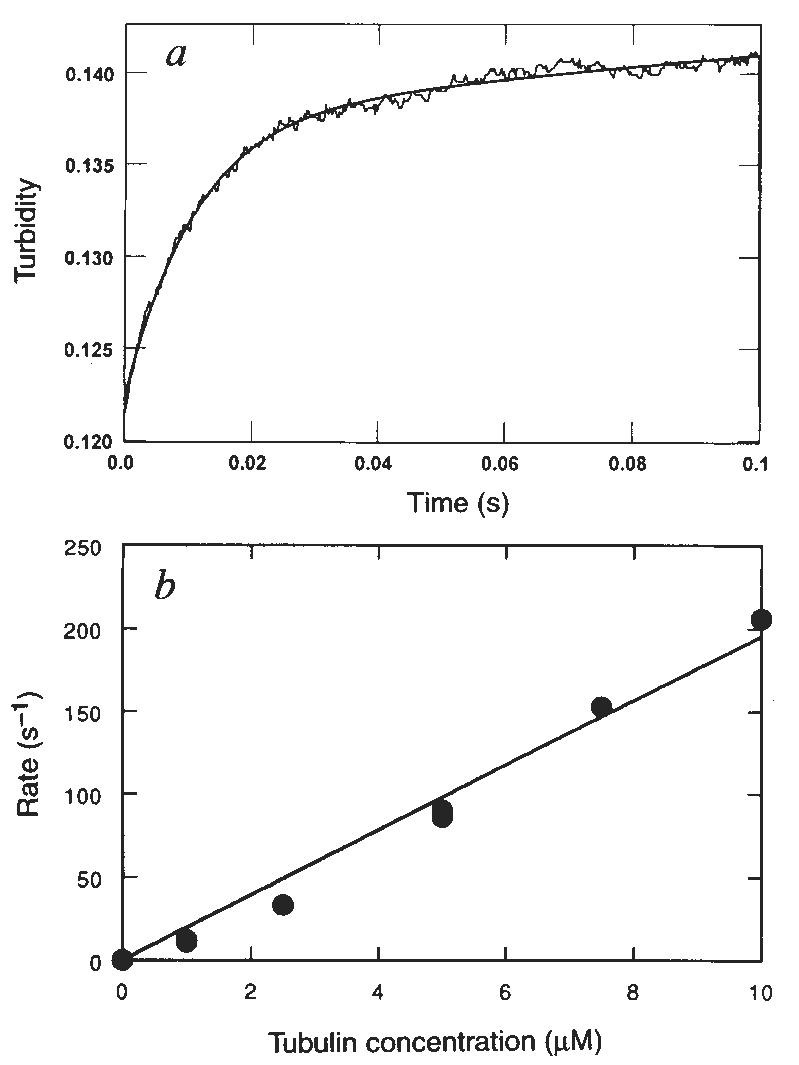
Kinetics of K · ADP binding to the microtubule. a, Stopped-flow record for an experiment in which 2 μM K401 · ADP was rapidly mixed with 5 μM tubulin. Smooth line shows the fit to an exponential followed by a linear phase with the observed exponential rate at 90 s−1. b, Microtubule concentration dependence of the rate of binding by K401. Data were fitted to a straight line; the slope gives the apparent second-order rate constant for microtubule binding (19.5 ± 0.7 μM−1 s−1).
ADP release from the M–K · ADP intermediate
To complete the cycle, the rate of ADP release from the M–K · ADP intermediate was measured using the fluorescent ADP analogue 2′(3′)-_O_-(_N_-methylanthraniloyl)-adenosine 5′-triphosphate (mantADP), previously used in kinetic measurements for both skeletal myosin16 and native kinesin14. K401 was labelled with mantADP by exchanging the ADP at the active site with mantADP. The K401–mantADP complex was then rapidly mixed with microtubules in the presence or absence of ATP in the stopped-flow, and the release of mantADP from kinesin was monitored as a change in fluorescence. Figure 5a shows the time-dependence of the fluorescence change, fitted to a single exponential. The rate increased with microtubule concentration (Fig. 5b) and the fit of the data to a hyperbola yielded a maximum rate of 306 s−1 (Fig. 1, scheme 1) and a second-order binding rate constant of 20 μM−1 s−1. Note that Woodward et al.16 determined the rate of mantADP product release for actomyosin as 393 s−1.
FIG. 5.
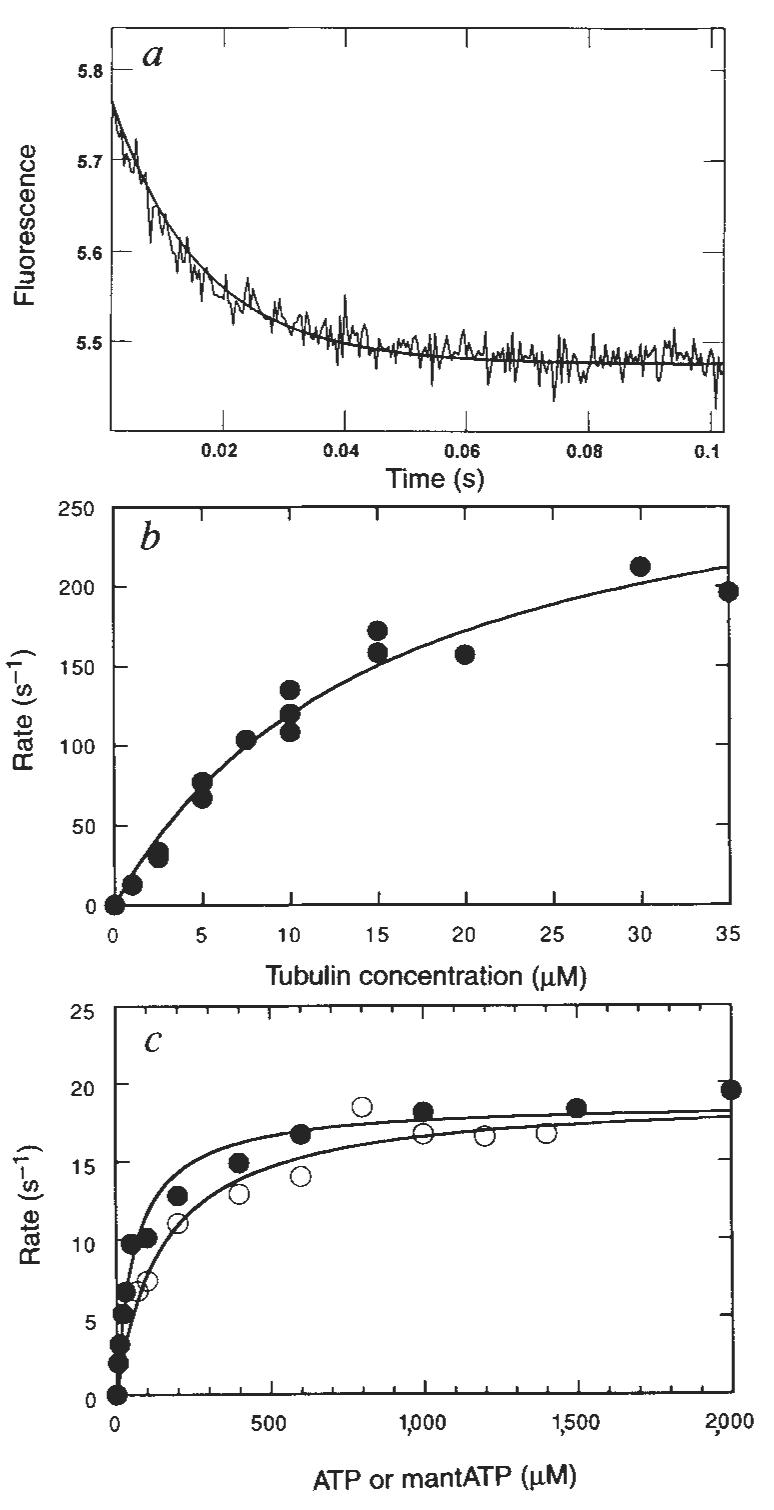
Kinetics of mantADP release from the M–K · mantADP complex. a, Representative stopped-flow record in which 2 μM K401 · mantADP was rapidly mixed with microtubules (5 μM tubulin) plus 1 mM Mg-ATP. Solid line is the best fit of the data to a single exponential with _k_obs = 67 s−1. b, The microtubule concentration dependence of the rate of mantADP release from the M–K · mantADP complex (2 μM K401 · mantADP). The fit of the data to a hyperbola gives the maximum rate of 306 ± 25 s−1. c, Steady-state ATPase (●) and mantATPase (○) of the M–K401 complex with 0.2 μM K401 and microtubules at 12 μM tubulin. Each data set was fitted to a hyperbola to determine the steady-state parameters for each substrate: for Mg-ATP _k_cat = 18.6 ± 0.6 s−1 and _K_m,ATP = 61.5 ± 8.4 μM; for Mg-mantATP, _k_cat = 19.0 ± 0.9 s−1 and _K_m,mantATP = 151 ± 30 μM.
METHODS. K · mantADP was prepared by incubating K401 as purified (ADP tightly bound at the active site) with mantADP (Molecular Probes) at 25 °C with 40 μM K401 plus 40 μM Mg-mantADP for 20 min before preparing the M–K · mantADP complex (for some experiments, mantADP was in excess of K401). There was no difference in signal or observed rates with labelling 1:1 (K401:mantADP) or with mantADP in excess (labelling at 1:4). The purity of mantADP and mantATP was confirmed by thin-layer chromatography (silica gel 60, F254 in 1-propanol/NH4OH/water 6:3:1, v/v, containing 0.5 g l−1 EDTA); _N_-methylanthraniloyl derivatives had the absorption and fluorescence spectra previously described23. The steady state for ATPase in c was determined as described9 using Mg-[α-32P]ATP. For mantATP experiments, Pi was quantified by malachite green assay24.
Several observations lead to the conclusion that the stopped-flow signal is a function of the release of mantADP from the M–K–mantADP intermediate, rather than the binding of microtubules to K–mantADP. First, the rate saturates at increasing microtubule concentration. Second, similar results were obtained in the presence and absence of a high concentration of Mg-ATP, which was included with the microtubules to ensure that mantADP was released.
The experiment presented in Fig. 5c compares Mg–mantATP with Mg-ATP as a substrate for the M–K complex. The steady-state parameters for ATP were _k_cat = 19 s−1 and _K_m,ATP = 62 μM; and _k_cat = 19 s−1 and _K_m,mantATP = 151 μM for mantATP. The steady-state _k_cat and _K_m parameters are a function of the rates of substrate binding and the rate-limiting step of the reaction. The similar _k_cat values for ATP and mantATP suggest that the rapid rate of mantADP release, which is faster than steady-state turnover, also holds for ADP product release.
Sequential release of kinesin heads
The rate constant determined for the rate-limiting step in the pathway at 13 s−1 (Figs 2, 3) presented a puzzle. Steady-state experiments yielded a _k_cat of 20±2 s−1 for this preparation of K401, which is significantly greater than 13 s−1. There appeared to be an inconsistency in pre-steady-state versus steady-state kinetics in that no step in the pathway can have a rate significantly less than steady-state turnover. To resolve this, we evaluated a model invoking sequential head release from the microtubule using computer simulation (Fig. 6). The net reaction involving the sequential release of two heads, each at 20 s−1, should in a double exponential trace which can be fitted adequately to a single exponential to give an apparent rate of 13 s−1. The model still predicts a steady-state turnover rate of 20 s−1 per site. This analysis therefore accounts for the slower rates measured for K401 dissociation or Pi release and reconciles these results with the observed steady-state turnover. The data can be fitted using other combinations of rate constants, as long as the requirement of an average rate of 20 s−1 per head is achieved and the single turnover rate of 13 s−1 can be predicted with no lag in the dissociation kinetics, although these requirements restrict the choice of rate constants considerably.
We conclude that interaction of the two heads with each other on the surface of a microtubule changes their ATPase kinetics so that their dissociation occurs sequentially. The kinetic data rule out a model in which there is random release of either of two identical heads bound to the microtubule; a model invoking random and independent heads would predict a net reaction occurring during a single turnover at 20 s−1, rather than at 13 s−1 as we observed. Accordingly, the two heads must interact while bound to the microtubule to induce an asymmetry leading to dissociation of only one head at a time.
Discussion
The mechanism shown in Fig. 1, scheme 1 accounts quantita|tively for the steady-state kinetic parameters as well as the elementary rate constants of the steps measured directly for each partial reaction in the pathway. Rapid chemical quench-flow experiments previously defined the kinetics of ATP binding and ATP hydrolysis11. These results show that ATP binds rapidly but weakly (apparent _K_d,ATP = 100 μM) to the M–K complex and is followed by fast ATP hydrolysis. Dissociation of K401 from the microtubule is a slow reaction (20 s−1) relative to the rate of ATP hydrolysis (100 s−1), showing that ATP hydrolysis occurs with kinesin still bound to the microtubule. Furthermore, dissociation of kinesin from the microtubule and Pi release occur at the same rate (Figs 2, 3), with no lag in the kinetics of either reaction. These results indicate that in the two-step sequence, the first step is slow and rate-limiting and the second step is much faster. Although either of the schemes shown in Fig. 1 could account for the results, we favour scheme 1. Kinesin dissociation from the microtubule is the slow and rate-limiting step and is followed by rapid Pi release from the K · ADP · Pi intermediate. The cycle is then completed by the rapid rebinding of the K · ADP intermediate to the microtubule, followed by fast ADP product release from the M · K · ADP intermediate.
The alternative pathway shown in scheme 2 of Fig. 1 is also consistent with our data. According to this model, phosphate release occurs first and is the rate-limiting step, and is followed by rapid dissociation of K* · ADP from the microtubule. This model is attractive because it allows for an additional step leading to phosphate release as a potential site for the power stroke while the kinesin is still attached to the microtubule. But to account for an obligatory dissociation from the microtubule during the pathway, scheme 2 requires that there be a new K* · ADP state. Because there is no direct evidence for this species, scheme 1 represents the simpler model to account for the available data.
The pathway accounts for the features of kinesin-promoted motility found in vitro single-motor assays6,17,18. In these assays, a single kinesin molecule (a dimer with two motor domains) translocates over long distances along a single microtubule at maximal rates and without dissociating, making kinesin a highly processive motor compared with myosin, as single molecules of skeletal myosin will not promote directed actin-based movements7. Moreover, the rate of movement for a kinesin construct of similar length19 (K410 at 400 nm s−1) corresponds to the step size of 8 nm and a turnover rate of 25 ATP per second per site; our ATPase rates can thus account for the motility.
The kinetic results presented in Figs 3 and 6 indicate that the processivity of kinesin is accomplished in part by coordination of ATPase cycles of the two heads of the kinesin dimer. In this model for motility, the first head dissociates from the microtubule before the second; once the first head is dissociated, it can rapidly rebind to the microtubule at the next site on the microtubule lattice, establishing processive ATP hydrolysis. Therefore dimeric kinesin can run the length of the microtubule with multiple ATPs hydrolysed per site, without kinesin release and diffusion from the microtubule.
A second mechanism that ensures that the kinesin dimer continues its translocation along the microtubule is the very fast rebinding of the completely dissociated kinesin intermediate (K · ADP) to the microtubule. The rate of rebinding is determined by the local microtubule concentration and if this is estimated as ∼1 mM near a kinesin head after its release (a tubulin dimer contained in a 10 × 10 × 10 nm cube), kinesin could rebind to the microtubule at a rate of 20,000 s−1, giving a lifetime for the detached state of ∼50 μs. The processivity of kinesin in motility assays is therefore accomplished in part by a brief time in the detached state and the sequential release of the kinesin heads, and is further enhanced by the fast rebinding rates and the hindered diffusion of kinesin while bound to a large bead.
The processive ATP hydrolysis by kinesin can be defined as the number of ATP molecules hydrolysed per ATPase site for each encounter of kinesin with a microtubule. We have shown that the processivity is ∼10 ATPs hydrolysed per site (Fig. 3b) as a result of the intermediate state rebinding at a rate of 200 s−1 (species 2 in Fig. 6) to the microtubule. Although our model and that of Hackney20 both describe a hand-over-hand mechanism of force production, further experiments will be required to distinguish between them.
The mechanism of action of kinesin shown in schemes 1 and 2 of Fig. 1 clarifies the behaviour of the non-hydrolysable ATP analogue AMP–PNP. As AMP–PNP promotes binding of kinesin with microtubules21, it was thought that ATP binding might stimulate formation of an M–K · ATP complex by an opposite mechanism to that of the actomyosin and microtubule–dynein systems. However, the microtubule–kinesin complex can be formed in the absence of AMP–PNP9,10. Our results suggest that AMP–PNP may simply lock the kinesin in a bound state in view of the fact that ATP hydrolysis is required for kinesin crossbridge release from the microtubule.
As we do not yet have all the information to calculate the changes in free energy at each step in the cycle, we cannot identify the step in the pathway for force production, although the power stroke will probably occur during the longest attached state. Because the only slow step limits kinesin release after ATP hydrolysis, a conformational change associated with the 20 s−1 rate could be the point in the cycle at which the power stroke takes place. In scheme 1 (Fig. 1), the 20 s−1 step could be a function of kinesin isomerization occurring after ATP hydrolysis and before its dissociation from the microtubule; once the power stroke is complete at 20 s−1, the conformational change would cause the rapid release of the K · ADP · Pi intermediate from the microtubule.
Alternatively, in scheme 2 of Fig. 1, the power stroke could occur as a slow conformational change of the M–K · ADP · Pi intermediate at 20 s−1; once it is complete, Pi release and kinesin dissociation would be rapid. In both schemes, the power stroke would occur as a slow conformational change at 20 s−1, followed by rapid release of the kinesin crossbridge from the microtubule. Other possible stages in the cycle for force generation include an isomerization after ATP binding and before hydrolysis, or a conformational change of the M–K · ADP intermediate before ADP product release, but are unlikely because of the short lifetimes of these intermediates.
The microtubule–kinesin pathway differs from those of actomyosin and dynein in ways that are significant for the biology of these motor systems. Both myosin and axonemal dynein operate in macromolecular assemblies and the lifetime of the attached state is quite short in both systems (0.5 ms). Under conditions of maximal actin activation in solution, most of the myosin is dissociated, consistent with concerted force production by multiple motors in an ordered array. In comparison to actomyosin, kinesin dissociates from its filament 100-fold slower and rebinds 2,000-fold faster. Kinesin is a cytoplasmic motor operating as a single motor (or with a few motors) on an organelle, and it must translocate an organelle over long distances down the axon along a microtubule. Kinesin keeps the organelle in contact with the microtubule by the sequential release of individual heads occurring late in the ATPase cycle, followed by the rapid rebinding to the microtubule. This mechanism coordinates the ATPase cycles of the two heads of dimeric kinesin and establishes the processivity observed as the tendency of kinesin to run for long distances along the microtubule.
ACKNOWLEDGEMENTS
We thank N. R. Lomax of the National Cancer Institute for taxol. Supported by the NIH (K.A.J.) and a European Community twinning grant, the Human Frontiers Science Program and the MRC, UK (M.R.W.).
References
- 1.Vale RD, Reese TS, Sheetz MP. Cell. 1985;42:39–50. doi: 10.1016/s0092-8674(85)80099-4. [DOI] [PMC free article] [PubMed] [Google Scholar]
- 2.Brady ST. Nature. 1985;317:73–75. doi: 10.1038/317073a0. [DOI] [PubMed] [Google Scholar]
- 3.Scholey JM, Porter ME, Grissom PM, McIntosh JR. Nature. 1985;318:483–486. doi: 10.1038/318483a0. [DOI] [PubMed] [Google Scholar]
- 4.Taylor EW. The Heart and Cardiovascular System. 2nd edn Raven; New York: 1992. pp. 1281–1293. [Google Scholar]
- 5.Johnson KA. A. Rev. Biophys. biophys. Chem. 1985;14:161–188. doi: 10.1146/annurev.bb.14.060185.001113. [DOI] [PubMed] [Google Scholar]
- 6.Howard J, Hudspeth AJ, Vale RD. Nature. 1989;342:154–158. doi: 10.1038/342154a0. [DOI] [PubMed] [Google Scholar]
- 7.Uyeda RQP, Warrick HM, Kron SJ, Spudich JA. Nature. 1991;352:307–311. doi: 10.1038/352307a0. [DOI] [PubMed] [Google Scholar]
- 8.Greene LE, Eisenberg E. J. biol. Chem. 1980;255:543–548. [PubMed] [Google Scholar]
- 9.Gilbert SP, Johnson KA. Biochemistry. 1993;32:4677–4684. doi: 10.1021/bi00068a028. [DOI] [PubMed] [Google Scholar]
- 10.Harrison BC, et al. Nature. 1993;362:73–75. doi: 10.1038/362073a0. [DOI] [PubMed] [Google Scholar]
- 11.Gilbert SP, Johnson KA. Biochemistry. 1994;33:1951–1960. doi: 10.1021/bi00173a044. [DOI] [PubMed] [Google Scholar]
- 12.Holzbaur ELF, Johnson KA. Biochemistry. 1989;28:7010–7016. doi: 10.1021/bi00443a034. [DOI] [PubMed] [Google Scholar]
- 13.Hackney DD. Proc. natn. Acad. Sci. U.S.A. 1988;85:6314–6318. doi: 10.1073/pnas.85.17.6314. [DOI] [PMC free article] [PubMed] [Google Scholar]
- 14.Sadhu A, Taylor EW. J. biol. Chem. 1992;267:11352–11359. [PubMed] [Google Scholar]
- 15.Brune M, Hunter JL, Corrie JET, Webb MR. Biochemistry. 1994;33:8262–8271. doi: 10.1021/bi00193a013. [DOI] [PubMed] [Google Scholar]
- 16.Woodward SKA, Eccleston JF, Geeves MA. Biochemistry. 1991;30:422–430. doi: 10.1021/bi00216a017. [DOI] [PubMed] [Google Scholar]
- 17.Block SM, Goldstein LSB, Schnapp BJ. Nature. 1990;348:348–352. doi: 10.1038/348348a0. [DOI] [PubMed] [Google Scholar]
- 18.Romberg L, Vale RD. Nature. 1993;361:168–170. doi: 10.1038/361168a0. [DOI] [PubMed] [Google Scholar]
- 19.Stewart RJ, Thaler JP, Goldstein LSB. Proc. natn. Acad. Sci. U.S.A. 1993;90:5209–5213. doi: 10.1073/pnas.90.11.5209. [DOI] [PMC free article] [PubMed] [Google Scholar]
- 20.Hackney DD. Proc. natn. Acad. Sci. U.S.A. 1994;91:6865–6869. doi: 10.1073/pnas.91.15.6865. [DOI] [PMC free article] [PubMed] [Google Scholar]
- 21.Lasek RJ, Brady ST. Nature. 1985;316:645–647. doi: 10.1038/316645a0. [DOI] [PubMed] [Google Scholar]
- 22.Barshop BA, Wrenn RF, Frieden C. Analyt. Biochem. 1983;130:134–145. doi: 10.1016/0003-2697(83)90660-7. [DOI] [PubMed] [Google Scholar]
- 23.Hiratsuka T. Biochim. biophys. Acta. 1983;742:496–508. doi: 10.1016/0167-4838(83)90267-4. [DOI] [PubMed] [Google Scholar]
- 24.Lanzetta PA, Alvarez LJ, Reinach PS, Candia OA. Analyt. Biochem. 1979;100:95–97. doi: 10.1016/0003-2697(79)90115-5. [DOI] [PubMed] [Google Scholar]
