Torsional rigidity of single actin filaments and actin–actin bond breaking force under torsion measured directly by in vitro micromanipulation (original) (raw)
Abstract
Knowledge of the elastic properties of actin filaments is crucial for considering its role in muscle contraction, cellular motile events, and formation of cell shape. The stiffness of actin filaments in the directions of stretching and bending has been determined. In this study, we have directly determined the torsional rigidity and breaking force of single actin filaments by measuring the rotational Brownian motion and tensile strength using optical tweezers and microneedles, respectively. Rotational angular fluctuations of filaments supplied the torsional rigidity as (8.0 ± 1.2) × 10−26 Nm2. This value is similar to that deduced from the longitudinal rigidity, assuming the actin filament to be a homogeneous rod. The breaking force of the actin–actin bond was measured while twisting a filament through various angles using microneedles. The breaking force decreased greatly under twist, e.g., from 600–320 pN when filaments were turned through 90°, independent of the rotational direction. Our results indicate that an actin filament exhibits comparable flexibility in the rotational and longitudinal directions, but breaks more easily under torsional load.
Keywords: optical tweezers, tensile strength, microneedle
Actin is a major protein involved in a variety of cellular motile events and in the maintenance of cell shape and form. Determining its elastic properties in the polymeric state is central to an understanding of its function (1, 2). Recently, actin filaments have been measured to be several-fold more flexible longitudinally in vitro (3) and in muscle (4–6) than many models of muscle contraction have assumed (7). This finding would seem to require reconsideration of aspects of such models (8–10). Because of its helical structure, an actin filament should experience not only longitudinal but also torsional loads during interactions with myosin (11). To explain the mechanism of force generation, it is also important to know the elastic behavior of actin filaments during torsion. The torsional rigidity of actin filament can be estimated based on its bending rigidity, assuming the actin filament to be a homogenous rod (12). However, this assumption is not necessarily correct, because the actin filament is a double-helical polymer of globular actin monomers (13, 14). Spectroscopic (12, 15–17) and electron microscopic studies (18) have suggested that the elastic property of an actin filament is largely anisotropic in the directions of twisting, bending, and stretching, i.e., the torsional rigidity is much smaller than the bending and longitudinal ones, assuming the actin filament to be a homogeneous rod, whereas the normal mode analysis based on the atomic structure of actin has shown much larger torsional rigidity than those suggested by these studies (19).
Here, we have directly determined the torsional rigidity of actin filaments and the actin–actin bond breaking force under torsion by manipulating single actin filaments with optical tweezers and microneedles, respectively. Developments in video-assist fluorescence microscopy have enabled direct observation of single actin filaments labeled with fluorescent phalloidin in solution (20). We have combined this technique for observing single fluorescent actin filaments with a method by which the filaments can be manipulated. The optical gradient field trap (optical tweezers), based on a highly focused laser beam, is a useful method to capture and manipulate small dielectric particles in solution (21, 22). One end of a single actin filament was bound to a 2-μm diameter latex bead caught in the optical tweezers and the other end was bound to a coverslip. The actin filament was pulled in the direction perpendicular to the coverslip and held taut by manipulating the bead with the optical tweezers. We found that the optical tweezers act as a frictionless bearing allowing free rotation of the bead, so that free rotation of actin filaments attached to trapped beads can be observed while being maintained under moderate tension. Thus, the rotational Brownian motion of the bead and its actin tail were directly measured to determine the torsional rigidity of the actin filament. Microneedles are also useful for manipulating single actin filaments, especially for measuring and exerting large force on them (3, 23, 24). Both ends of a single actin filament were caught by two microneedles: one fine, for force measurement, and the other stiff, for rotating and pulling the filament. We measured the tensile strength of the actin filaments rotated at various angles. The results indicate that actin filaments are comparably flexible in twist, stretch, and bend but fragile against torsion.
MATERIALS AND METHODS
Actin and myosin were obtained from rabbit skeletal muscle and purified as described (24). Actin filaments were labeled with phalloidin-tetramethylrhodamine at the molar ratio of 1:1 and observed by fluorescence microscopy (20). Manipulation of an actin filament with optical tweezers was performed as described (25). Fluorescently labeled myosin filaments were prepared by copolymerizing_N_-ethylmaleimide-treated myosin and rhodamine-labeled rod as described (24). To visualize the angular position (see Fig. 2), transparent polystyrene beads (2 μm in diameter, Polybead Carboxylate Microspheres, Polysciences) were coated with fluorescent (Ex. 530 nm; Em. 560 nm) microbeads (0.01 μm in diameter, FluoSpheres, carboxylate-modified, Molecular Probes) in the presence of ethylenediamine by 1-ethyl-3-[3-dimethylaminopropyl]carbodiimide (EDC)-mediated coupling reaction between carboxyl- and amino-groups, and then coated with _N_-ethylmaleimide-treated myosin to increase the affinity for actin (23).
Figure 2.
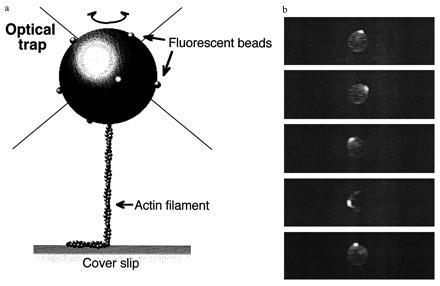
Measurement of the rotational Brownian motion of the bead and its actin tail. (a) Schematic representation of the measurement (not drawn to scale, see text for details). Optical tweezers act as a frictionless bearing for a trapped bead, so that free rotation of the actin filament can be observed while the filament is maintained under moderate tension (see Fig. 1). (b) Fluorescent images of the bead, tagged with fluorescent microbeads and bearing an actin filament tail, undergoing motion. The plane of projection is parallel to that of the coverslip, i.e., perpendicular to the actin filament axis (see Materials and Methods). Images taken every 2 s are shown.
The fluorescent images of microbeads were videotaped with a silicon intensified target (SIT) camera (model C2400, Hamamatsu Photonics, Hamamatsu City, Japan) and analyzed by a computer image processor (Avio/Excel, Nippon Avionics, Japan). Manipulation of an actin filament with microneedles was performed according to the method previously described (23).
RESULTS
Thermal Rotational Diffusion of Beads Caught in an Optical Tweezers.
To examine how much frictional drag is exerted on the rotational motion of beads caught in an optical tweezers, the rotational angular diffusion of the beads has been measured. Fig.1 shows the relationship between the mean square angular deviation of beads without actin filaments and the observation time. Although the rotational motions of beads should be three-dimensional, the positions of fluorescent microbeads attached to the surface of a transparent bead were projected on a two-dimensional photosensor plane, so one-dimensional rotational diffusion should be observed (Fig. 2b). The mean square angular deviation increased linearly with time. Using an equation of one-dimensional rotational diffusion, 〈θ2〉 = 2_D_r_t_, the rotational diffusion constant _D_r was 0.19 ± 0.02 rad2·s−1 (n = 3) as determined from the slope in Fig. 1. This value is in good agreement with the value (0.18 rad2·s−1) for a free bead of 2 μm in diameter in solution theoretically predicted using an equation, _D_r =k_B_T/ξ, where_k_B is the Boltzmann’s constant, T is the absolute temperature, and ξ is the rotational frictional drag coefficient of a free bead in water. The good agreement in these results shows that the optical tweezers act as a frictionless bearing that allows free rotation of the bead. When moderate tension (<1 pN) was exerted on the bead with an actin tail by pulling the tail in the direction perpendicular to the coverslip, the rotational friction of the bead in an optical tweezers would be also negligible, because the rotational relaxation time of the bead with an actin tail was consistent with that estimated from the torsional rigidity of an actin filament and the rotational friction drag coefficient of a free bead in water (as shown in Fig. 3). Thus, the free rotation of an actin filament attached to a trapped bead can be observed while the filament is maintained under moderate tension.
Figure 1.
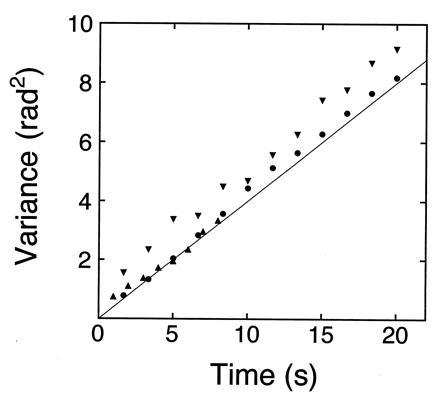
Thermal rotational diffusion of beads without an actin tail caught in an optical tweezers. Rotational angles of trapped beads were determined by measuring the position of fluorescent microbeads (0.01 μm in diameter) projected on the two dimensional photosensor plane (see Fig. 2b). The laser power measured before introduced into the objective lens was 10 mW. A solid line indicates that theoretically expected for a free bead of 2 μm in diameter in solution (see Materials and Methods for details). Three symbols (•, ▴, and ▾) are for three different beads.
Figure 3.
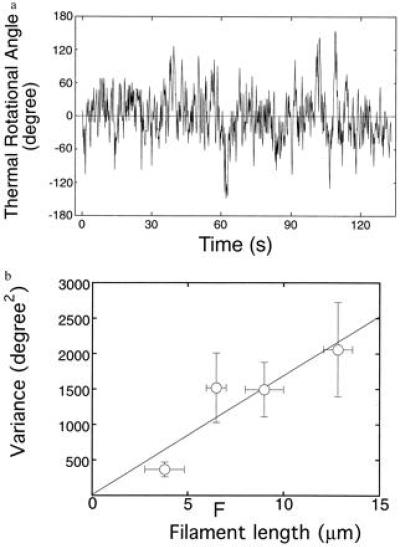
(a) Rotational angular fluctuation of a bead attached to a 10-μm actin filament. Data points were taken every six frames (0.2 s). The rotational relaxation time (ξ/κ) obtained from the autocorrelation function of the data taken at a sampling time of 0.066 s was 2.7 s, and this is ≈14-fold shorter than the above sampling time. This rotational relaxation time is consistent with that estimated from the torsional rigidity obtained later from the variance in rotational angle (κ) and the theoretical value of the rotational frictional drag coefficient for a free bead (2 μm in diameter) in water (ξ) (see ref. 32). (b) Variance in rotational angle as a function of the length of an actin filament. Each vertical bar indicates SEM for 8 to 12 filaments. Each horizontal bar indicates the range of filament lengths, in which variance was averaged. A solid line indicates the least squares fit of the data. Data recorded for >180 s were used for analysis of each filament. The sampling time was 0.2–1 s. The results were hardly dependent of the sampling time in this range. Experiments were performed in a solution containing 25 mM KCl, 5 mM MgCl2, 2 mM ATP, 20 mM Hepes (pH 7.8), and an oxygen scavenging system (24) at 25 ± 2°C.
Torsional Rigidity of Single Actin Filaments.
The free end of a single actin filament labeled with fluorescent phalloidin was attached to a polystyrene latex bead (2 μm in diameter) and thereby trapped by optical tweezers, while its other end was rigidly bound to a fluorescently labeled myosin filament immobilized on a coverslip (Fig.2a). The center of the bead was overlapped with the position where the tail end of the actin filament was bound to the coverslip to make the filament perpendicular to the coverslip. Then, the actin filament was pulled in a direction perpendicular to the surface of the coverslip and held taut by the optical tweezers. It was confirmed by monitoring the defocus of the bead image that the actin filament was taut. The maximum trapping force was approximately 1 pN. Therefore, the tension exerted on the bead when the filament was pulled and held taut was less than 1 pN. The rotational Brownian motion of the bead and its actin tail is shown in Fig. 2b. Fig. 3a shows the rotational angular fluctuation. Fig. 3b shows the variance of rotational angle, (〈θ2〉) for various lengths of actin filaments. The variance is related to the torsional rigidity, κ, through equipartition by κ〈θ2〉/2_L_ =k_B_T/2, where κ is the torsional rigidity per unit length of the filament and L is the length of the filament (26). The variances were proportional to the length of filaments, as expected. Thus, the value of κ was yielded as (8.0 ± 1.2) × 10−26 Nm2 (±SEM for 40 different filaments).
Actin–Actin Bond Breaking Force Under Torsion.
Next, we explored the breaking force of single actin filaments under torsion. Both ends of a single actin filament were caught by two needles of differing stiffness: one fine, for measuring force, and the other stiff, for pulling the filament. The actin filament was twisted through various angles by rotating the stiff needle, after which the filament was pulled until it broke. The tensile strength was determined by measuring the bending of the fine needle at the point where the filament just broke (Fig. 4a). The tensile strength greatly decreased when the filament was twisted, independent of the direction of twist (Fig. 4b).
Figure 4.
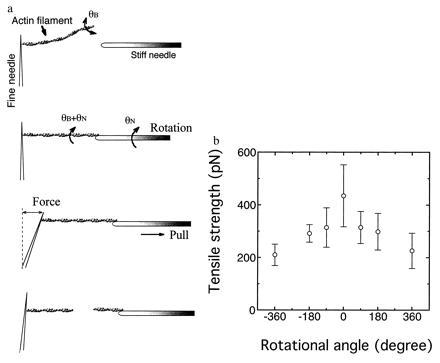
(a) Schematic representation of the measurement of tensile strength. Manipulation of an actin filament and the measurement of tensile strength were performed as described (23). The actin filament was twisted by rotating the stiff needle with a stepper motor. θB is the rotational angle of the actin filament undergoing the rotation under no tension, and θN is the angle of the filament rotated by the needle. The stiffness of glass needles was calibrated as described (3, 23). (b) Average tensile strengths of single actin filaments when twisted clock wise (+) and counter clock wise (−). The length of filaments used was 10 ± 2 μm. Experiments were performed in the same solution described in the Fig. 2 legend. Temperature = 25 ± 2°C. Bars = SD for 20–150 filaments.
Fig. 5a shows histograms of tensile strength when filaments of 10 ± 2 μm were twisted to a variety of angles between 0° and 360°. The histograms show broad distributions. Since actin filaments of 10 μm would be twisted through tens of degrees on average due to rotational Brownian motion as discussed earlier, the broad distributions are most likely due to the randomizing effect of the rotational Brownian motion on the actin filaments as follows. When the free end of an actin filament whose other end had been previously attached to the fine needle was caught by the stiff needle, the free end should become attached with some residual twisting angle (θB) due to rotational Brownian motion. Thus, the tensile strength would display a distribution of values even if the filament were not twisted by the needle. The angular distribution due to Brownian motion should be given by a Boltzmann distribution, N =N_0exp(−κ /2_k_B_TL), where N is the number of filaments with rotational angle θB and _N_0 = N at θB = 0° (26). The number of filaments, N, is shown as a function of tensile strength but not of the true angle (Fig.5a). Since average tensile strength decreases monotonically with increasing rotational angles in either direction (Fig.4a), the tensile strength, F, could be represented as F = _F_0 − (1/α) |θB|, where_F_0 is F at θB = 0° and α is some smooth positive function of θB. Inserting this equation, N =N_0exp{−κα2(F_0 −_F)2/2_k_B_TL}, the histogram plotted against the tensile strength should be approximately Gaussian with the center at F =_F_0, provided that α is a relatively smooth function. Actually, the histogram appears Gaussian (Fig.5a). Since the tensile strength decreased similarly when rotated in either direction (Fig. 4b),F(θB) ≤ F(0°), the histogram resembles a half Gaussian (Fig. 5a). The untwisted tensile strength should be given by the value where N is maximum in Fig. 5a (i.e., θB = 0°), 600 pN.
Figure 5.
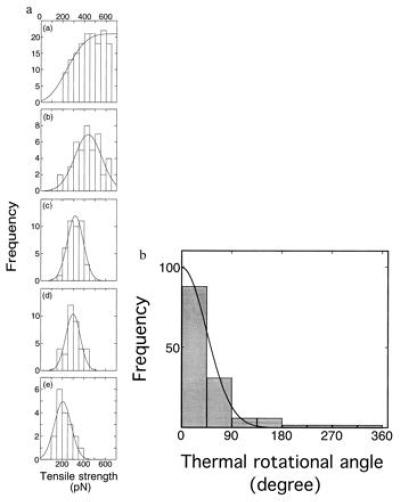
Histograms of tensile strength of single actin filaments twisted by 0° (a), 45° (b), 90° (c), 180° (d), and 360° (e). (f) Distribution of thermal rotational angles. The histogram at twist angle θN = 0° (Fig. 4a) was replotted against the thermal rotational angle, using the relationship between the tensile strength and the twist angle. Each bar shows the number per 45° interval. A solid line indicates the best fit of the data to a Boltzmann distribution,N =N_0exp(−κ /2_k_B_TL), with κ = 6.7 × 10⁻²⁶ Nm2 and_L_ = 10 μm.
When the actin filament was twisted by the needle, the total rotational angle should be the sum of the angles due to the rotational Brownian motion and rotation of the needle, θB + θN. Invoking to the same interpretation as above, the distribution of tensile strength should be given by N =N_0exp{−κα2(F_N −_F)2/2_k_B_TL}, where _F_N is the tensile strengths at θ = θN. Again, the histograms in Fig. 5 b–e resemble Gaussians. The tensile strengths when the filaments are twisted by θN, _F_N, are supplied by the values where N is maximum (i.e., θB = 0°), 420, 320, 280, and 200 pN at θ = 45°, 90°, 180°, and 360°, respectively.
Torsional Rigidity Determined from Tensile Strengths Under Torsion.
Conversely, the histogram of tensile strength at θN = 0° (Fig. 5a) can be replotted against the thermal rotational angle, θB, according to the relationship between the tensile strength and the twist angle obtained above. The rotational angular distribution of the filaments is shown in Fig. 5f. The solid line is the best fit of the data to the Boltzmann distribution, N =N_0exp(−κ /2_k_B_TL). The fit gives the torsional rigidity, κ, as 6.7 × 10⁻²⁶ Nm2. Thus, consistent values of the torsional rigidity were obtained using two different methods.
DISCUSSION
The torsional rigidity of the actin filament can be compared with the longitudinal rigidity previously obtained in vitro (3), if one assumes that the actin filament is a homogeneous rod. The torsional rigidity is related to Young’s modulus E in the form, κ = EI/(1 + δ), where I is the moment of inertia and δ is the Poisson’s ratio, which is about 0.5 of a homogeneous rod (12). I is given by π_r_4/4, where r is the outer radius of the actin filament, assuming the filament to be a homogeneous cylinder. E is 1.8 × 10⁹ Nm−2 from the longitudinal stiffness, using r = 2.8 nm (3), which was calculated from the contour of the filament cross-section based on the atomic model (14). Thus, the torsional rigidity is 5.8 × 10⁻²⁶ Nm2, in agreement with the present value. As this estimation is very sensitive to the choice of rod, however, it would be possible that the predicted value for the longitudinal rigidity is changed by a factor of two to three. Phalloidin hardly affects the motile function of actin filaments (27) but has been reported to increase the bending rigidity approximately by a factor of two (28). Thus, the torsional rigidity of an actin filament without phalloidin could be smaller by a factor of two than that reported here.
The actin filament is a double helical polymer of globular actin monomers (13, 14). It has been argued whether its elastic property is isotropic in the directions of twisting, bending, and stretching. This study indicates that it is approximately isotropic. Previous spectroscopic studies (12, 15–17) have measured the microsecond rotational dynamics of actin filaments with transient phosphorescence anisotropy spectroscopy and reported more than 10-fold smaller torsional rigidities than that determined here. This large difference cannot be explained by the effect of phalloidin, because phalloidin only slightly affected the rotational dynamics of actin filaments (12,17). The calculation of torsional rigidity from the transient phosphorescence anisotropy of actin filaments in solution is model-dependent and is based primarily on the rate of anisotropy decay (17), whereas the present method is based more directly on the amplitude of rotational fluctuations. The microsecond motions detected by phosphorescence (17) are more than 10 times faster than those detected here, so it seems likely that those microsecond motions correspond to internal dynamics that occurs on a faster time scale than the motion of the whole filament. Electron microscopic studies have shown large angular disorder of actin monomers in a filament (18). If such a large angular disorder (≈7° per monomer) is due to the rotational Brownian motion, the torsional rigidity would be more than 100-fold smaller than the present one. It is more likely that the electron microscopy may observe the static angular disorder of the actin monomers, e.g., the actin monomers could bind to adjacent ones at several metastable angles in a filament, or that the variation arises during preparation for electron microscopy. The normal mode analysis based on the atomic structure of actin has given a value, 2.6 × 10⁻²⁶ Nm2, similar to the present one (19).
Actin–actin bond breaking force was 600 pN under untwist. This value is several-fold larger than previously reported (23). Previously, the randomizing effect of the rotational Brownian motion was not considered and the calibration of needles contained systematic errors. This breaking force is several-fold larger than that of a single bond between biotin and avidin (29) and the tensile strength of a single DNA (30). The breaking force of actin filaments greatly decreased under torsion. The fragility of actin filaments under torsion provides an explanation for why long actin filaments are often broken during interactions with myosin in solution (20) and in motility assays on surfaces (31) in the presence of ATP. The longitudinal forces exerted on such filaments are at most 100 pN (24), which does not seem large enough to break them. However, these filaments would be subjected to additional torsional strain during the interaction with myosin that may seriously compromise their stabilities.
These elastic properties determined here will be fundamental in considering the mechanical role of actin in muscle contraction, cell motility, and formation of cell shape.
Acknowledgments
We thank the members of Exploratory Research for Advanced Technology for technical suggestions, M. Okubi for technical assistance, and E. H. Egelman, D. D. Thomas, and Jan West for valuable discussions and critical reading this manuscript. Y.T. thanks Professor I. Yoshiya and Dr. T. Mashimo for their encouragement.
References
- 1.Oosawa F. Biorheology. 1977;14:11–19. doi: 10.3233/bir-1977-14102. [DOI] [PubMed] [Google Scholar]
- 2.Egelman E H. J Muscle Res Cell Motil. 1985;6:129–151. doi: 10.1007/BF00713056. [DOI] [PubMed] [Google Scholar]
- 3.Kojima H, Ishijima A, Yanagida T. Proc Natl Acad Sci USA. 1994;91:12962–12966. doi: 10.1073/pnas.91.26.12962. [DOI] [PMC free article] [PubMed] [Google Scholar]
- 4.Huxley H E, Stewart A, Sosa H, Irving T. Biophys J. 1994;67:2411–2421. doi: 10.1016/S0006-3495(94)80728-3. [DOI] [PMC free article] [PubMed] [Google Scholar]
- 5.Wakabayashi K, Sugimoto Y, Tanaka H, Ueno Y, Takezawa Y, Amemiya Y. Biophys J. 1994;67:2422–2435. doi: 10.1016/S0006-3495(94)80729-5. [DOI] [PMC free article] [PubMed] [Google Scholar]
- 6.Higuchi H, Yanagida T, Goldman Y E. Biophys J. 1995;69:1000–1010. doi: 10.1016/S0006-3495(95)79975-1. [DOI] [PMC free article] [PubMed] [Google Scholar]
- 7.Huxley A F, Simmons R M. Nature (London) 1971;233:133–138. doi: 10.1038/233533a0. [DOI] [PubMed] [Google Scholar]
- 8.Irving M. Nature (London) 1995;374:14–15. doi: 10.1038/374014a0. [DOI] [PubMed] [Google Scholar]
- 9.Huxley A F. Nature (London) 1995;375:631–632. doi: 10.1038/375631a0. [DOI] [PubMed] [Google Scholar]
- 10.Goldman Y E, Huxley A F. Biophys J. 1994;67:2131–2132. doi: 10.1016/S0006-3495(94)80700-3. [DOI] [PMC free article] [PubMed] [Google Scholar]
- 11.Nishizaka T, Yagi T, Tanaka Y, Ishiwata S. Nature (London) 1993;361:269–271. doi: 10.1038/361269a0. [DOI] [PubMed] [Google Scholar]
- 12.Yoshimura H, Nishino T, Mihashi K, Kinoshita K, Ikegami A. J Mol Biol. 1984;179:453–467. doi: 10.1016/0022-2836(84)90075-5. [DOI] [PubMed] [Google Scholar]
- 13.Hanson J, Lowy J. J Mol Biol. 1963;6:46–60. [Google Scholar]
- 14.Holmes K C, Popp D, Gebhard W, Kabsch W. Nature (London) 1990;347:44–49. doi: 10.1038/347044a0. [DOI] [PubMed] [Google Scholar]
- 15.Mihashi K, Yoshimura H, Nishino T, Kinoshita K, Ikegami A. J Biochem. 1983;93:1705–1707. doi: 10.1093/oxfordjournals.jbchem.a134312. [DOI] [PubMed] [Google Scholar]
- 16.Thomas D D, Seidel J C, Gergely J. J Mol Biol. 1979;132:257–273. doi: 10.1016/0022-2836(79)90259-6. [DOI] [PubMed] [Google Scholar]
- 17.Prochniewicz E, Zhang Q, Howard E C, Thomas D D. J Mol Biol. 1995;255:446–457. doi: 10.1006/jmbi.1996.0037. [DOI] [PubMed] [Google Scholar]
- 18.Egelman E H, Francis N, DeRosier D J. Nature (London) 1982;298:131–135. doi: 10.1038/298131a0. [DOI] [PubMed] [Google Scholar]
- 19.Ben-Avraham D, Tirion M M. Biophys J. 1995;28:1231–1245. doi: 10.1016/S0006-3495(95)80299-7. [DOI] [PMC free article] [PubMed] [Google Scholar]
- 20.Yanagida T, Nakase M, Nishiyama K, Oosawa F. Nature (London) 1984;307:58–60. doi: 10.1038/307058a0. [DOI] [PubMed] [Google Scholar]
- 21.Ashkin A, Dziedzic J M. Science. 1987;235:1517–1520. doi: 10.1126/science.3547653. [DOI] [PubMed] [Google Scholar]
- 22.Block S M. Noninvasive Techniques in Cell Biology. New York: Wiley–Liss; 1990. pp. 375–402. [Google Scholar]
- 23.Kishino A, Yanagida T. Nature (London) 1988;334:74–76. doi: 10.1038/334074a0. [DOI] [PubMed] [Google Scholar]
- 24.Ishijima A, Kojima H, Higuchi H, Harada Y, Funatsu T, Yanagida T. Biophys J. 1996;70:383–400. doi: 10.1016/S0006-3495(96)79582-6. [DOI] [PMC free article] [PubMed] [Google Scholar]
- 25.Saito K, Aoki T, Aoki T, Yanagida T. Biophys J. 1994;66:769–777. doi: 10.1016/s0006-3495(94)80853-7. [DOI] [PMC free article] [PubMed] [Google Scholar]
- 26.Kittel C. Elementary Statistical Physics. New York: Wiley; 1958. [Google Scholar]
- 27.Prochniewicz-Nakayama E, Yanagida T, Oosawa F. J Cell Biol. 1983;97:1663–1667. doi: 10.1083/jcb.97.6.1663. [DOI] [PMC free article] [PubMed] [Google Scholar]
- 28.Isambert H, Venier P, Maggs A C, Fattoum A, Kassab R, Pantaloni D, Carlier M-F. J Biol Chem. 1995;270:11437–11444. doi: 10.1074/jbc.270.19.11437. [DOI] [PubMed] [Google Scholar]
- 29.Florin E, Moy V T, Gaub H E. Science. 1994;264:415–417. doi: 10.1126/science.8153628. [DOI] [PubMed] [Google Scholar]
- 30.Bensimon D, Simon A J, Croquette V, Bensimon A. Phys. Rev. Lett. 1995;74:4754–4757. doi: 10.1103/PhysRevLett.74.4754. [DOI] [PubMed] [Google Scholar]
- 31.Harada Y, Sakurada K, Aoki T, Thomas D D, Yanagida T. J Mol Biol. 1990;216:49–68. doi: 10.1016/S0022-2836(05)80060-9. [DOI] [PubMed] [Google Scholar]
- 32.Hunt A, Howard J. Proc Natl Acad Sci USA. 1993;90:11653–11657. doi: 10.1073/pnas.90.24.11653. [DOI] [PMC free article] [PubMed] [Google Scholar]