Rapid determination of single base mismatch mutations in DNA hybrids by direct electric field control (original) (raw)
Abstract
We have demonstrated that controlled electric fields can be used to regulate transport, concentration, hybridization, and denaturation of single- and double-stranded oligonucleotides. Discrimination among oligonucleotide hybrids with widely varying binding strengths may be attained by simple adjustment of the electric field strength. When this approach is used, electric field denaturation control allows single base pair mismatch discrimination to be carried out rapidly (<15 sec) and with high resolution. Electric field denaturation takes place at temperatures well below the melting point of the hybrids, and it may constitute a novel mechanism of DNA denaturation.
Combinations of the disciplines of microfabrication, chemistry, and molecular biology have allowed the generation of large oligonucleotide probe arrays which may facilitate rapid multiplex analysis of nucleic acid samples. Previous efforts have demonstrated the successful application of miniaturization technology, array formats, microfabrication techniques, and highly sensitive detection technology to obtain such genetic analysis on a chip (1–7). However, those models have used passive hybridization in which the reaction rate is limited by diffusion. In an attempt to circumvent this, we have investigated the effect of electric fields on biomolecular reactions.
We have developed a microscopic format which contains an electronically addressable electrode array that provides direct electric field control over a variety of biomolecular reactions. The electric field facilitates two interactions: transport of charged molecules to selected microlocations and hence concentration over an immobilized substrate. Subsequent reversal of the field may be used to selectively repulse those molecules with reduced affinity for the substrate. In the case of nucleic acids, regulation of the electric field strength allows adjustment of hybridization stringency for homologous interactions.
MATERIALS AND METHODS
Microfabrication.
The devices were fabricated on thermally oxidized silicon substrates by using standard microelectronics techniques (8). Aluminum was initially sputtered onto the substrates, and was then coated with 1 μm of positive photoresist. The photoresist was patterned in a proximity mask aligner in such a manner as to open holes in the resist over the desired electrode locations. A 20-nm Cr adhesion layer and a 500-nm Pt electrode layer were then sequentially deposited on the wafer by electron-beam evaporation. A solvent was used to remove the remaining photoresist, which lifted off the Cr–Pt layer, leaving only Cr–Pt in the electrode locations. The underlying Al layer was then chemically etched, using the Cr–Pt layer as a mask to complete the electrode fabrication. Two micrometers of low-stress silicon nitride was then deposited on the wafer by plasma-enhanced chemical vapor deposition. The silicon nitride was again coated with photoresist, exposed, and developed to open holes above the electrodes, and the nitride was etched down to the electrodes, using plasma etching to form shallow wells. The diameter of the wells was smaller than the diameter of the electrode to cover up the edges of the electrodes.
The 4-inch (10-cm) wafers were then cleaned, diced into chips, cleaned again, and tested. Other wafers were prepared by using the same process except that the dielectric layer was formed in one case with 30 nm of silicon dioxide and 100 nm of silicon nitride, and in a second case with 2000 nm of silicon oxynitride and 100 nm of silicon nitride.
Permeation Layer.
A 2.5% solution of NuFix glyoxal agarose (FMC) was prepared in H2O according to the supplier’s protocol. Streptavidin (Boehringer Mannheim) was suspended in 250 mM NaCl/50 mM sodium phosphate, pH 7.2, at 5 mg/ml and kept at room temperature (RT). The boiled agarose solution was equilibrated to 65°C, and agarose and streptavidin were combined to yield 2% agarose and 1 mg/ml streptavidin. Fifty microliters of 65°C streptavidin-agarose was placed on a chip and spun in a spincoating apparatus (EC101D, Headway Research, Garland, TX) at 10,000 rpm, for 20 sec at RT. Chips were then baked at 37°C for 30 min. The Schiff base linkage between the agarose glyoxal and the primary amines of streptavidin was reduced with 0.2 M sodium cyanoborohydride/0.3 M sodium borate, pH 9.0, at RT for 60 min. Excess aldehyde groups were capped in 0.1 M glycine buffer, pH 9.0, 30 min at RT. The chips were then rinsed three times for 5 min each, RT, with H2O and stored at 4°C. This procedure resulted in an agarose layer which was quite stable during fluidic washes and exposure to electric fields.
Oligonucleotides.
Biotinylated DNA oligonucleotides were synthesized with a 5′- or 3′-terminal biotin (Biotin-TEG-phosphoramidite; Glen Research, Sterling, VA) on an Applied Biosystems 380B synthesizer. Bodipy Texas red (BTR) DNA oligonucleotides were synthesized with a 5′ amino terminus (C6 linker; Glen Research). The desalted oligonucleotides were lyophilized and resuspended in water. Bodipy Texas red (D-6116, Molecular Probes) was conjugated by the manufacturer’s recommended protocol. The conjugate was HPLC purified on a C8 semipreparative column (Jones Chromatography; Lakewood, CO) then eluted with acetonitrile. _A_260 peaks were collected, desalted, and resuspended in water. The synthesized oligonucleotides are listed in Table 1. No denaturation differences were observed between hybrids with biotin and BTR on the same or opposite ends (not shown).
Table 1.
Sequences of DNA oligonucleotides
| Name | Sequence |
|---|---|
| T12 | 5′-BTR-TTTTTTTTTTTT-Bio |
| ATA5 match | 5′-GATGAGCAGTTCTACGTGG-Bio |
| ATA5 SBPM | 5′-GATGAGCAGCTCTACGTGG-Bio |
| RCA5 | 5′-BTR-CTACTCGTCAAGATGCACC |
| ATA4 | 5′-GTCTCCTTCCTCTCCAG-Bio |
| Ras match | 5′-Bio-GGTGGGCGCCGGCGGTGTGGGC |
| Ras SBPM | 5′-Bio-GGTGGGCGCCGGAGGTGTGGGC |
| Ras reporter | 5′-BTR-GCCCACACCGCCGGCGCCCACC |
Instrumentation.
A Labview (National Instruments, Austin, TX) virtual instrument interface controlled power to the electrode array from a Keithley 236 source measure unit through an array of relays (National Instruments SCXI). Connections to the chip were by epoxy ring probecard (Cerprobe; Phoenix, AZ) mounted on an analytical probe station (model 6000, Micromanipulator, Carson City, NV). Laser excitation was by HeNe 594-nm lasers (≈10-mW output; Research Electro-Optics, Boulder, CO) illuminating the chip array at an oblique angle. Fluorescence was observed through a ×8 objective (numerical aperture 0.15) and a 630-nm bandpass filter. The signal was collected by a cooled, color, charge-coupled device (CCD) camera (TEC-470, Optronics International, Chelmsford, MA). Image acquisition and quantitation were done with nih image software on a Macintosh PowerPC 8100 using a frame grabber (Data Translation or Scion).
RESULTS
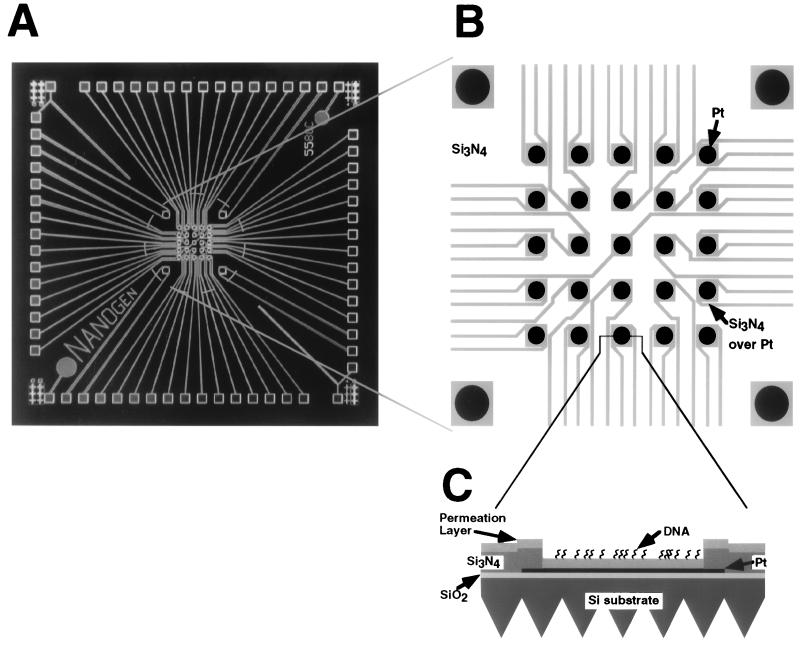
Microchip devices were made by microfabrication techniques to produce a central array of 25 electrodes with 80-μm diameter and four 160-μm diameter corner electrodes. This process resulted in discrete insulated microlocations or test sites which were electrically linked by an overlying electrolyte solution (Fig. 1) and which had access to the same volume of reagents.
Figure 1.
Silicon chip with an array of electrodes. (A) Overview of the microfabricated device. Chip dimension was 1 cm square. Light squares along the perimeter are exposed platinum contact electrodes for connections to power supply. Light lines are platinum leads insulated with dielectric, connecting contact electrodes to the exposed platinum electrodes. (B) Electrode array region of the chip. The central 1 × 1 mm test site array region consists of 4 large (160-μm diameter) corner electrodes and 25 central 80-μm electrodes. Pt, exposed Pt test sites; Si3N4, dielectric; Si3N4 over Pt, Pt insulated by Si3N4. (C) Cross section of an electrode test site. Location of section is indicated by lines extending from B. Pt, Si3N4, Pt insulated by Si3N4; SiO2, dielectric layer; Si substrate, wafer material; Permeation Layer, agarose layer containing streptavidin; DNA, biotinylated oligonucleotides bound to streptavidin. DNA binding was not limited to the surface.
An agarose permeation layer was applied over the array test sites to provide an interface between the metal electrodes and the solution (Fig. 1C). The permeation layer served multiple functions by (i) permitting ion flow, (ii) providing a matrix for attachment of analyte, and (iii) distancing the DNA from potentially damaging electrochemical reactions that occur over the active electrode.
An instrument was built which allowed independent control of the electric potentials applied to each of the 25 test sites on the chip, while permitting continuous monitoring of movement of fluorescently labeled DNA. Electrical and optical interfaces were provided by a customized probe station. The instrument directed a continuously adjustable electric potential or current from a power supply to individual electrodes of the array through a computer-controlled bank of switches. Electrodes were connected positive, negative, or neutral with respect to the power supply, and this was done with pairs or groups of electrodes. Positive electrodes were connected to the positive terminal of the power supply and negative electrodes to the negative terminal. Neutral electrodes were left unconnected and therefore floating with respect to the power supply.
The power supply was set up to source either a fixed potential difference or a fixed current between its terminals. For a particular solution composition, the electric field in the bulk solution is directly related to the current density; therefore most experiments were performed with controlled current. Consequently, we report electric field values in terms of current per electrode.
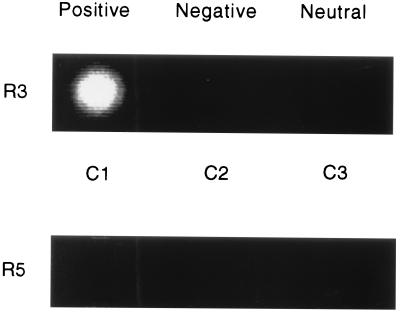
Transport and localization of DNA were analyzed on this device. Immobilization of one of the DNA strands at a test site was achieved by incorporating streptavidin into the agarose permeation layer (Fig. 1C) and by electrically directing biotinylated single-stranded oligonucleotides to this site (Table 1). Thus adjacent electrodes were current sourced and switched to positive, negative, or neutral in a single row (Fig. 2, R3). A fluorescent, biotinylated homopolymeric DNA (T12, Table 1) was then directly applied to the chip surface in an aqueous buffer solution. T12 was detectable at the positive electrode within 1 sec, but not at the negative or neutral electrodes even after 30 min (data not shown). The fluorescent signal remained at the test site after removal or reversal of the electric field and after several washes. No fluorescence remained at C1 when this experiment was done with nonbiotinylated fluorescent T12 (Fig. 2, R5). These results demonstrated that an electric field was capable of highly specific concentration of charged molecules at an electronically programmed site, thereby greatly accelerating protein–ligand (streptavidin–biotin) binding at this predetermined site. This coupling was essentially irreversible under these experimental conditions.
Figure 2.
Localization, concentration, and biotin-streptavidin-mediated immobilization of a charged molecule in an electric field. Chips were prepared as described in the legend of Fig. 1 and in the text. A dc electric field was established on the buffer-equilibrated (250 mM cysteine, pH 5.2) chip with C1 as the positive electrode and C2 as the negative electrode. C3 was neutral. Current applied was 100 nA. The buffer was then removed and replaced with a cysteine buffer solution containing 25 nM biotinylated oligonucleotide (T12) conjugated to a Bodipy Texas red fluorophore. To demonstrate immobilization, after 15 sec, two large corner electrodes (Fig. 1) were switched positive and the remainder of the electrodes were switched negative. The current was maintained for 1 min with cysteine buffer washes. The image was captured after washes. R, row; C, column; R3, biotinylated, Bodipy Texas red-conjugated T12; R5, nonbiotinylated, Bodipy Texas red-conjugated T12.
We next examined whether such directed transport could be used to facilitate selective hybridization of oligonucleotides. Prior to hybridization, nonfluorescent capture oligonucleotides were directed to and immobilized at individual test sites (as above and in Fig. 2). These sequences were selected to assess specificity and kinetics of electric field-facilitated hybridization. The oligonucleotides were derived from HLA coding regions and are shown in Table 1: ATA5 is the complement of the reporter RCA5; ATA5 SBPM contains a single base mismatch when complemented with RCA5; while ATA4 shows no homology to RCA5.
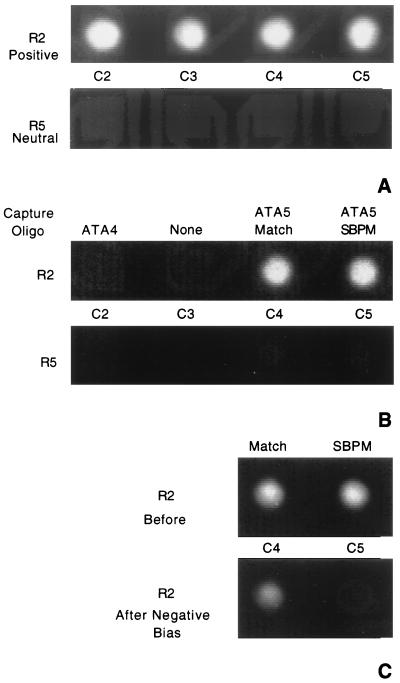
Fluorescent RCA5 reporter was then directed to one row (row 2) of positively biased electrodes (Fig. 3A). Row 5, which contained the same array of capture oligonucleotides as row 2, remained neutral. Fig. 3B is an image of row 2 and row 5 after electric field attraction and fluidic washing. These results demonstrated that an electric field was capable of significantly accelerating the hybridization. This acceleration was at least 25-fold compared with neutral test sites under ideal buffer conditions (not shown). However, this alone was not capable of distinguishing single base mismatches.
Figure 3.
Sequence-specific hybridization and SBPM discrimination facilitated by an electric field. (A) Addressing and concentration of DNA. Biotinylated nonfluorescent capture oligonucleotides were addressed to different test sites as described in the legend of Fig. 2. Row 2 and row 5 were identical: C2, ATA4; C3, none; C4, ATA5 match; C5, ATA5 SBPM. After washing, C2–5 of row 2 were switched positive and the four large corner electrodes were switched negative. Row 5, C2–5 were kept neutral. The current was 100 nA per positive electrode. A solution containing 25 nM Bodipy Texas red-conjugated RCA5 (the complement of ATA5) was applied in 250 mM cysteine buffer. Images were acquired after a 10-sec accumulation of fluorescent DNA over positively biased electrodes. The background is high because of fluorescent DNA in the solution. (B) Sequence-specific hybridization. After 15 sec, NaCl was added to the chip to a final concentration of 250 mM. The electric field was then immediately reversed as described for Fig. 2. Two fluidic washes were performed with 20 mM sodium phosphate, pH 7.4. Images were acquired of the fluorescence remaining on the electrodes after washing. (C) SBPM discrimination. The chip used in A and B was washed five times with 15 μl of 20 mM sodium phosphate, pH 7.0. The four large corner electrodes were switched positive and array electrode R2, C4 was switched negative. A pulsed electric current of 0.6 μA, 0.1 sec on, 0.2 sec off, for 150 cycles was applied through the electrode. This was then repeated at electrode R2, C5. Before, image of electrodes with RCA5 match and mismatch hybrids before electric field denaturation. After Negative Bias, image of the electrodes containing RCA5 match and mismatch hybrids after the electric field pulse sweep had been individually applied at each test site.
We then tested the ability of electric field reversal to denature duplexes and discriminate complete match from single base mismatch hybrids. An electric current pulse procedure (sweep) was applied between positive corner electrodes and individual array electrodes switched negative (Fig. 3C). After application of this field, the match test site retained 70% of the initial fluorescence, while the SBPM site retained only 13%. Twofold differences in fluorescent intensity between these test sites were seen within 25 sec.
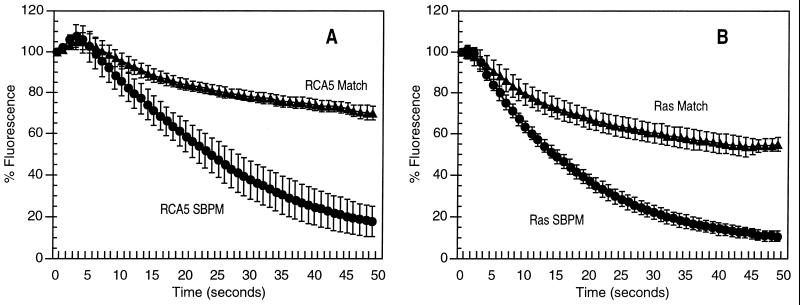
Fig. 4 shows further denaturation results comparing the above-described hybrids with a pair selected from a different genomic region, that of the ras gene. The ras hybrids had a _T_m about 20°C higher than the RCA5·ATA5 hybrid, due to a greater length and higher G+C content. Capture oligonucleotides were immobilized as described above (Fig. 2). To evaluate the effects of electronic dehybridization on specificity, fluorescently labeled RCA5 and ras reporter oligonucleotides were first passively hybridized to the immobilized oligonucleotides. Electric field sweeps were then applied to individual test sites. Fluorescence intensity at the active test site was normalized and plotted at 1-sec time points during the sweep (Fig. 4). Denaturation of the ras hybrids required stronger electric fields (1.5 μA pulsed current amplitude) than those needed to dehybridize RCA5·ATA5 hybrids (0.6 μA pulsed current amplitude, Fig. 4). However, we were reproducibly able to discriminate single base pair sequence differences in both test sequences, using the same temperature and buffer.
Figure 4.
Discrimination of match from SBPM for genomically different oligonucleotide hybrids on the same chip. ATA5 match and SBPM capture oligonucleotides were addressed to all five electrodes of C1 and C2, respectively. Ras match and SBPM capture oligonucleotides were directed to C4 and C5, respectively. RCA5 and Ras reporter oligonucleotides were passively hybridized to the previously addressed capture oligonucleotides. The hybridization conditions were 1 μM for each oligonucleotide in 50 mM sodium phosphate/500 mM NaCl, pH 7.4, in 15 μl at room temperature for 5 min. Electric field denaturations were done after equilibration in 20 mM sodium phosphate buffer, as described in the legend of Fig. 3 and below. Images were captured at 1-sec intervals, and average pixel intensity (API) was determined over the electrode area. Data were normalized by dividing the API at each time point by the API at t = 0, × 100. Points represent the average percent fluorescence remaining on 15 replicate test sites, from three separate chips in three separate experiments. Error bars represent the standard deviation at each point. The electric field sweeps took approximately 45 sec. (A) Test sites containing either RCA5 Match or RCA5 SBPM sequence (19-mers) were subjected to current pulses of 0.6 μA, 0.1 sec on, 0.2 sec off, 150 cycles. (B) Test sites containing either Ras Match or Ras SBPM (22-mers) received current pulses of 1.5 μA, 0.1 sec on, 0.2 sec off, 150 cycles.
Results similar to those outlined above were also achieved using longer (60–240 base) synthesized or PCR-amplified DNA fragments.
DISCUSSION
We have been able to achieve single base discrimination in oligonucleotide hybrids over a wide range of G+C content (0–85%) and lengths varying from 6 to 27 (Figs. 3 and 4 and data not shown). This approach should allow the simultaneous use of a wide variety of probes of different content, length, and chemical composition on the same chip. This affords a significant advantage over passive arrays (9–11). The ability to electronically manipulate these charged molecules also allows transport, hybridization, stringency selection, and detection to be performed within minutes on a single microchip device, and largely obviates the need for extensive washing. Achievement of a high local concentration facilitates bimolecular reactions which would normally be undetectable at low solution concentrations. For example, the low passive rate of reaction of streptavidin agarose with biotinylated oligonucleotides seen in Fig. 2 was undetectable prior to application of the electric field. Alternatively, the electric field may directly lower the activation barrier for a reaction to occur, perhaps by inducing small structural changes in DNA. This may allow hybridization of DNA strands in buffers that do not support passive hybridization.
The ability to rapidly and precisely dehybridize DNA duplexes in an electric field is novel. Therefore, the mechanism of this process warrants careful consideration. One possible explanation is a pure electric field effect. The electric field strength in the vicinity of the DNA can be estimated from the density and the conductivity of the bulk solution. This is because the DNA is localized up to 1 μm above the electrode, well beyond the presumed 10- to 20-nm extent of the double layer. For a 0.6-μA current above an 80-μm-diameter electrode in 20 mM phosphate buffer, we estimate the electric field strength to be around 300 V/m. This value is several orders of magnitude lower than the field strength needed to overcome the hybridization energy of the DNA duplexes used in these experiments. Therefore, it is not likely that the electric field alone is responsible for dehybridization unless some other associated process is reducing the stability of the hybrid. Joule heating will occur any time an electric current is present; however, calculations and experiments with temperature-sensitive encapsulated liquid crystals incorporated into the agarose layer showed that permeation layer temperatures during denaturing sweeps were less than 37°C (data not shown). These temperatures were more than 30°C below the _T_m of the hybrid. Hydroxyl ion production at the cathode may have increased local pH, which can denature double-stranded DNA. However, previous studies have shown it to be extremely difficult to distinguish SBPMs with much precision by using alkaline denaturation. One explanation of the observed electric field dehybridization could be a reduction of hybrid stability by local pH changes combined with an electric field effect to provide precise discrimination. The field effect could be a consequence of selectively raising the energy of rehybridization, or another novel mechanism. Electric field-related mechanisms of denaturation require further investigation.
Acknowledgments
We thank Drs. Tina Nova, Dan Raymond, Michael Nerenberg, and Howard Reese for critical reading of the manuscript and Drs. Theo Nikiforov and Ed Sheldon for help developing the permeation layer. We also thank Dr. Michael Nerenberg for numerous helpful suggestions in preparing this work.
Footnotes
Abbreviation: SBPM, single base pair mismatch.
References
- 1.Fodor S P A, Read J L, Pirrung M C, Stryer L, Lu A T, Solas D. Science. 1991;251:767–773. doi: 10.1126/science.1990438. [DOI] [PubMed] [Google Scholar]
- 2.Fodor S P, Rava R P, Huang X C, Pease A C, Holmes C P, Adams C L. Nature (London) 1993;364:555–556. doi: 10.1038/364555a0. [DOI] [PubMed] [Google Scholar]
- 3.Eggers M, Hogan M, Reich R K, Lamture J, Ehrlich D, Hollis M, Kosicki B, Powdrill T, Beattie K, Smith S, Varma R, Gangadharan R, Mallik A, Burke B, Wallace D. Biotechniques. 1994;17:516–519. [PubMed] [Google Scholar]
- 4.Lamture J B, Beattie K L, Burke B E, Eggers M D, Ehrlich D J, Fowler R, Hollis M A, Kosicki B B, Reich R K, Smith S R, Varma R S, Hogan M E. Nucleic Acids Res. 1994;22:2121–2125. doi: 10.1093/nar/22.11.2121. [DOI] [PMC free article] [PubMed] [Google Scholar]
- 5.Bains W, Smith G C. J Theor Biol. 1988;135:303–307. doi: 10.1016/s0022-5193(88)80246-7. [DOI] [PubMed] [Google Scholar]
- 6.Drmanac R, Labat L, Brukner I, Crkvenjakov R. Genomics. 1989;4:114–128. doi: 10.1016/0888-7543(89)90290-5. [DOI] [PubMed] [Google Scholar]
- 7.Southern E M, Maskos U, Elder J K. Genomics. 1992;13:1008–1017. doi: 10.1016/0888-7543(92)90014-j. [DOI] [PubMed] [Google Scholar]
- 8.Mahajan, S., ed. (1993) Handbook on Semiconductors 3, ed. Moss, T. (North–Holland, Amsterdam).
- 9.Wallace R B, Johnson M J, Hirose T, Miyake T, Kawashima E H, Itakura K. Nucleic Acids Res. 1981;9:879–894. doi: 10.1093/nar/9.4.879. [DOI] [PMC free article] [PubMed] [Google Scholar]
- 10.Zhang Y, Coyne M Y, Will S G, Levenson C H, Kawasaki E S. Nucleic Acids Res. 1991;19:3929–3933. doi: 10.1093/nar/19.14.3929. [DOI] [PMC free article] [PubMed] [Google Scholar]
- 11.Guo Z, Guilfoyle R A, Thiel A J, Wang R, Smith L M. Nucleic Acids Res. 1994;22:5456–5465. doi: 10.1093/nar/22.24.5456. [DOI] [PMC free article] [PubMed] [Google Scholar]


