Subtraction hybridization identifies a transformation progression-associated gene PEG-3 with sequence homology to a growth arrest and DNA damage-inducible gene (original) (raw)
Abstract
Cancer is a progressive multigenic disorder characterized by defined changes in the transformed phenotype that culminates in metastatic disease. Determining the molecular basis of progression should lead to new opportunities for improved diagnostic and therapeutic modalities. Through the use of subtraction hybridization, a gene associated with transformation progression in virus- and oncogene-transformed rat embryo cells, progression elevated gene-3 (PEG-3), has been cloned. PEG-3 shares significant nucleotide and amino acid sequence homology with the hamster growth arrest and DNA damage-inducible gene gadd34 and a homologous murine gene, MyD116, that is induced during induction of terminal differentiation by interleukin-6 in murine myeloid leukemia cells. PEG-3 expression is elevated in rodent cells displaying a progressed-transformed phenotype and in rodent cells transformed by various oncogenes, including Ha-ras, v-src, mutant type 5 adenovirus (Ad5), and human papilloma virus type 18. The PEG-3 gene is transcriptionally activated in rodent cells, as is_gadd34_ and MyD116, after treatment with DNA damaging agents, including methyl methanesulfonate and γ-irradiation. In contrast, only PEG-3 is transcriptionally active in rodent cells displaying a progressed phenotype. Although transfection of PEG-3 into normal and Ad5-transformed cells only marginally suppresses colony formation, stable overexpression of PEG-3 in Ad5-transformed rat embryo cells elicits the progression phenotype. These results indicate that PEG-3 is a new member of the _gadd_and MyD gene family with similar yet distinct properties and this gene may directly contribute to the transformation progression phenotype. Moreover, these studies support the hypothesis that constitutive expression of a DNA damage response may mediate cancer progression.
Keywords: subtractive cDNA library, gadd34/MyD116, cancer progression, gene transcription, DNA transfection
The carcinogenic process involves a series of sequential changes in the phenotype of a cell resulting in the acquisition of new properties or a further elaboration of transformation-associated traits by the evolving tumor cell (1–4). Although extensively studied, the precise genetic mechanisms underlying tumor cell progression during the development of most human cancers remain enigmas. Possible factors contributing to transformation progression include activation of cellular genes that promote the cancer cell phenotype, i.e., oncogenes; activation or modification of genes that regulate genomic stability, i.e., DNA repair genes; loss or inactivation of cellular genes that function as inhibitors of the cancer cell phenotype, i.e., tumor suppressor genes; and/or combinations of these genetic changes in the same tumor cell (1–6). A useful model system for defining the genetic and biochemical changes mediating tumor progression is the type 5 adenovirus (Ad5)/early passage rat embryo (RE) cell culture system (1, 7–14). Transformation of secondary RE cells by Ad5 is often a sequential process resulting in the acquisition and further elaboration of specific phenotypes by the transformed cell (7–10). Progression in the Ad5-transformation model is characterized by the development of enhanced anchorage independence and tumorigenic potential (as indicated by a reduced latency time for tumor formation in nude mice) by progressed cells (1, 10). The progression phenotype in Ad5-transformed RE cells can be induced by selection for growth in agar or tumor formation in nude mice (7–10), referred to as spontaneous progression, by transfection with oncogenes (13), such as Ha-ras, v-src, v-raf, or the E6/E7 region of human papillomavirus type 18 (HPV-18), referred to as oncogene-mediated progression, or by transfection with specific signal transducing genes (14), such as protein kinase C, referred to as growth factor-related, gene-induced progression.
Progression, induced spontaneously or after gene transfer, is a stable cellular trait that remains undiminished in Ad5-transformed RE cells even after extensive passage (>100) in monolayer culture (13). However, a single treatment with the demethylating agent 5-azacytidine (AZA) results in a stable reversion in transformation progression in >95% of cellular clones (10, 13, 14). The progression phenotype is also suppressed in somatic cell hybrids formed between normal or unprogressed-transformed cells and progressed cells (11–13). These findings suggest that progression may result from the activation of specific progression-promoting genes or the selective inhibition of progression-suppressing genes, or possibly a combination of both processes.
The final stage in tumor progression is acquisition by transformed cells of the ability to invade local tissue, survive in the circulation, and recolonize in a new area of the body, i.e., metastasis (15–17). Transfection of an Ha-ras oncogene into cloned rat embryo fibroblast (CREF) cells (18) results in morphological transformation, anchorage independence, and acquisition of tumorigenic and metastatic potential (19–21). Ha-_ras_-transformed CREF cells exhibit major changes in the transcription and steady-state levels of genes involved in suppression and induction of oncogenesis (21, 22). Simultaneous overexpression of the Ha-_ras_suppressor gene K_rev_-1 in Ha-_ras_-transformed CREF cells results in morphological reversion, suppression of agar growth capacity, and a delay in in vivo oncogenesis (21). Reversion of transformation in Ha-ras plus K_rev_-1-transformed CREF cells correlates with a return in the transcriptional and steady-state mRNA profile to that of untransformed CREF cells (21, 22). Following long latency times, Ha-ras plus K_rev_-1-transformed CREF cells form both tumors and metastases in athymic nude mice (21). The patterns of gene expression changes observed during progression, progression suppression, and escape from progression suppression supports the concept of “transcriptional switching” as a major component of Ha-_ras_-induced transformation (21, 22).
To identify potential progression-inducing genes with elevated expression in progressed versus unprogressed Ad5-transformed cells we used subtraction hybridization (13, 23). This approach resulted in the cloning of progression elevated gene-3 (PEG-3), which is expressed at elevated levels in progressed cells (spontaneous, oncogene-induced, and growth factor-related, gene-induced) rather than in unprogressed cells (parental Ad5-transformed, AZA-suppressed, and suppressed hybrids). Transfection of PEG-3 into unprogressed, parental Ad5-transformed cells induces the progression phenotype, without significantly altering colony formation in monolayer culture or affecting cell growth. PEG-3 expression is also elevated following DNA damage and oncogenic transformation of CREF cells by various oncogenes. Sequence analysis indicates that_PEG-3_ has 73 and 68% nucleotide and 59 and 72% amino acid similarities, respectively, with the gadd34 and_MyD116_ genes. However, unlike gadd34 and_MyD116_, which encode proteins of ≈65 and ≈72 kDa, respectively, PEG-3 encodes a protein of ≈50 kDa with only ≈28 and ≈40% amino acid similarities to gadd34 and_MyD116_, respectively, in its carboxyl terminus. These results indicate that PEG-3 represents a new member of the_gadd34_/MyD116 gene family with both similar and distinct properties. Unlike gadd34 and MyD116, which dramatically suppress colony formation (24), _PEG-3_only modestly alters colony formation following transfection, i.e., ≤20% reduction in colony formation in comparison with vector transfected cells. Moreover, a direct correlation only exists between expression of PEG-3, and not gadd34 or MyD116, and the progression phenotype in transformed rodent cells. These findings provide evidence for a potential link between constitutive induction of a stress response, characteristic of DNA damage, and induction of cancer progression.
MATERIALS AND METHODS
Cell Lines, Culture Conditions, and Anchorage-Independent Growth Assays.
The isolation, properties, and growth conditions of the E11, E11-NMT, E11-NMT × CREF somatic cell hybrids, E11 × E11-NMT somatic cell hybrids, and the E11-NMT AZA clones have been described (1, 7–13). E11-ras R12 and E11-HPV E6/E7 clones were isolated by transfection with the Ha-ras or the HPV-18 E6/E7 genes, respectively. The isolation, properties, and growth conditions of CREF, CREF-H5hr1 A2, CREF-ras, the CREF-ras/K_rev_1 B1, B1 T, and B1 M, and the CREF-ras/K_rev_1 B2, B2 T, and B2 M clones have been described (21). CREF-src and CREF-HPV-18 clones were isolated by transfection with the v-src and HPV-18 E6/E7 genes, respectively. All cells were grown in Dulbecco’s modified Eagle’s minimum essential medium supplemented with 5% fetal bovine serum at 37°C in a 5% C02/95% air humidified incubator. Anchorage-independence assays were performed by seeding various cell densities in 0.4% Noble agar on a 0.8% agar base layer both of which contain growth medium (7).
Cloning and Sequencing of the PEG-3 cDNA.
The_PEG-3_ gene was cloned from E11-NMT cells using subtraction hybridization as described (23). A full-length PEG-3 cDNA was obtained using the rapid amplification of cDNA end (RACE) procedure and direct ligation (25, 26). Sequencing was performed by the dideoxy chain termination (Sanger) method (27). The coding region of_PEG-3_ was cloned into a pZeoSV vector (Invitrogen) as described (25, 26).
RNA Analysis and in Vitro Transcription Assays.
Total cellular RNA was isolated by the guanidinium/phenol extraction method and Northern blotting was performed as described (28). Fifteen micrograms of RNA were denatured with glyoxal/dimethyl sulfoxide and electrophoresed in 1% agarose gels, transferred to nylon membranes, and hybridized sequentially with32P-labeled PEG-3, Ad5 E1A, and glyceraldehyde-3-phosphate (GAPDH) probes (28, 29). Following hybridization, the filters were washed and exposed for autoradiography. The transcription rates of PEG-3, gadd34, MyD116, GAPDH, and pBR322 were determined by nuclear run-on assays (12, 21).
In Vitro Translation of PEG-3.
Plasmid pZeoSV containing PEG-3 cDNA was linearized by digestion with_Xho_I and used as a template to synthesize mRNA. In vitro translation of PEG-3 mRNA was performed with a rabbit reticulocyte lysate translation kit as described by Promega.
DNA Transfection Assays.
To study the effect of_PEG-3_ on monolayer colony formation, the vector (pZeoSV) containing no insert or a pZeoSV-PEG-3 construct containing the_PEG-3_ coding region were transfected into the various cell types by the Lipofectin method (GIBCO/BRL) and Zeocin-resistant clones were isolated or the efficiency of Zeocin colony formation was determined (29, 30).
RESULTS AND DISCUSSION
Expression of the PEG-3 Gene Correlates Directly with the Progression Phenotype in Viral- and Oncogene-Transformed Rodent Cells.
A critical component of cancer development is progression, a process by which a tumor cell develops either qualitatively new properties or displays an increase in the expression of traits that enhance the aggressiveness of a tumor (1–4). Insight into this process offers the potential of providing important new targets for intervening in the neoplastic process (1–4). In the Ad5-transformed RE cell culture model system, enhanced anchorage-independent growth and in vivo tumorigenic aggressiveness, i.e., markers of the progression phenotype, are stable traits that can be induced spontaneously or by gene transfer (oncogenes and growth factor-related genes) (Table1). Upon treatment of progressed cells with AZA, the progression phenotype can be stably reversed (1,10). A reversion of progression also occurs following somatic cell hybridization of progressed cells with unprogressed Ad5-transformed cells or with normal CREF cells. A further selection of these unprogressed Ad5-transformed cells by injection into nude mice results in acquisition of the progressed phenotype following tumor formation and establishment in cell culture. These studies document that progression in this model system is a reversible process that can be stably produced by appropriate cellular manipulation. In this context, the Ad5-transformed RE model represents an important experimental tool for identifying genes that are associated with and that mediate cancer progression.
Table 1.
Expression of PEG-3 in Ad5-transformed RE cells directly correlates with expression of the progression phenotype
| Cell type* | Agar cloning efficiency, %† | Tumorigenicity in nude mice‡ | Progression phenotype |
|---|---|---|---|
| RE | <0.001 | 0/10 | Prog− |
| CREF | <0.001 | 0/18 | Prog− |
| E11 | 2.9 ± 0.3 | 8/8 (36) | Prog− |
| E11-NMT | 34.3 ± 4.1 | 6/6 (20) | Prog+ |
| CREF × E11-NMT F1 | 2.0 ± 0.3 | 0/6 | Prog− |
| CREF × E11-NMT F2 | 1.5 ± 0.1 | 0/6 | Prog− |
| CREF × E11-NMT R1 | 72.5 ± 9.4 | 3/3 (17) | Prog+ |
| CREF × E11-NMT R2 | 57.4 ± 6.9 | 3/3 (17) | Prog+ |
| E11 × E11-NMT IIId | 5.6 ± 0.7 | 3/3 (56) | Prog− |
| E11 × E11-NMT IIIdTD | 41.0 ± 4.9 | 3/3 (19) | Prog+ |
| E11 × E11-NMT A6 | 0.3 ± 0.0 | 2/3 (44) | Prog− |
| E11 × E11-NMT A6TD | 29.3 ± 3.5 | NT | Prog+ |
| E11 × E11-NMT 3b | 1.5 ± 0.2 | 3/3 (31) | Prog− |
| E11 × E11-NMT IIa | 29.5 ± 2.8 | 3/3 (23) | Prog+ |
| E11-NMT AZA C1 | 2.8 ± 0.5 | NT | Prog− |
| E11-NMT AZA B1 | 1.6 ± 0.3 | 3/3 (41) | Prog− |
| E11-NMT AZA C2 | 2.0 ± 0.1 | 3/3 (50) | Prog− |
| E11-ras R12 | 36.8 ± 4.6 | 3/3 (18) | Prog+ |
| E11-HPV E6/E7 | 31.7 ± 3.1 | 3/3 (22) | Prog+ |
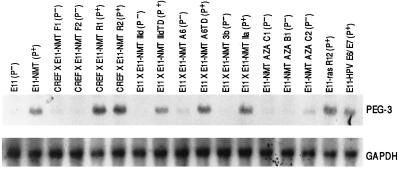
To directly isolate genes elevated during progression we employed an efficient subtraction–hybridization approach, previously used to clone the p21 gene (melanoma differentiation-associated gene-6; mda-6) (23, 25) and a novel cancer growth-suppressing gene mda-7 (26, 29). For this approach, cDNA libraries from a progressed mutant Ad5 (H5ts125)-transformed RE clone, E11-NMT (10), and its parental unprogressed cells, E11 (10, 31), were directionally cloned into the λ Uni-ZAP phage vector and subtraction hybridization was performed between the double-stranded tester (E11-NMT) and the single-stranded driver DNA (E11) by mass excision of the libraries (23). With this strategy, in combination with the RACE procedure and DNA ligation techniques, a full-length PEG-3 cDNA displaying elevated expression in E11-NMT versus E11 cells was cloned. Northern blot analysis indicates that PEG-3 expression is ≥10-fold higher in all progressed Ad5-transformed RE cells, including E11-NMT, specific E11-NMT × CREF somatic cell hybrid clones, R1 and R2, expressing an aggressive transformed phenotype, and specific E11 × E11-NMT somatic cell hybrid clones, such as IIa that display the progression phenotype (Fig. 1 and Table 1).PEG-3 mRNA levels also increase following induction of progression by stable expression of the Ha-ras and HPV-18 E6/E7 oncogenes in E11 cells (Fig. 1). A further correlation between expression of PEG-3 and the progression phenotype is provided by E11 × E11-NMT clones, such as IIId and A6, that initially display a suppression of the progression phenotype and low_PEG-3_ expression, but regain the progression phenotype and_PEG-3_ expression following tumor formation in nude mice, i.e., IIIdTD and A6TD (Table 1 and Fig. 1). In contrast, unprogressed Ad5-transformed cells, including E11, E11-NMT × CREF clones F1 and F2, E11 × E11-NMT clones IIId, A6, and 3b, and AZA-treated E11-NMT clones B1, C1, and C2, have low levels of PEG-3 RNA. These results provide evidence for a direct relationship between the progression phenotype and PEG-3 expression in this Ad5-transformed RE cell culture system. They also demonstrate that the final cellular phenotype, i.e., enhanced anchorage independence and aggressive tumorigenic properties, is a more important determinant of_PEG-3_ expression than is the agent (oncogene) or circumstance (selection for tumor formation in nude mice) inducing progression.
Figure 1.
PEG-3 expression in Ad5-transformed RE cells displaying different stages of transformation progression. Fifteen micrograms of cellular RNA isolated from the indicated cell types were electrophoresed, transferred to nylon membranes, and hybridized with an ≈700 bp 3′ region of the PEG-3 gene (Upper) and then stripped and probed with GAPDH (Lower).
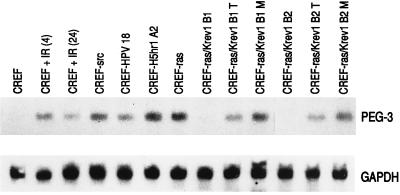
A second rodent model used to study the process of cancer progression employs CREF clones modified by transfection to express dominant acting oncogenes (such as Ha-ras, v-src, HPV-18, and the mutant adenovirus H5hr1) and tumor suppressor genes (such as K_rev_-1, RB, and wild-type p53) (refs. 19–22 and unpublished data). In this model system, Ha-_ras_-transformed CREF cells are morphologically transformed, anchorage independent, and induce both tumors and lung metastases in syngeneic rats and athymic nude mice (19–22). The K_rev_-1 (Ha-ras) suppressor gene reverses the in vitro and in vivo_properties in Ha-ras_-transformed cells (21). Although suppression is stable in vitro, Ha-ras/K_rev_-1 CREF cells induce both tumors and metastases after extended times in nude mice (21). Expression of_PEG-3 is not apparent in CREF cells, whereas tumorigenic CREF cells transformed by v-src, HPV-18, H5hr1, and Ha-ras contain high levels of PEG-3 RNA (Fig.2). Suppression of Ha-ras induced transformation by K_rev_-1 inhibits_PEG-3 expression. However, when Ha-ras/K_rev_-1 cells escape tumor suppression and form tumors and metastases in nude mice, _PEG-3_expression reappears, with higher expression in metastatic-derived than tumor-derived clones (Fig. 2). These findings provide further documentation of a direct relationship between induction of a progressed and oncogenic phenotype in rodent cells and PEG-3_expression. As indicated above, it is the phenotype rather than the inducing agent that appears to be the primary determinant of_PEG-3 expression in rodent cells.
Figure 2.
PEG-3 expression in γ-irradiated and oncogene-transformed CREF cells. The experimental procedure was as described in the legend to Fig. 1. CREF cells were γ-irradiated with 10 Gy and RNA was isolated 4 and 24 hr later.
The PEG-3 Gene Displays Sequence Homology with the Hamster gadd34 and Mouse MyD116 Genes and Is Inducible by DNA Damage.
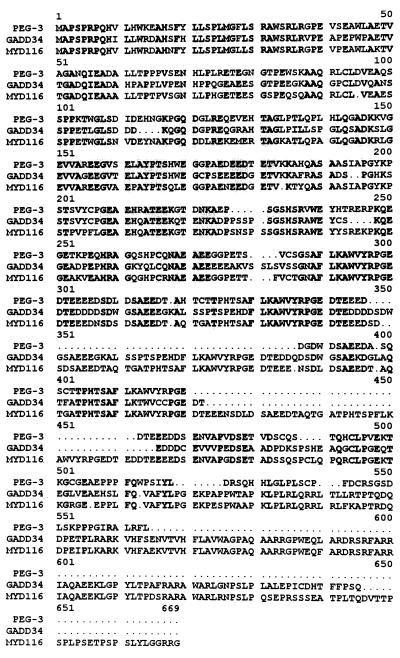
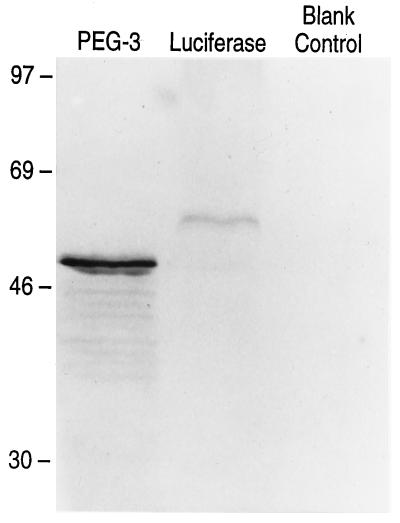
The cDNA sizes of PEG-3,gadd34, and MyD116 are 2210, 2088, and 2275 nt, respectively. The nucleotide sequence of PEG-3 is ≈73% and the amino acid sequence is ≈59% homologous to the_gadd34_ (32) gene (Fig.3 and data not shown).PEG-3 also shares significant sequence homology, ≈68% nucleotide and ≈72% amino acid, with the murine homologue of_gadd34_, MyD116 (33, 34) (Fig. 3 and data not shown). Differences are apparent in the structure of the 3′ untranslated regions of PEG-3 versus_gadd34_/MyD116. ATTT motifs have been associated with mRNA destabilization. In this context, the presence of three ATTT sequences in gadd34 and six tandem ATTT motifs in_MyD116_ would predict short half-lives for these messages. In contrast PEG-3 contains only one ATTT motif, suggesting that this mRNA may be more stable. The sequence homologies between_PEG-3_ and gadd34/MyD116 are highest in the amino-terminal region of their encoded proteins, i.e., ≈69 and ≈76% homology with gadd34 and MyD116, respectively, in the first 279 aa. In contrast, the sequence of the carboxyl terminus of PEG-3 significantly diverges from_gadd34_/MyD116, i.e., only ≈28 and ≈40% homology in the carboxyl-terminal 88 aa. In gadd34 and_MyD116_ a series of similar 39 aa are repeated in the protein, including 3.5 repeats in gadd34 and 4.5 repeats in_MyD116_. In contrast, PEG-3 contains only 1 of these 39 aa regions, with ≈64% and ≈85% homology to_gadd34_ and MyD116, respectively. On the basis of sequence analysis, the PEG-3 gene should encode a protein of 457 aa with a predicted M_r of ≈50 kDa. To confirm this prediction, in vito translation analyses of proteins encoded by the PEG-3 cDNA were determined (Fig.4). A predominant protein after_in vitro translation of PEG-3 has a molecular mass of ≈50 kDa (Fig. 4). In contrast, gadd34 encodes a predicted protein of 589 aa with an M_r of ≈65 kDa and MyD116 encodes a predicted protein of 657 aa with an_M_r of ≈72 kDa. The profound similarities in the structure of PEG-3 versus_gadd34/MyD116 cDNA and their encoded proteins suggest that PEG-3 is a new member of this gene family. Moreover, the alterations in the carboxyl terminus of _PEG-3_may provide a functional basis for the different properties of this gene versus gadd34/MyD116.
Figure 3.
Predicted amino acid sequences of the PEG-3, gadd34, and MyD116 proteins. Sequences shared by the three genes are shaded. PEG-3 encodes a putative protein of 457 aa (_M_r of ≈50 kDa), the _gadd34_gene encodes a putative protein of 589 aa (M_r of ≈65 kDa), and the_MyD116 gene encodes a putative protein of 657 aa (_M_r of ≈72 kDa).
Figure 4.
In vitro translation of the_PEG-3_ gene. Lanes: Luciferase, _in vitro_translation of the luciferase gene (≈61 kDa) (positive control); Blank Control, contains the same reaction mixture without mRNA (negative control); PEG-3, contains the translated products of this cDNA. Rainbow protein standards (Amersham) were used to determine the sizes of the in vitro translated products.
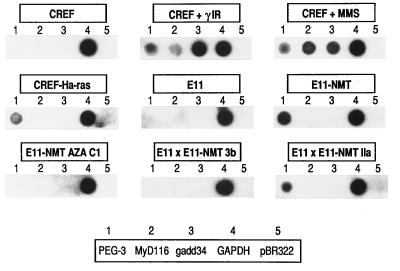
The specific role of the gadd34/MyD116_gene in cellular physiology is not known. Like hamster_gadd34 and its murine homologue MyD116,PEG-3 steady-state mRNA and RNA transcriptional levels are increased following DNA damage by methyl methanesulfonate and γ-irradiation (Figs. 2 and 5and data not shown). In contrast, nuclear run-on assays indicate that only the PEG-3 gene is transcriptionally active (transcribed) as a function of transformation progression (Fig. 5). This is apparent in CREF cells transformed by Ha-ras and in E11-NMT and various E11-NMT subclones either expressing or not expressing the progression phenotype (Fig. 5). The_gadd34_/MyD116 gene, as well as the_gadd45_, MyD118, and gadd153 genes, encode acidic proteins with very similar and unusual charge characteristics (24). PEG-3 also encodes a putative protein with acidic properties similar to the gadd and_MyD_ genes (Fig. 3). The carboxyl-terminal domain of the murine MyD116 protein is homologous to the corresponding domain of the herpes simplex virus 1 γ134.5 protein, which prevents the premature shutoff of total protein synthesis in infected human cells (35, 36). Replacement of the carboxyl-terminal domain of γ134.5 with the homologous region from MyD116_results in a restoration of function to the herpes viral genome, i.e., prevention of early host shutoff of protein synthesis (36). Although further studies are required, preliminary results indicate that expression of a carboxyl-terminus region of MyD116 results in nuclear localization (36). Similarly, gadd45,gadd153, and MyD118 gene products are nuclear proteins (24, 37). Moreover, both gadd45 and_MyD118 interact with the DNA replication and repair protein proliferating cell nuclear antigen and the cyclin-dependent kinase inhibitor p21 (37). MyD118 and gadd45 also modestly stimulate DNA repair in vitro (37). The carboxyl terminus of PEG-3 is significantly different than that of_MyD116_ (Fig. 3). Moreover, the carboxyl-terminal domain region of homology between MyD116 and the γ134.5 protein is not present in PEG-3. In this context, the localization, protein interactions, and properties of_PEG-3_ may be distinct from gadd and_MyD_ genes. Once antibodies with the appropriate specificity are produced it will be possible to define PEG-3 location within cells and identify potentially important protein interactions mediating biological activity. This information will prove useful in elucidating the function of the PEG-3 gene in DNA damage response and cancer progression.
Figure 5.
Transcription of the PEG-3,gadd34, and MyD116 genes as a function of DNA damage and transformation progression. Nuclear run-on assays were performed to determine comparative rates of transcription. Nuclei were isolated from CREF cells treated with methyl methanesulfonate (MMS) (100 μg/ml for 2 hr followed by growth for 4 hr in complete medium) or γ-irradiation (10 Gy followed by 2 hr growth in complete medium). DNA probes include PEG-3, MyD116,gadd34, GAPDH, and pBR322.
PEG-3 Lacks Potent Growth-Suppressing Properties Characteristic of the gadd and MyD Genes.
An attribute shared by the gadd and MyD genes is their ability to markedly suppress growth when expressed in human and murine cells (24, 37). When transiently expressed in various human tumor cell lines,gadd34/MyD116 is growth inhibitory and this gene can synergize with gadd45 or gadd153 in suppressing cell growth (24). These results and those discussed above suggest that gadd34/MyD116, gadd45,gadd153, and MyD118 represent a novel class of mammalian genes encoding acidic proteins that are regulated during DNA damage and stress and involved in controlling cell growth (24, 37). In this context, PEG-3 would appear to represent a paradox, since its expression is elevated in cells displaying an in vivo proliferative advantage and a progressed-transformed and tumorigenic phenotype.
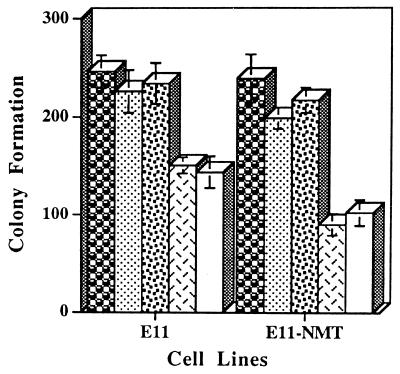
To determine the effect of PEG-3 on growth, E11 and E11-NMT cells were transfected with the protein coding region of the_PEG-3_ gene cloned into a Zeocin expression vector, pZeoSV (Fig. 6). This construct permits an evaluation of growth in Zeocin in the presence and absence of_PEG-3_ expression. E11 and E11-NMT cells were also transfected with the p21 (mda-6) and mda-7 genes, previously shown to display growth inhibitory properties (25, 26, 29). Colony formation in both E11 and E11-NMT cells is suppressed 10–20%, whereas the relative colony formation following p21 (mda-6) and mda-7 transfection is decreased by 40–58% (Fig. 6 and data not shown). Colony formation is also reduced by 10–20% when PEG-3 is transfected into CREF, normal human breast (HBL-100), and human breast carcinoma (MCF-7 and T47D) cell lines (data not shown). Although the gadd and_MyD_ genes were not tested for growth inhibition in E11 or E11-NMT cells, previous studies indicate colony formation reductions of 50–75% in several cell types transfected with gadd34,gadd45, gadd153, MyD116, or_MyD118_ (24, 37). The lack of dramatic growth-suppressing effects of PEG-3 and its direct association with the progression state suggest that this gene may represent a unique member of this acidic protein gene family that directly functions in regulating progression. This may occur by constitutively inducing signals that would normally only be generated during genomic stress. In this context, PEG-3 might function to alter genomic stability and facilitate tumor progression. This hypothesis is amenable to experimental confirmation.
Figure 6.
Effect of transfection with PEG-3, mda-7, and p21 (mda-6) on colony formation of E11 and E11-NMT cells in monolayer culture. Target cells were transfected with 10 μg of a Zeocin vector (pZeoSV), the PEG-3 gene cloned in pZeoSV (PEG-3), the pREP4 vector, the mda-7 gene cloned in pREP4 (mda-7), and the mda-6 (p21) gene cloned in pREP4 (p21 (mda-6). Data represent the average number of Zeocin- or hygromycin (pREP4 transfection)-resistant colonies ± SD for four plates seeded at 1 × 10⁵ cells per 6-cm plate. Created by potrace 1.16, written by Peter Selinger 2001-2019 , Zeocin vector; ░⃞, PEG-3; Created by potrace 1.16, written by Peter Selinger 2001-2019 , pREP4 vector; ▩, mda-7; □, p21 (mda-6).
PEG-3 Induces a Progression Phenotype in Ad5-Transformed RE Cells.
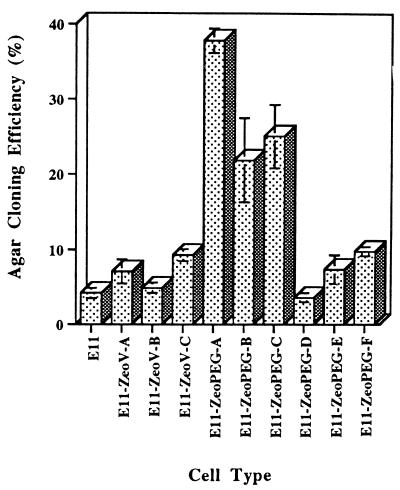
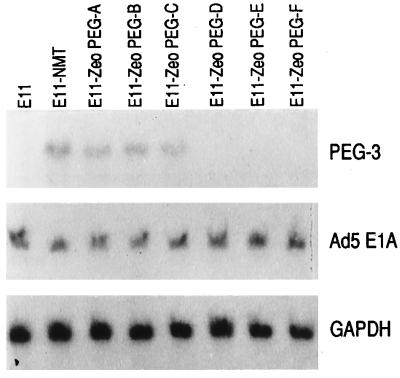
An important question is whether PEG-3_expression simply correlates with transformation progression or whether it can directly contribute to this process. To distinguish between these two possibilities we have determined the effect of stable elevated expression of PEG-3 on expression of the progression phenotype in E11 cells. E11 cells were transfected with a Zeocin expression vector either containing or lacking the_PEG-3 gene, and random colonies were isolated and evaluated for anchorage-independent growth (Fig.7). A number of clones were identified that displayed a 5- to 9-fold increase in agar cloning efficiency in comparison with E11 and E11-Zeocin vector-transformed clones. To confirm that this effect was indeed the result of elevated_PEG-3_ expression, independent Zeocin-resistant E11 clones either expressing or not expressing the progression phenotype were analyzed for PEG-3 mRNA expression (Fig.8). This analysis indicates that elevated anchorage independence in the E11 clones correlates directly with increased PEG-3 expression. In contrast, no change in Ad5 E1A or GAPDH mRNA expression is detected in the different clones. These findings demonstrate that PEG-3 can directly induce a progression phenotype without altering expression of the Ad5 E1A transforming gene. Further studies are required to define the precise mechanism by which PEG-3 elicits this effect.
Figure 7.
Effect of stable PEG-3 expression on anchorage-independent growth of E11 cells. Agar cloning efficiency of E11, Zeocin-resistant pZeoV (vector)-transfected E11, and Zeocin-resistant pZeoPEG-transfected E11 cells. Average number of colonies developing in four replicate plates ± SD.
Figure 8.
Expression of PEG-3, Ad5 E1A, and GAPDH RNA in pZeoPEG-transfected E11 cells. The experimental procedure was as described in the legend to Fig. 1. Blots were probed sequentially with PEG-3, Ad5 E1A, and GAPDH. The E11-ZeoPEG clones are the same clones analyzed for anchorage independence in Fig. 7.
Cancer is a progressive disease characterized by the accumulation of genetic alterations in an evolving tumor (1–6). Recent studies provide compelling evidence that mutations in genes involved in maintaining genomic stability, including DNA repair, mismatch repair, DNA replication, microsatellite stability, and chromosomal segregation, may mediate the development of a mutator phenotype by cancer cells, predisposing them to further mutations resulting in tumor progression (38). Identification and characterization of genes that can directly modify genomic stability and induce tumor progression will provide significant insights into cancer development and evolution. This information would be of particular benefit in defining potentially novel targets for intervening in the cancer process. Although the role of PEG-3 in promoting the cancer phenotype remains to be defined, the current studies suggest a potential causal link between constitutive induction of DNA damage response pathways that may facilitate genomic instability and cancer progression. In this context, constitutive expression of PEG-3 in progressing tumors may directly induce genomic instability or it may induce or amplify the expression of downstream genes involved in this process. Further studies are clearly warranted and will help delineate the role of an important gene, PEG-3, in cancer.
CONCLUSIONS
Subtraction hybridization results in the identification and cloning of a gene PEG-3 with sequence homology and DNA damage-inducible properties similar to gadd34 and MyD116. However,PEG-3 expression is uniquely elevated in all cases of rodent progression analyzed to date, including spontaneous and oncogene-mediated, and overexpression of PEG-3 can induce a progression phenotype in Ad5-transformed cells. Our studies suggest that PEG-3 may represent an important gene that is both associated with (diagnostic) and causally related to cancer progression. They also provide a potential link between constitutive expression of a DNA damage response pathway and progression of the transformed phenotype.
Acknowledgments
We thank Drs. Albert Fornace, Jr., Barbara Hoffman, and Dan Liebermann for supplying the gadd34 and _MyD116_cDNAs. We thank Dr. John Smith (Corixa Corp., Seattle) for confirmation of the DNA sequence of the PEG-3 cDNA. This research was supported in part by National Institutes of Health Grant CA35675 and the Chernow Endowment. P.B.F. is a Chernow Research Scientist.
ABBREVIATIONS
PEG-3
progression elevated gene-3
gadd34
growth arrest and DNA damage-inducible gene 34
MyD116
myeloid differentiation-inducible gene 116
Ad5
type 5 adenovirus
RE
rat embryo
HPV-18
human papillomavirus type 18
AZA
5-azacytidine
CREF
cloned rat embryo fibroblast
mda
melanoma differentiation associated
GAPDH
glyceraldehyde-3-phosphate
References
- 1.Fisher P B. In: Tumor Promotion and Cocarcinogenesis in Vitro: Mechanisms of Tumor Promotion. Slaga T J, editor. Boca Raton, FL: CRC; 1984. pp. 57–123. [Google Scholar]
- 2.Bishop J M. Cell. 1991;64:235–248. doi: 10.1016/0092-8674(91)90636-d. [DOI] [PubMed] [Google Scholar]
- 3.Vogelstein B, Kinzler K W. Trends Genet. 1991;9:138–141. doi: 10.1016/0168-9525(93)90209-z. [DOI] [PubMed] [Google Scholar]
- 4.Knudson A G. Proc Natl Acad Sci USA. 1993;90:10914–10921. doi: 10.1073/pnas.90.23.10914. [DOI] [PMC free article] [PubMed] [Google Scholar]
- 5.Levine A J. Annu Rev Biochem. 1993;62:623–651. doi: 10.1146/annurev.bi.62.070193.003203. [DOI] [PubMed] [Google Scholar]
- 6.Hartwell L H, Kastan M B. Science. 1994;266:1821–1828. doi: 10.1126/science.7997877. [DOI] [PubMed] [Google Scholar]
- 7.Fisher P B, Goldstein N I, Weinstein I B. Cancer Res. 1979;39:3051–3057. [PubMed] [Google Scholar]
- 8.Fisher P B, Dorsch-Hasler K, Weinstein I B, Ginsberg H S. Nature (London) 1979;281:591–594. doi: 10.1038/281591a0. [DOI] [PubMed] [Google Scholar]
- 9.Fisher P B, Bozzone J H, Weinstein I B. Cell. 1979;18:695–705. doi: 10.1016/0092-8674(79)90124-7. [DOI] [PubMed] [Google Scholar]
- 10.Babiss P B, Zimmer S G, Fisher P B. Science. 1985;228:1099–1101. doi: 10.1126/science.2581317. [DOI] [PubMed] [Google Scholar]
- 11.Duigou G J, Babiss L E, Iman D S, Shay J W, Fisher P B. Mol Cell Biol. 1990;10:2027–2034. doi: 10.1128/mcb.10.5.2027. [DOI] [PMC free article] [PubMed] [Google Scholar]
- 12.Duigou G J, Su Z-z, Babiss L E, Driscoll B, Fung Y-K T, Fisher P B. Oncogene. 1991;6:1813–1824. [PubMed] [Google Scholar]
- 13.Reddy P G, Su Z-z, Fisher P B. In: Chromosome and Genetic Analysis: Methods in Molecular Genetics. Adolph K W, editor. Vol. 1. Orlando, FL: Academic; 1993. pp. 68–102. [Google Scholar]
- 14.Su Z-z, Shen R, O’Brian C A, Fisher P B. Oncogene. 1994;9:1123–1132. [PubMed] [Google Scholar]
- 15.Fidler I J. Cancer Res. 1990;50:6130–6138. [PubMed] [Google Scholar]
- 16.Liotta L A, Steeg P G, Stetler-Stevenson W G. Cell. 1991;64:327–336. doi: 10.1016/0092-8674(91)90642-c. [DOI] [PubMed] [Google Scholar]
- 17.Fidler I J. J Natl Cancer Inst. 1995;87:1588–1592. doi: 10.1093/jnci/87.21.1588. [DOI] [PubMed] [Google Scholar]
- 18.Fisher P B, Babiss L E, Weinstein I B, Ginsberg H S. Proc Natl Acad Sci USA. 1982;79:3527–3531. doi: 10.1073/pnas.79.11.3527. [DOI] [PMC free article] [PubMed] [Google Scholar]
- 19.Boylon J F, Jackson J, Steiner M, Shih T Y, Duigou G J, Roszman T, Fisher P B, Zimmer S G. Anticancer Res. 1990;10:717–724. [PubMed] [Google Scholar]
- 20.Boylon J F, Shih T Y, Fisher P B, Zimmer S G. Mol Carcinog. 1992;3:118–128. doi: 10.1002/mc.2940050207. [DOI] [PubMed] [Google Scholar]
- 21.Su Z-z, Austin V N, Zimmer S G, Fisher P B. Oncogene. 1993;8:1211–1219. [PubMed] [Google Scholar]
- 22.Su Z-z, Yemul S, Estabrook A, Friedman R M, Zimmer S G, Fisher P B. Int J Oncol. 1995;7:1279–1284. doi: 10.3892/ijo.7.6.1279. [DOI] [PubMed] [Google Scholar]
- 23.Jiang H, Fisher P B. Mol Cell Differ. 1993;1:285–299. [Google Scholar]
- 24.Zhan Q, Lord K A, Alamo I, Jr, Hollander M C, Carrier F, Ron D, Kohn K W, Hoffman B, Liebermann D A, Fornace A J., Jr Mol Cell Biol. 1994;14:2361–2371. doi: 10.1128/mcb.14.4.2361. [DOI] [PMC free article] [PubMed] [Google Scholar]
- 25.Jiang H, Lin J, Su Z-z, Kerbel R S, Herlyn M, Weissman R B, Welch D R, Fisher P B. Oncogene. 1995;10:1855–1864. [PubMed] [Google Scholar]
- 26.Jiang H, Lin J J, Su Z-z, Goldstein N I, Fisher P B. Oncogene. 1995;11:2477–2486. [PubMed] [Google Scholar]
- 27.Su Z-z, Leon J A, Jiang H, Austin V A, Zimmer S G, Fisher P B. Cancer Res. 1993;53:1929–1938. [PubMed] [Google Scholar]
- 28.Jiang H, Su Z-z, Datta S, Guarini L, Waxman S, Fisher P B. Int J Oncol. 1992;1:227–239. doi: 10.3892/ijo.1.2.227. [DOI] [PubMed] [Google Scholar]
- 29.Jiang H, Su Z-z, Lin J J, Goldstein N I, Young C S H, Fisher P B. Proc Natl Acad Sci USA. 1996;93:9160–9165. doi: 10.1073/pnas.93.17.9160. [DOI] [PMC free article] [PubMed] [Google Scholar]
- 30.Su Z-z, Grunberger D, Fisher P B. Mol Carcinog. 1991;4:231–242. doi: 10.1002/mc.2940040310. [DOI] [PubMed] [Google Scholar]
- 31.Fisher P B, Weinstein I B, Eisenberg D, Ginsberg H S. Proc Natl Acad Sci USA. 1978;75:2311–2314. doi: 10.1073/pnas.75.5.2311. [DOI] [PMC free article] [PubMed] [Google Scholar]
- 32.Fornace A J, Jr, Alamo I, Jr, Hollander M C. Proc Natl Acad Sci USA. 1988;85:8800–8804. doi: 10.1073/pnas.85.23.8800. [DOI] [PMC free article] [PubMed] [Google Scholar]
- 33.Lord K A, Hoffman-Liebermann B, Liebermann D A. Oncogene. 1990;5:387–396. [PubMed] [Google Scholar]
- 34.Lord K A, Hoffman-Liebermann B, Liebermann D A. Nucleic Acids Res. 1990;18:2823. doi: 10.1093/nar/18.9.2823. [DOI] [PMC free article] [PubMed] [Google Scholar]
- 35.Chou J, Roizman B. Proc Natl Acad Sci USA. 1994;91:5247–5251. doi: 10.1073/pnas.91.12.5247. [DOI] [PMC free article] [PubMed] [Google Scholar]
- 36.He B, Chou J, Liebermann D A, Hoffman B, Roizman B. J Virol. 1996;70:84–90. doi: 10.1128/jvi.70.1.84-90.1996. [DOI] [PMC free article] [PubMed] [Google Scholar]
- 37.Vairapandi M, Balliet A G, Fornace A J, Jr, Hoffman B, Liebermann D A. Oncogene. 1996;11:2579–2594. [PubMed] [Google Scholar]
- 38.Loeb L A. Cancer Res. 1994;54:5059–5063. [PubMed] [Google Scholar]
