T. Rowe Price Gets Ready for an Upside Breakout (original) (raw)
After a lot of sideways action.
T. Rowe Price Group (TROW) has been stuck in a wide sideways trading range since around the middle of 2015. This sideways range could continue a while longer, but the price action the past three months suggests an upside breakout could be ready to happen. Today's upgrade by our quantitative service is coming at an opportune time.
Let me point out the bullish clues and suggest how I would position TROW from the long side. Let's start with a daily bar chart.

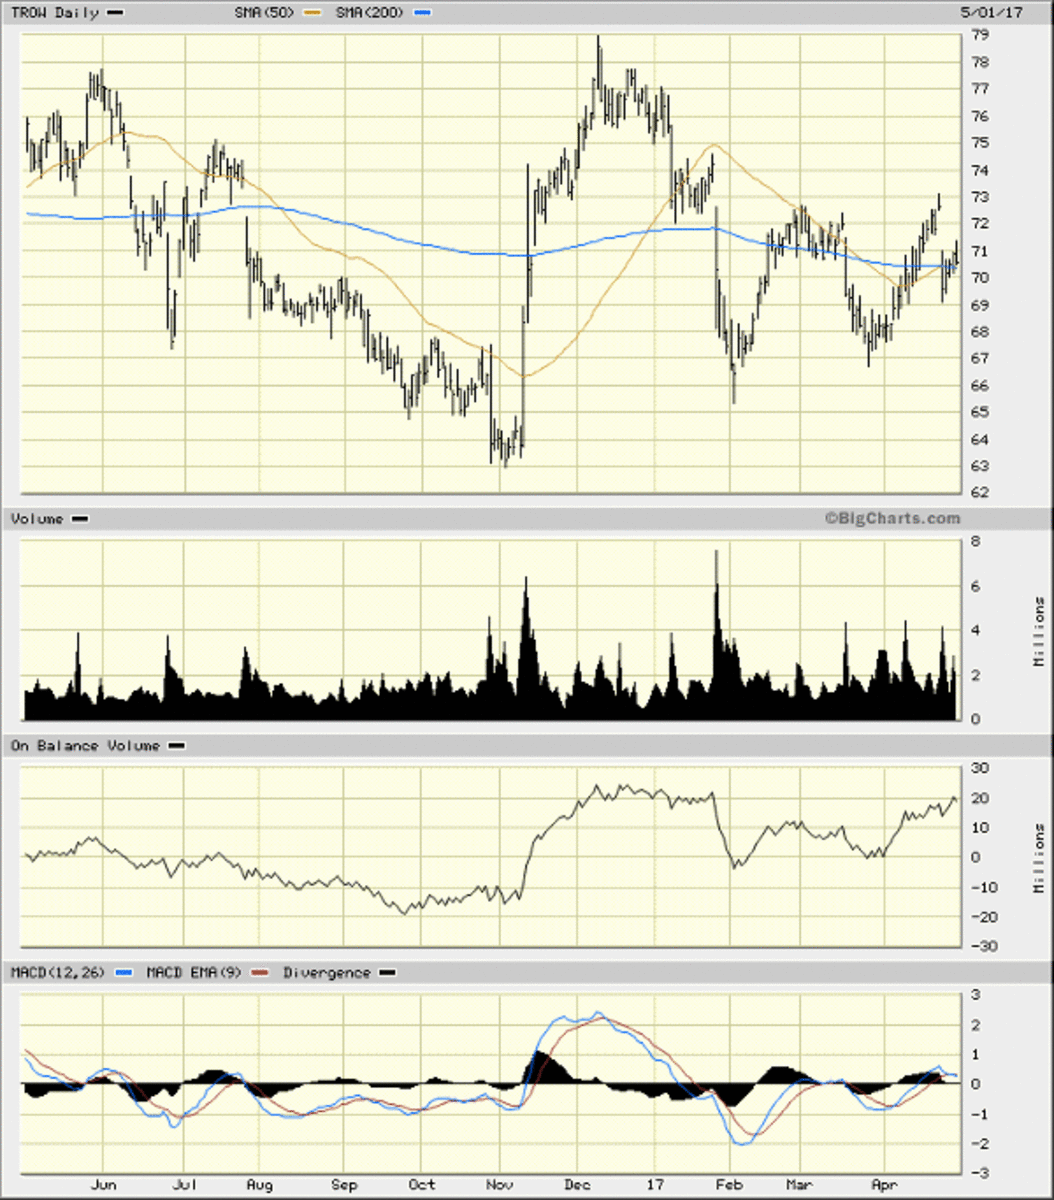
In this daily bar chart of TROW, above, we can see prices have made higher lows from early November to early February to late March. Besides the December high, we have roughly equal highs at $73 in March and April. TROW is just above the 50-day and 200-day moving average lines. The On-Balance-Volume (OBV) line has been moving up since late September and is not far from breaking its December zenith. The MACD oscillator just crossed above the zero line for an outright go-long signal.

In this weekly chart of TROW, above, we can see prices are just above the declining 40-week moving average line. The weekly OBV line has been positive since late October and tells us that buyers have been more aggressive for the past six months. The weekly MACD oscillator is giving a cover-shorts buy signal and is close to an outright go-long signal.
Bottom line: Go long TROW on strength above 73andthenriskbelow73 and then risk below 73andthenriskbelow68. A breakout over $79 will be very bullish.
Employees of TheStreet are restricted from trading individual securities.