Ventas Looks Stagnant for Now But Could See Shares Rise Later This Year (original) (raw)
The technical signs of the provider of senior housing are mixed at present.
For his second Executive Decision segment of "Mad Money" Monday, host Jim Cramer spoke with Debra Cafaro, chairman and CEO of Ventas Inc. (VTR) , a REIT that has seen its shares rise 17% year to date as the senior housing market makes a comeback post-pandemic.
Cafaro said Ventas is benefiting from internal growth and consolidation in its industry. Being an industry leader, Ventas was able to acquire New Senior Investment Group (SNR) , a deal that is expected to close before year end.
Cafaro also is bullish on Ventas' outpatient facilities. As the pandemic began and patients fled hospitals, outpatient facilities and offices were in demand. Now senior living is adding to that growth, making for a strong portfolio at Ventas, she said.
Let's check out the charts of VTR, which we have not reviewed since March 24, 2020.
In this updated daily bar chart of VTR, below, we can see that prices have recovered over the past 12 months. Prices are trading around the rising 50-day moving average line and above the rising 200-day line. The On-Balance-Volume (OBV) line shows strength from early November but has turned neutral in recent weeks. The Moving Average Convergence Divergence (MACD) oscillator has stayed above the zero line since November but most of the time it has been pointed downward, telling us the strength of the uptrend is fading.
In this weekly Japanese candlestick chart of VTR, below, we can see that prices have increased three-fold since their COVID low in March 2020. Prices are trading above the rising 40-week moving average line. The candles have turned to spinning top patterns that could signal a top reversal if we get bearish confirmation. The weekly OBV line has not kept pace with the price gains and is pointed lower. The MACD oscillator has crossed to the downside for a take profits sell signal.
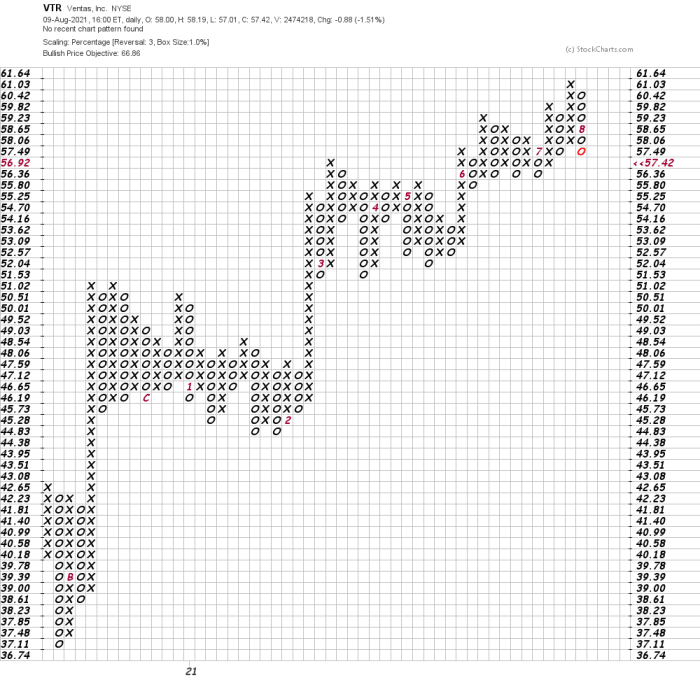
In this daily Point and Figure chart of VTR, below, we can see a potential upside price target in the 67area.Atradeat67 area. A trade at 67area.Atradeat55.80 could weaken this chart.
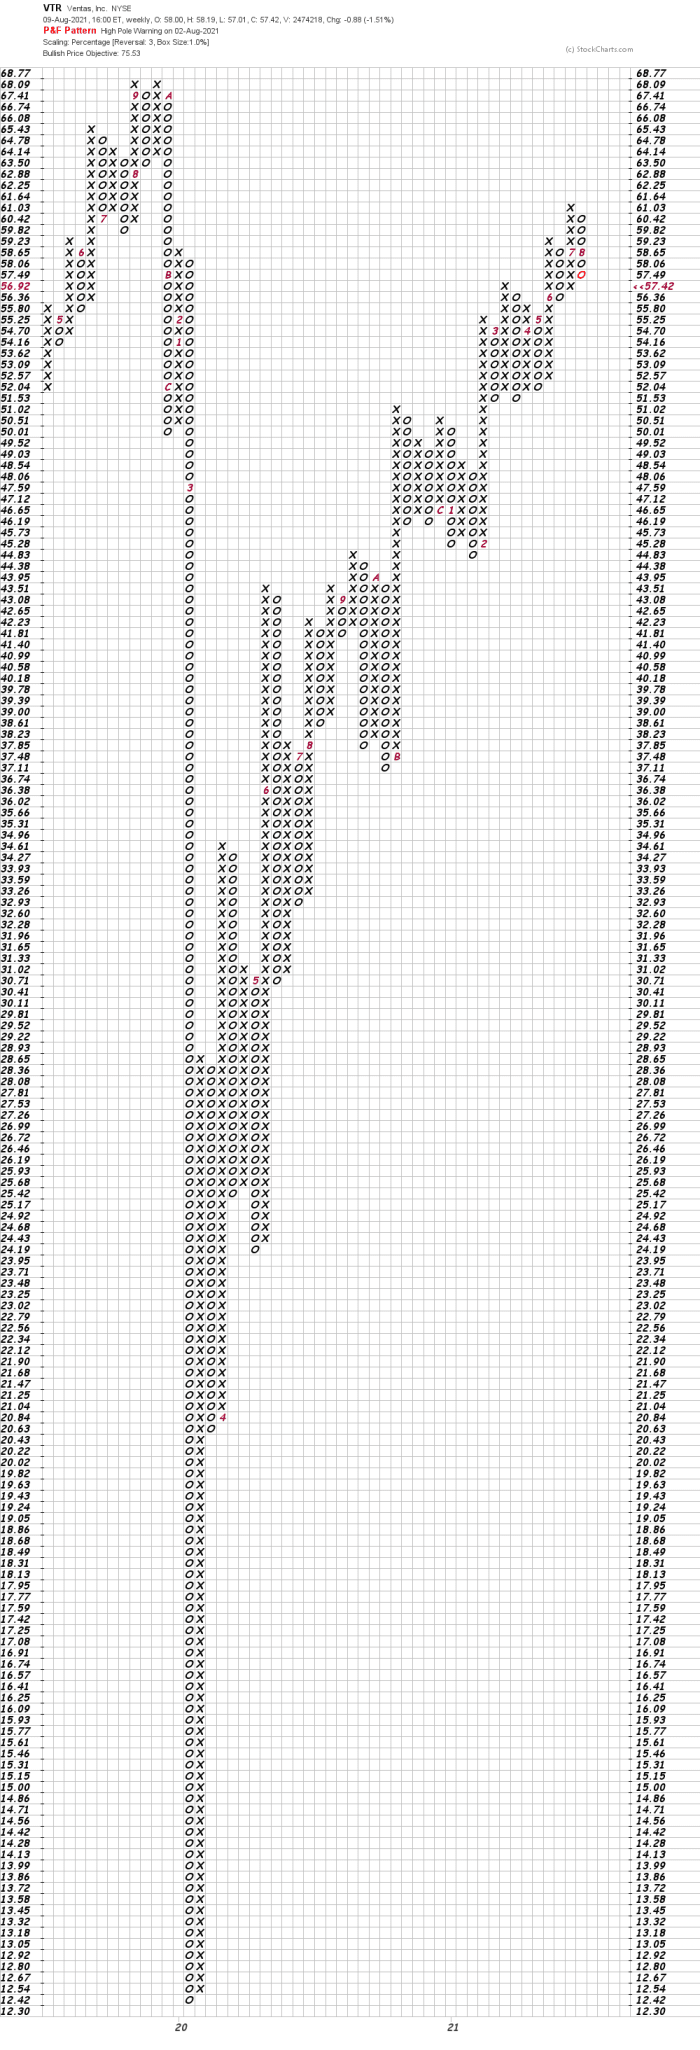
In this weekly Point and Figure chart of VTR, below, we can see a price target in the $76 area.
Bottom line strategy: In the short run it looks like VTR could trade sideways for several weeks, but higher price targets on the Point and Figure charts suggest new highs are possible later in the year. Let's revisit the charts and indicators in a few weeks.
Employees of TheStreet are prohibited from trading individual securities.