A No-Big-Deal Decline (original) (raw)
Special Note: Top Stocks will not appear this weekend but will resume publication on Monday evening, January 6.
Much will be made about the market being down on the first trading day of the New Year. This was the first time since January 2008 -- which we know was a terrible year for investors. But we were down on the first day of 1999 as well and that was not exactly a bad year, especially if you owned technology stocks.
Statistics will be thrown around on the first trading day of the year, to which I would say: You should not panic, nor should you rejoice. It is what it is. But if the market is still down fifth trading day of the year, then there are statistics that would be worth paying attention to.
Today, there was very little selling in the market. Oh, some defensive names got hit hard, and they did so on volume. But everything else experienced more of a casual drip than a serious flood of selling. The best example I can offer is that the Nasdaq lost 33 points and the net of up volume minus down volume was -280 million shares. Consider that Tuesday's 22-point gain saw net volume at +485 million shares.
This might very well change. But for now, there has been very little selling. I would not be surprised if we had a rally attempt tomorrow, especially with the snowstorm plowing into the Northeast; it ought to be a slow day.
On a trading basis, there are some gaps to fill that are relatively close on the major indices. The S&P 500 has one that is far away (at 1820), so I would say watch the Nasdaq and the Russell as their gap fills will come on the scene earlier. The Nasdaq has a gap fill around 4100-4111, and the Russell has one at 1146.
If we cannot rally from those gap fills -- and more importantly, if we rally but buying is light and negative divergences appear -- then that will be a concern. We already know sentiment is too bullish.
For now, today's decline looks like a typical overbought pullback.
Note: Due to a family function that I must attend this weekend, I will not write a letter for Monday morning. I will return -- with no more planned days off! -- on Monday evening.
Read Helene's latest column here.
New Ideas
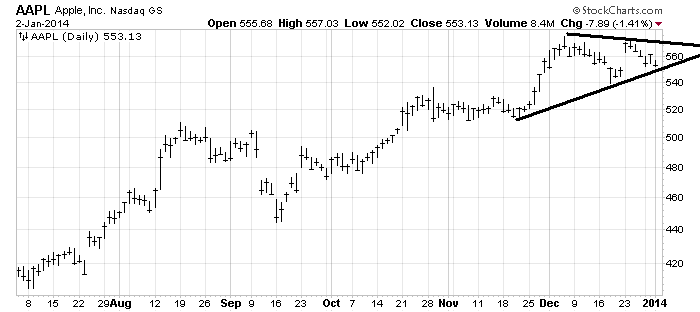
I have been asked several questions about Apple (AAPL:Nasdaq) of late, so I want to address the chart. Please understand that as a person who looks at charts, who is not a trader, I need to see a pattern develop before I am comfortable advising readers to go long or short. Apple has been in a 30-point trading range for a month now, so to my eyes, there is no pattern to discern.
What I can point out is that there is a little gap fill around 550fromjustpriortoChristmas.Thatisapproximatelywheretheuptrendlinecomesinaswell.Icouldseethestockbouncingfromthatlevel.Iwouldfretifitcouldnotrally,orifitralliedbutcouldnotgetover550 from just prior to Christmas. That is approximately where the uptrend line comes in as well. I could see the stock bouncing from that level. I would fret if it could not rally, or if it rallied but could not get over 550fromjustpriortoChristmas.Thatisapproximatelywheretheuptrendlinecomesinaswell.Icouldseethestockbouncingfromthatlevel.Iwouldfretifitcouldnotrally,orifitralliedbutcouldnotgetover560.
Today's Indicator
The 10-day moving average of the put/call ratio was in the 80s for the first time in more than two weeks. The moving average is trying to turn up (bearish).
Q&A
Helene welcomes your questions about Top Stocks_and her charting strategy and techniques. Please send an email directly to Helene with your questions. However, please remember that_ TheStreet.com Top Stocks is not intended to provide personalized investment advice.
Email Helene here.
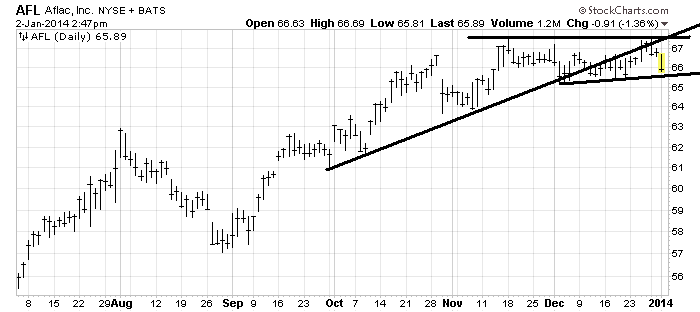
Aflac (AFL) always makes me think of the duck in its commercials, which I suppose is what the advertising agency intended. AFL is not a pretty chart, but it has not broken yet. Breaking $65 would complete that top.
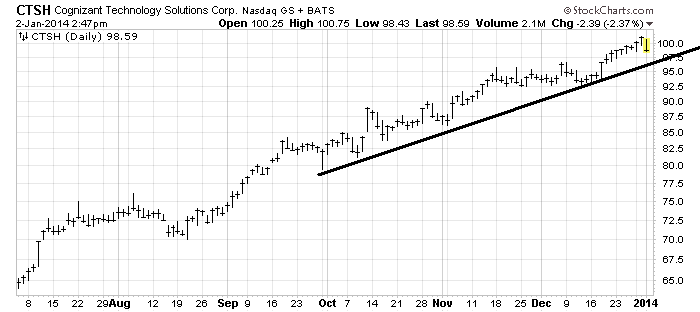
Cognizant Technology Solutions (CTSH:Nasdaq) might have had a bad day today, but I see no reason why it should not bounce off that uptrend line when it gets down there. The chart has been making higher highs and higher lows for months now, so until that pattern changes, I advise giving this uptrend the benefit of the doubt.
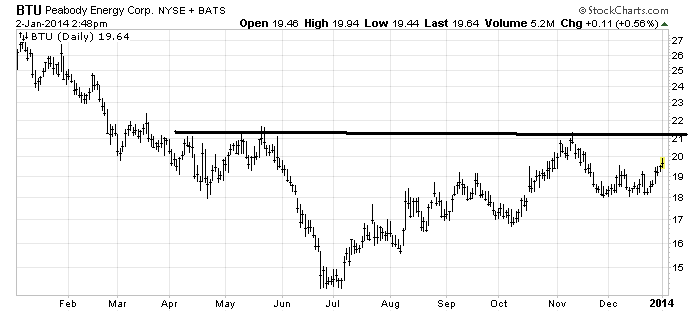
I was asked to follow up on Peabody Energy (BTU) , which I wrote up as a positive chart just prior to my vacation. You can see the resistance at 21,whichIthinkwillbesubstantial.Takingalong−termview,ifthestockgetsthrough21, which I think will be substantial. Taking a long-term view, if the stock gets through 21,whichIthinkwillbesubstantial.Takingalong−termview,ifthestockgetsthrough21, it would measure to the upper 20s.Butconsideringthatcoalhasbeensmackeddowneverytimeithaslifteditselfup,startwithresistanceat20s. But considering that coal has been smacked down every time it has lifted itself up, start with resistance at 20s.Butconsideringthatcoalhasbeensmackeddowneverytimeithaslifteditselfup,startwithresistanceat21-ish and put in a stop under 18.50or18.50 or 18.50or19. You could use $18, which is obvious as the prior low. But if BTU comes all the way back there, it will look like a failure to me.