Most Stocks Reclaimed What They Just Lost (original) (raw)
NYSE and Nasdaq have not seen much expansion, but even if we get expansion this coming week, we still need to acknowledge that there hasn’t been expansion up until this point.
The Market
I am going to spend a lot of time in the coming days and weeks talking about breadth and sentiment. Yes I know I have done so for the last few weeks, but that’s the theme.
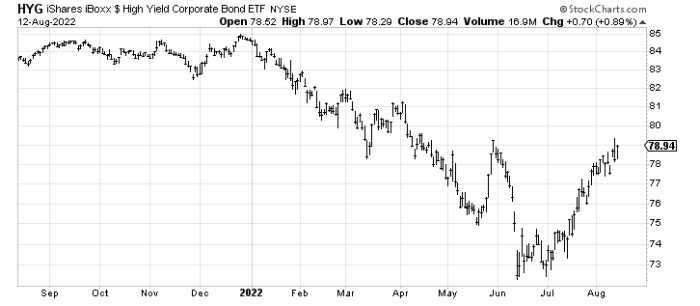
Before I get to that, we continue to have stocks at resistance. If you own individual stocks, you can feel it in Friday’s rally. Most stocks simply reclaimed what they lost midday on Thursday. Just look at the iShares iBoxx High Yield Corporate Bond ETF (HYG) chart to see what many charts looked like in those two days: back off from resistance and then recapture some of it.
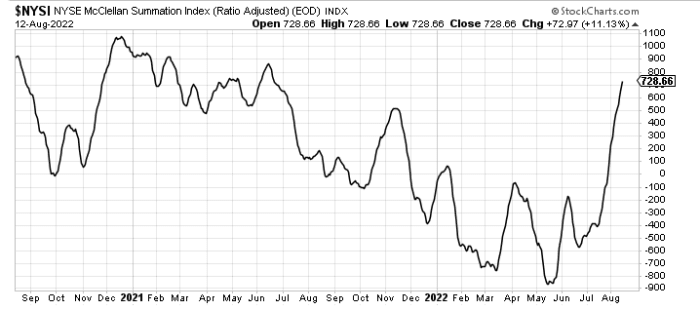
Now for breadth. It continues to be good. The McClellan Summation Index is at a one-year high. That doesn’t mean the market isn’t overbought (it is) but good breadth is not bearish.
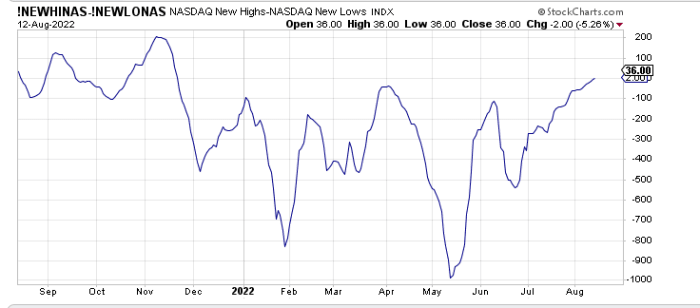
The part of breadth that is a little bit problematic is the fact that the number of stocks making new highs has been stagnant. The NYSE and Nasdaq have not seen much expansion. Even if we get expansion, this coming week, we still need to acknowledge that there hasn’t been expansion up until this point. However, the 10-day moving average of net new highs minus new lows on Nasdaq is now the highest since November last year. I grant you a net number of 36 is not great, but the moving average has moved up. The chart is below.
Then there is sentiment which is at an interesting juncture. It is in no way extreme. It has not been extreme in the two months we’ve been rallying. We are seeing some inkling of a shift but typically after two months of rallying we’d see a bigger shift. To recap, the Investors Intelligence bulls and bears have swapped places, with bulls now at 44% and bears at 27%. Those two readings are neutral although I expect we will see an increase in bulls this coming week (they are released on Wednesday). Once the bulls get over 50%, I’ll consider the change in sentiment solidified. Over 60% is extreme.
The American Association of Individual Investors bulls and bears have shifted but we still have more bears than bulls so I cannot say these folks are too bullish, can I? The National Association of Active Investment Managers exposure is up to 71 so that is now neutral to leaning bullish (too bullish is over 80 and extreme is over 90.)
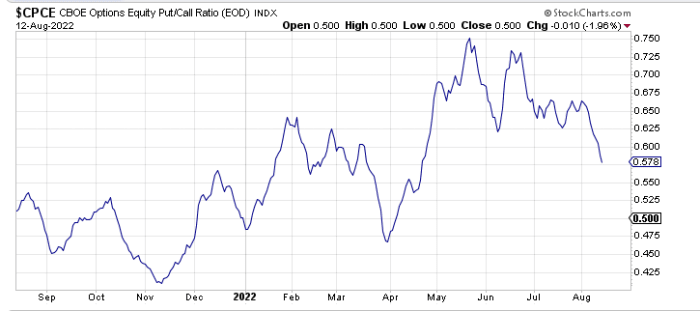
Then there is the put/call ratio, which has been stubbornly high. This is very unusual for a rally to have so many puts bought on a regular basis. However, on Thursday and Friday last week the equity put/call ratio came down to 0.51 and 0.5 respectively. Extreme? No. A big change? Yes. You see it was 0.7 on Tuesday. So clearly the sand was shifting late in the week. You can see it on the 10-day moving average chart. It has started to come down with some oomph in the last week. It now resides at 0.57. Again this is not extreme (a reading in the 40s would be bordering on extreme) but consider that 8 of the last 10 days has seen a reading sub 0.60. So clearly sentiment is shifting.
Finally, we’re watching the Daily Sentiment Index for the CBOE Volatility Index . It now stands at 15. It takes a lot to get from 15 to single digits. It also takes a lot to go from 85 to 90. That’s why those extreme readings (under 10 and over 90) tend to work with this indicator — because it takes so much for it to get there. I will continue to consider this a yellow flashing light. It turns red with a single-digit reading.
This pretty much leaves us where we’ve been: an overbought market with good breadth and sentiment shifting but not extreme.
If you would like to hear me describe the current sentiment, I did a video with Blake Morrow of the Trader’s Summit on Thursday last week all about sentiment. https://www.youtube.com/watch?v=-uZwy9CkyS0&feature=youtu.be
New Ideas
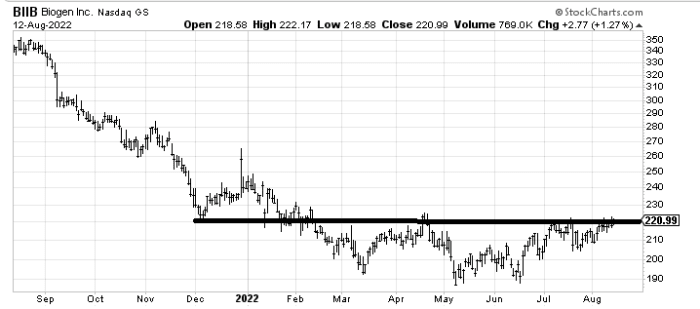
I recommended Biogen (BIIB:Nasdaq) about a month ago and the stock has done nothing. Yet I can’t help thinking if it can ever get up and over this 220−220-220−222 area it should really improve. It is working on a six-month base now.
Today’s Indicator
The 10-day moving average of new highs minus new lows is discussed above.
Q&A/Reader’s Feedback
Helene welcomes your questions about Top Stocks and her charting strategy and techniques. Please send an email directly to Helene with your questions. However, please remember that TheStreet.com Top Stocks is not intended to provide personalized investment advice. Email Helene**here**.
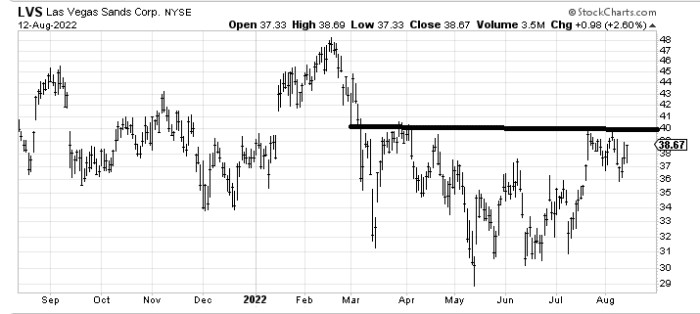
Just prior to my vacation I recommended Wynn (WYNN:Nasdaq) and it immediately went plop and then came back up with a vengeance so naturally I was asked about Las Vegas Sands (LVS) . A move over 40wouldcompleteasix−monthbase.Astopunder40 would complete a six-month base. A stop under 40wouldcompleteasix−monthbase.Astopunder35 seems right but far away.
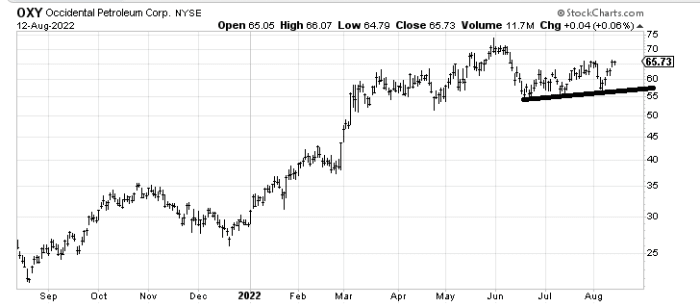
I have no real issue with Occidental Petroleum (OXY) except that it has resistance at 70andnevercorrectedasdeeplyasIwouldlike.Aslongasitstaysover70 and never corrected as deeply as I would like. As long as it stays over 70andnevercorrectedasdeeplyasIwouldlike.Aslongasitstaysover55, it’s okay. I prefer Valero (VLO) and Chevron (CVX) that I have highlighted.
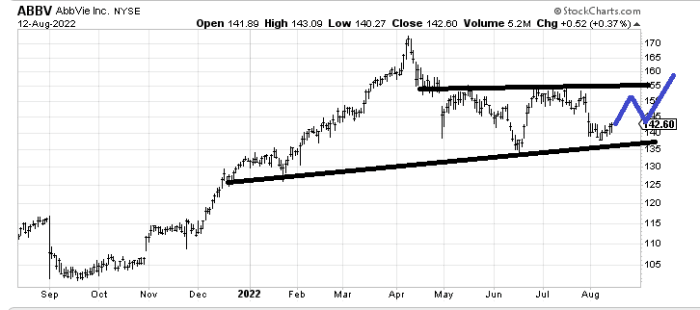
AbbVie (ABBV) seems like a decent risk/reward here because under that lower line ($135-ish) and you know you are wrong. There is resistance at 150−150-150−155. I’ve drawn in blue how it might play out.