Seeing Red (original) (raw)
The Market
A funny thing happened on our way to the oversold condition: The S&P made a new closing low (relative to January), but Nasdaq did not. And the Russell 2000 certainly did not.
Sure, that could all easily change tomorrow for Nasdaq, because it’s a mere 30 points from making a new closing low, but here’s something else interesting. Nasdaq has been red for four straight days; in this entire decline in 2022, it has not gone to five red in a row.
The last time it did so was in September.
I would prefer if Nasdaq was down for another day or two because that would set us up for quite a decent oversold reading. If we rally tomorrow, we can still have an oversold rally, but not as good as if we wait a few more days. You see that Oscillator will plunge in the next two days if breadth for Nasdaq is poor, setting up a nice oversold condition.
The NYSE isn’t much different. For example, the McClellan Summation Index is still heading down and it needs a net differential of positive 1,900 advancers minus decliners to stop going down. That’s not much. One big up day would get it moving. But if it needed, say, positive 3,000 I’d say it’s oversold (2,000 is lightly oversold; 4,000 is grossly oversold). One or two more days with crummy breadth would get this to at least 3,000 I would think.
Then there is the 30-day moving average of the advance/decline line. Look how low that is. A few more days of negative breadth pushes this to an extreme, making it solidly oversold. I am not so much a stickler for this less sensitive indicator as I am with the shorter- term Oscillator setting up. We’ll say this one is in the oversold zone, although by early next week it is fully oversold. The chart is shown below.
Many seem to think we need some panic to get an oversold rally. I don’t think we do. It helps, but I don’t think it is a necessary ingredient. That's because there is enough bearishness around that I think we could rally anyway.
Lastly, the Daily Sentiment clocked in at 15 for both the S&P and Nasdaq. I should explain one aspect I had forgotten: Futures traded yesterday and that means the DSI was computed and Nasdaq got to 10, while the S&P got to 12. Today’s late-day rally -- and retreat -- is what likely pushed these readings to 15. It's not necessary that we go down the next day or two, another down day would probably take these down to single digits.
Where does that leave us? I still think we’re heading toward an oversold condition later this week.
New Ideas
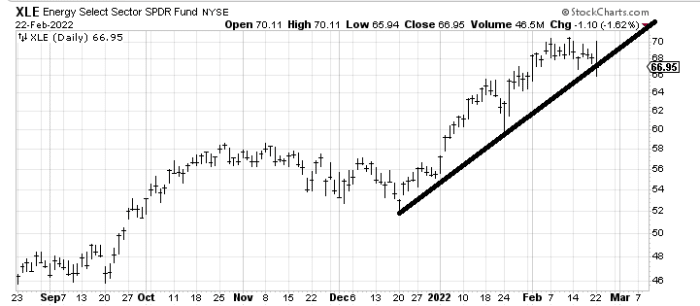
I still think the Energy Select Sector SPDR Fund (XLE:Nasdaq) is going to come down more, even though today’s wild action did not manage to break that line. It may take a few weeks but that’s what I think will happen.
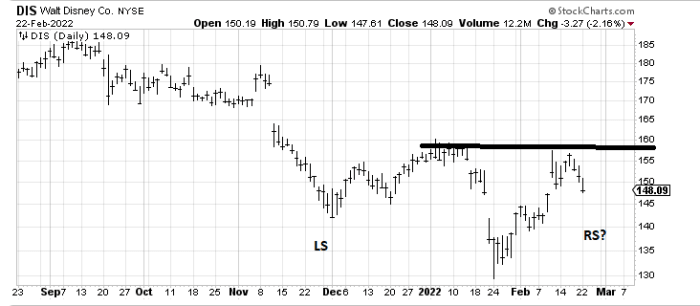
I’ve got my eye on Disney (DIS) , which is giving up its gains from earnings. If the stock can get into that $145 area and hold, I think we have a potential trade back up.
Today’s Indicator
The 30-day moving average of the advance/decline line is discussed above.
Q&A/Reader’s Feedback
Helene welcomes your questions about Top Stocks and her charting strategy and techniques. Please send an email directly to Helene with your questions. However, please remember that TheStreet.com Top Stocks is not intended to provide personalized investment advice. Email Helene here.
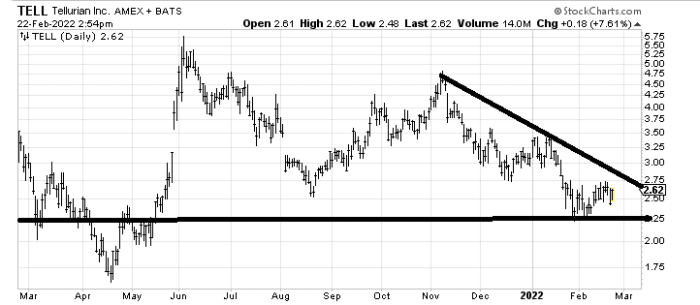
You had better sit down when you read this, because I have something relatively kind to say about a down-and-out stock ... Tellurian (TELL:Amex) has been holding for nearly a month now. If it can get up and over that 2.75area,Idon’tthinkitisoutofthewoodsbutIdothinkitshowsimprovementsincethatisresistancefromtheDecemberlowandthedowntrendline.Itstillhasresistanceallthewayup,butcrossing2.75 area, I don’t think it is out of the woods but I do think it shows improvement since that is resistance from the December low and the downtrend line. It still has resistance all the way up, but crossing 2.75area,Idon’tthinkitisoutofthewoodsbutIdothinkitshowsimprovementsincethatisresistancefromtheDecemberlowandthedowntrendline.Itstillhasresistanceallthewayup,butcrossing2.75 tells me it is trying to eat through it.
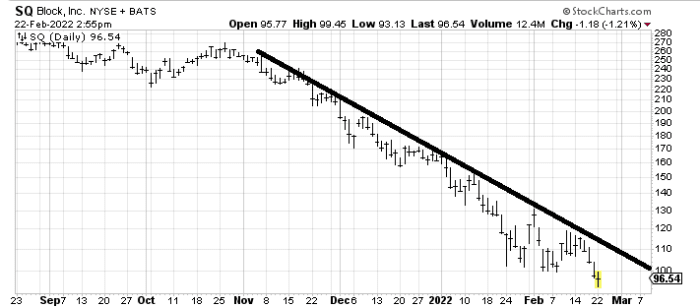
Square or Block (SQ) broke the 100 level, which was the prior low, so I do not like that, but I still see that big downtrend line that comes in this week around 110andifthatcanbecrossed,thenI’dthinkthebreakunder110 and if that can be crossed, then I’d think the break under 110andifthatcanbecrossed,thenI’dthinkthebreakunder100 was a false breakdown. So it’s a matter of what the stock can do on the upside that mattes.
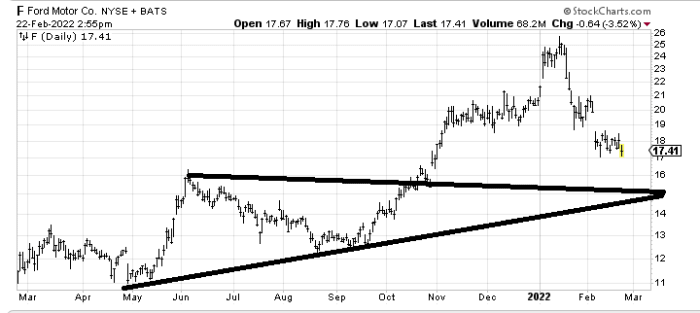
I don’t love the chart of Ford (F) , because if it rallies to 19−19-19−20 all it does is fill the gap and smack its head against resistance. I would like the stock around 15becausethatwouldbeameasuredtargetandsupport.SoarallyfromhereI’dsellaround15 because that would be a measured target and support. So a rally from here I’d sell around 15becausethatwouldbeameasuredtargetandsupport.SoarallyfromhereI’dsellaround20 and I would buy a crack into that $15 area.