The Daily Grind (original) (raw)
The pattern in recent trading days has become clearer, so change may be coming.
The Market
Let’s talk about the pattern that has developed in the market these last few days. You have probably noticed it, since it feels like everyone has, but let me report it anyway. We head down in the morning and spend the entire day grinding the indexes back to at/near unchanged on the day.
There are many who say that means it is a strong market. I have no view on whether a market that rallies in grinding fashion each day is a strong market or not, but I can tell you that today the breadth of the market didn’t come back. I can also tell you that the Russell 2000 closed much closer to its low than its high. And that is the change that has taken place.
One final point about the pattern before we get to today’s statistics: once everyone sees a pattern the pattern tends to change.
The question of the day seems to be when will we get oversold again. It has been three days. That’s it. My gosh. That having been said my own Overbought/Oversold Oscillator will not get oversold until late next week.
The McClellan Summation Index which has very much rolled over now needs a net differential of +1800 advancers minus decliners to stop the decline. At +2000 or greater it steps a toe into oversold. At +4000 it gets to an extreme oversold reading. So yes we are closer to getting oversold but we are not there yet.
That does not mean we can’t rally. Heck, we’ve had three red days in a row. The biggest change is that Nasdaq had its first 3 day string of red days since the middle of October (oh, look, there is that middle of October time frame again!), which is four months. That is a change in pattern to go along with the Nasdaq volume we’ve been discussing.
Speaking of Nasdaq volume it was negative again today, with about 65% of the volume on the downside. However, recall a week ago the Summation Index for Nasdaq required a net negative 8 million shares (up minus down volume) to stop going up which made it overbought. That has reversed course since the Summation Index has turned down and now it needs +4.8 billion shares to get it to stop going down.
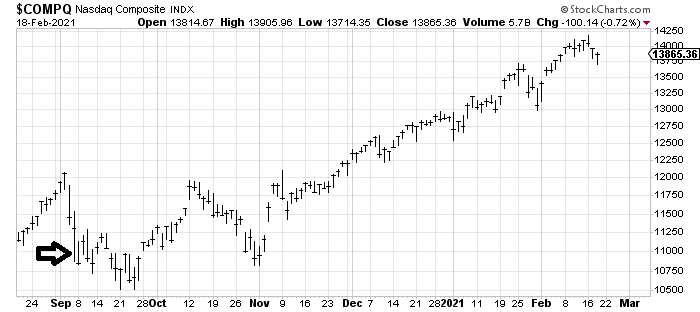
Since by now you’re head is spinning, let’s look at it in chart form. It is a rare event that sees it go from one extreme to the other. The last time it was this high (the ‘what if’) was September 8th.
Here is a chart of Nasdaq so you can see where it was in the scheme of things. The arrow shows September 8th. We bounced and came back down.
The bottom line is I think we can rally Friday, but I don’t think we’re quite done with the pullback yet.
New Ideas
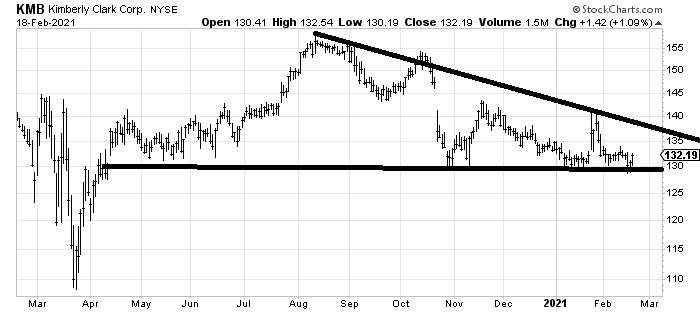
I find myself warming up to Kimberly Clark (KMB) again for the first time since last spring when we had a nice trade in it. I know I am wrong if it trades much under 130 so the risk/reward seems pretty good here.
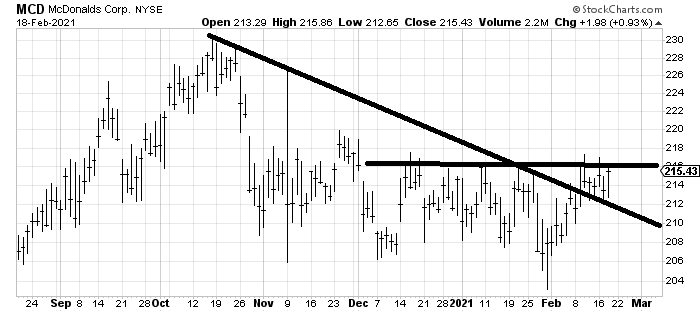
I also find myself thinking McDonald’s (MCD) could bounce since it has spent months going nowhere.
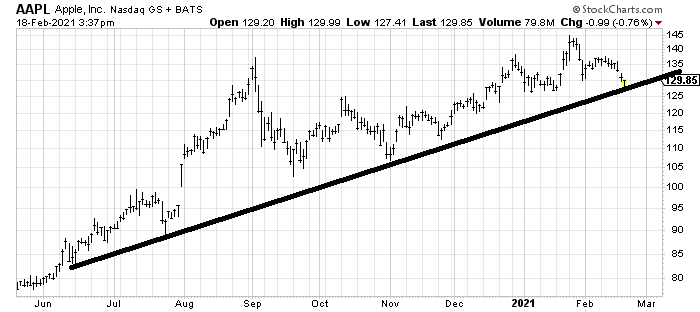
To follow up on the discussion of Apple (AAPL:Nasdaq) from last weekend’s Top Stocks, it has come down to a support line. It is probably oversold enough to bounce but I think 133- 135 is going to be hard to get through.
Today’s Indicator
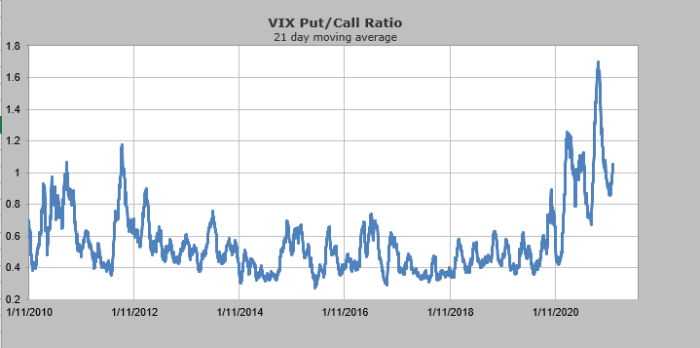
The put/call ratio for the VIX continues to rise. A peak in this 21 day moving average is often associated with a low in stocks.
Q&A/Reader’s Feedback
Helene welcomes your questions about Top Stocks and her charting strategy and techniques. Please send an email directly to Helene with your questions. However, please remember that TheStreet.com Top Stocks is not intended to provide personalized investment advice. Email Helene here.
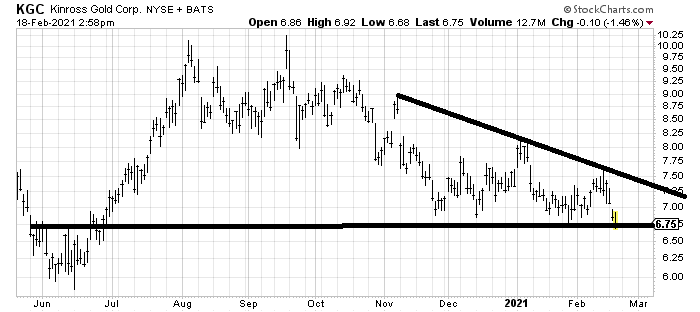
I suspect Kinross Gold (KGC) is oversold enough to bounce but for now I would only be looking for a bounce. I need the pattern to be more developed or sentiment on gold to be more bearish, although I think we are heading in that direction.
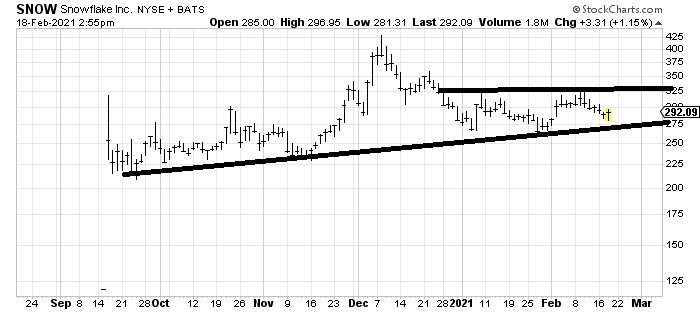
I am quite intrigued with the chart of Snowflake (SNOW) . This could be the right shoulder of a head and shoulders bottom and it is so close to support at $275 that the risk/reward seems good to me.
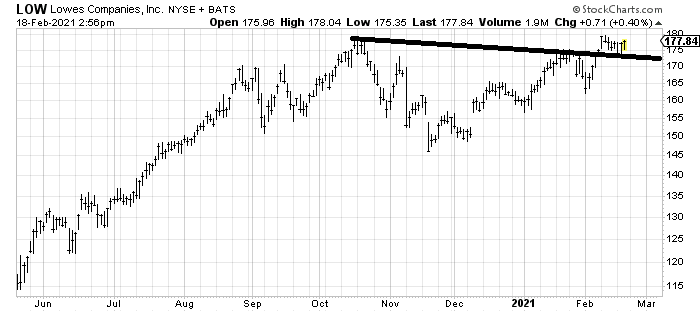
I was asked if Lowes (LOW) is a good play on rebuilding Texas, the way we often see these home improvement stocks rally after a hurricane. The thought is a good one but the chart is also a good one. Through $180 would be a nice mini breakout.